ABSTRACT
This paper focuses on the nutrient dynamics of a tropical estuary on the northeastern Brazilian coast, studied using the LOICZ biogeochemical budgeting protocol. We describe the methodology and assumptions underlying this model. Input data (monthly for rainfall, evaporation, river discharge, and concentrations of salt, phosphorus and nitrogen) were obtained during field campaigns in the Barra das Jangadas Estuary (BJE) over a 5 years period (1999 to 2003). Mass balance results indicate large inputs of nutrients to the system. The model shows that the seasonal variation of the Net Ecosystem Metabolism (NEM) indicates that the system passes from a stage of organic matter liquid production and mineralization during the dry season (–0.5 mmoles C m−2d−1) to liquid mineralization during the rainy season (–19 mmoles C m−2d−1). We suggest that the system varies slightly between autotrophy and het-erotrophy during the year due to the rainfall regime, human activities in the basin (density population and sugarcane plantations), and associated DIP riverine loads. High per capita loads of N and P indicate a high population density and high runoff. The application of flux balance modeling was useful to understand the nutrient dynamics of this typical small tropical estuary.
Key words:Brazil, Barra das Jangadas Estuary, seasonal variations, heterotrophy, autotrophy, carbon dioxide.
INTRODUCTION
Estuaries are dynamic systems, in which biological populations fluctuate according to natural cycles. Wa-ter quality also varies, particularly as seasonal and an-nual climatic patterns change. In these systems tracking environmental changes can be challenging, and distin-guishing impacts caused by human actions from nat-ural variations can be even more difficult (Marone et al. 2005). Under normal estuarine spatial and temporal constraints, reactive materials, such as nutrients, behave non-conservatively due to modifications by biological recycling and chemical transformations acting indepen-dently of simple physical advection and mixing (Dale and Prego 2005).
Correspondence to: Carlos E. D. Noriega E-mail: [email protected]
Furthermore, estuaries are areas in which anthro-pogenic effects, such as increased nutrient loads, have their most direct influence, and where there is a danger of adverse impacts. Most of these impacts results from a complex chain of events varying over different scales in space and time, which can be ultimately attributed to the accumulation of anthropogenic nitrogen and phos-phorus in river water on its way to the ocean (Tappin 2002).
The magnitude of these fluxes is such that the transfer of organic matter from land to ocean via rivers is a key link in global carbon cycles. Due to the intense anthropogenic disturbance, estuaries are often consid-ered to be net heterotrophic ecosystems and act as a source of CO2 (Biswas et al. 2004, Mukhopadhyay et
eutro-phication, enhances net ecosystem production, and shifts the system towards increased autotrophy (Gat-tuso et al. 1998). On the other hand, respiration of the organic carbon leads to increased heterotrophy. Addi-tionally, light may become limiting for primary produc-tion in the upper part of estuaries (Irigoien and Castel 1997); respiration is then the dominant metabolic pro-cess, and an oxygen-depleted zone may occur, stimulat-ing various anaerobic processes. It is well known that the chemical transformation pathways for nitrogen and phosphorus differ markedly from one another (Schle-singer 1997). In addition to being present in inorganic and organic dissolved forms, nitrogen is involved in biotic reactions and is the primary constituent of the atmosphere.
Besides direct uptake and release with respect to organic matter, the biotic processes of nitrogen fixa-tion and denitrificafixa-tion actively move nitrogen between among the atmosphere (as nitrogen gas (N2) and nitrous
oxide (N2O)) and both organic and inorganic forms of
fixed nitrogen. Both nitrate (NO3) and ammonia (NH3)
are highly soluble in water, and dissolved ammonia readily ionizes to ammonium (NH4). Nitrate is an
im-portant byproduct of combustion, while ammonia is a highly volatile byproduct of animal waste. As a result, atmospheric transport and both wet and dry deposition are important pathways by which these materials are delivered to the landscape (Meyers et al. 2001). By contrast, phosphorus is involved in biotic reactions, pri-marily through the relatively simple (though still highly complex) pathways of organic production and oxidation. Phosphorus is also involved in various important min-eral reactions (including both precipitation-dissolution of various forms of the mineral group apatite and ad-sorption-desorption reactions). In general, phosphorus is very particle-reactive and is taken up or released from the particles under changing conditions of pH, redox, and ionic strength. It has no significant gas phase.
The scatter in the loading ratio probably reflects, in large part, different chemical reaction pathways for DIN and DIP. The only real overlap in the reaction path-ways for nitrogen and phosphorus involves production and oxidation of organic matter.
Because the composition ratio of nitrogen to phos-phorus for most terrestrial organic matter is close to
the DIN:DIP loading ratio we observed (approximately 19:1), decomposition of organic matter apparently dom-inates the inorganic nutrient loading, both in absolute range and loading ratio (Smith et al. 2003).
A close link is generally found between ecosystem metabolism and terrestrially derived nutrients in tem-perate ecosystems. It remains difficult to assess com-pletely a function of estuarine ecosystem in response to the input of terrestrial nutrients in tropical area largely because of confounding physical and biogeochemical factors (Eyre and McKee 2002). Therefore, it is of in-terest to know whether a shallow coastal water body is a carbon source or sink, particularly in tropical areas Nutrient budgets can provide valuable information as to whether the system is a net exporter or importer of nutrients and can therefore determine its trophic status. Smith and Hollibaugh (1997) used the term “trophic status” to describe the net balance (net respiration or net synthesis) of organic carbon in an ecosystem. The results of these budgets and the use of stoichiometric tools provide estimates of processes such as net pro-duction/respiration and nitrogen fixation/denitrification (Gordon et al. 1996). To assess carbon sources and sinks through process studies is not a simple task (Gordon et al. 1996). However, proposed guidelines for the Land-Ocean Interactions in the Coastal Zone (LOICZ) pro-gramme to assess non-conservative nutrient fluxes and carbon budgets for well boundary-defined coastal sys-tems. This steady state budgeting method provides an alternative method to evaluate the biogeochemical meta-bolism and fate of nutrients and carbon in coastal systems when direct measurements of productivity and respira-tion are not available. Net nutrient fluxes in the coastal zone can be also determined from budget calculations, which is essential to evaluate the effects of riverine dis-charges on coastal function and carbon metabolism.
The rivers of the Northeast and East are marked by a pattern of seasonal flow typically unimodal, but differ in amplitude. As the climate states, the rivers of the Northeast are subjected to marked seasonal variabil-ity, with high intakes of pulses and floods during the wet season flows and low to negligible in the dry season (Knoppers et al. 2009).
subjected to either humid or semiarid climates (Ekau and Knoppers 1999), and includes the Barra das Jangadas.
The objective of the present work was to charac-terize and model the cultural eutrophication of the BJE to establish the mass balance of N and P throughout the year, considering detailed and complete (rainy and dry season) datasets from 1999 to 2003.
MATERIALS AND METHODS
STUDYAREA
The Barra das Jangadas Estuary (BJE) is the union of the lower course of the Pirapama and Jaboatão rivers, in the state of Pernambuco (Brazil). These basins cover semi-arid areas until they reach regions of intense ur-banization along the coast, where they receive domes-tic and industrial effluents without previous treatment (CPRH 2003) (Noriega et al. 2009). Both rivers suf-fer the impact of domestic and agricultural effluents, mainly from the sugarcane agro-industry, under the form of high Biochemical Oxygen Demand (BOD), es-pecially between November and March (dry season). During the rainy season, the higher freshwater discharge is the product of increased precipitation throughout the hydrographic basin (Araujo et al. 1999, Noriega et al. 2005a) and the controlled outflow from Pirapama Dam (Araujo et al. 2008).
The hydrographic basins of Jaboatão, Pirapama and other small rivers add up to 1000 km2 of drainage
area. BJE is a small estuarine area in which these rivers converge (8.7◦S-8.8◦S and 34.4◦W-34.8◦W). The
estu-(1100 inhabitants km−2) (IBGE 2000). Despite the
de-forestation of the margins and the large volume of indus-trial and domestic effluents received, the estuary itself is surrounded by relatively well-preserved and highly productive mangrove forests. Organic matter pollution by the sugar-cane agroindustry substantially increases during the harvest and milling season, which is from September to February. CPRH (2003) reported high BOD in the harvest periods of 69.6 mg L−1(Jaboatão
River) and 152 mg L−1 (Pirapama River). The
pollut-ing organic load sources are represented mainly by do-mestic sewage in the Jaboatão river (14.46 t BOD d−1)
and by agro-industrial activities in the Pirapama river (24.13 t BOD d−1) (CPRH 2003). Algal blooms are
now more frequent during the year and consist of sev-eral species of Cyanophyceae, mainlyMicrocystis aeru-ginosa,Oscillatoriasp andEuglenasp (Euglenophyta),
suggesting some degree of permanent impact on the environment (Branco 2002).
The river runoff is strongly controlled by rainfall (Fig. 2), with an average discharge of 15 m3s−1(annual
average) (SECTMA 1999). The tidal regime is semi-diurnal, with a mean amplitude of 1.3 m (neap tides) and 1.8 m (spring tides) (Araujo et al. 1999). The estu-ary is well mixed, being classified as type 1 with an absence of vertical stratification (Araujo et al. 1999, Noriega et al. 2009).
SAMPLING ANDCOMPILATION OFEARLYDATA
Fig. 1 – Map of the Barra das Jangadas Estuary (BJE), NE Brazil.
calculated from 1999 to 2003 for the BJE and Jaboatão and Pirapama rivers (CPRH 2003, Branco 2002, 2006, Noriega et al. 2005a, b, 2009). Coastal concentrations were obtained from BNDO (2004). These data were used to construct an annual nutrient budget using the LOICZ approach, as proposed by Gordon et al. (1996). The construction of balances (annual, wet and dry period) was made through the average of the monthly balance sheets, following the methodology proposed by Webster et al. (2000).
Fig. 2 – Monthly variation (averaged over 5 years, 1999-2003) of river flow discharge, evaporation and precipitation. Average historical rainfall and evaporation (1963-1990) at the BJE, Brazil.
WATER, SALT,ANDFLUXCALCULATIONS FOR DINANDDIP:THELOICZ MODEL
The “Land Ocean Interactions in the Coastal Zone (LOICZ) Core Project” of the IGBP, established in 1993, is dedicated to understand the role of coastal sub-systems in the functioning of the world oceans, includ-ing the role of the coastal zones and in the disturbed and undisturbed cycles of carbon, nitrogen and phospho-rus (Gordon et al. 1996). The advantage of the LOICZ model is that extensive datasets are not required, so it is a suitable model for the Brazilian Northeast, where water quality data for most estuaries are extremely lim-ited. The model is considered robust and uses a widely applicable, uniform methodology to provide informa-tion on the CNP fluxes in estuaries. Within the con-text of LOICZ biogeochemical modeling, the primary question to be addressed concerns the role of the coastal zone as a source or sink for carbon, nitrogen, and phos-phorus (Wepener 2007).
The LOICZ biogeochemical model is based on the mass balance of water and materials (Gordon et al. 1996, Smith et al. 2005). Water and salt are assumed to not undergo significant biogeochemical transforma-tions within the system, while nutrients behave as non-conservative compounds due to biogeochemical pro-cessing within the system. Hence, salt budgets and known water inputs and outputs are used to estimate
water exchange between the system and the adjacent sea. The mass balance of essential non-conservative nutrients, namely dissolved inorganic phosphorus (DIP) and nitrogen (DIN), allows estimates to be made of rates of biological transformations and ecosystem pro-cesses, such as the net ecosystem metabolic (NEM) – i.e., the difference between primary production and community respiration – and the net nitrogen budget, which is assumed to depend on the difference between the nitrogen fixation and denitrification rates.
The water budget can be easily estimated using measurements of runoff (VR), precipitation (VP),
groundwater (VG), sewage or other inputs (VO), and
evaporative outflow (VE). The compensating outflow
or inflow that balances the water volume in the system is called the residual flow (VR). The seawater volume
necessary to maintain the salinity in the system (mixing flow, VX) can be estimated using the conservative salt
budget. The salt budget is calculated using the salin-ity difference between the system and the adjacent sea. DIP and DIN budgets are calculated from water budgets and concentration data. Deviations of budgets/concen-trations (1DIP and1DIN) from predicted values are
assumed to depend on non-conservative processes or internal transformations, and basically represent the net difference between nutrient sources and sinks.
C:N:P ratios of the reacting organic matter, generally that of the dominant primary producers, but other ma-terial (e.g., sewage) may be considered if judged to be significant. This assumes that 1DIP depends only on
biological transformations.
The molar C:N:P ratios can be considered as the link among the cycles of these elements in the produc-tion and respiraproduc-tion processes, and deviaproduc-tions from the expectations based on these ratios can be quantitatively assigned to other processes. The net nitrogen budget is the difference between1DIN and1DIN expected from 1DIP and the C:N:P ratios, and is considered to be the
difference between nitrogen fixation and denitrification (nfix-denit). Care is required in interpreting1DIP
be-cause it is affected by benthic fluxes and sorptive cesses with suspended materials, as well as biotic pro-cesses in the water column. These effects may be es-pecially important in shallow and turbid water bodies. Moreover, the C:N:P stoichiometry and its effects on ecosystem processes vary greatly among primary pro-ducers (Hessen et al. 2004).
Linear regression was used to observe the corre-lation between the model results and variables associ-ated with these calculations. All the analyses were pro-duced with the statistical software STATISTICA 8.0 for Windows.
RESULTS AND DISCUSSION
WATER ANDSALTBALANCES
Water flow, salinity, and nutrient concentrations for the BJE, based on the monthly averages of samples taken from January 1999 to December 2003 (Table I), were successfully fed into the model. The residual water flux (VR, Gordon et al. 1996) from this system, which is
nec-essary to balance the freshwater outflow, was approxi-mately 2 times greater in the rainy season than in the dry season. VR occurs as a result of river runoff,
precip-itation influx and evaporation outflow. The amount of freshwater flowing (VQ) into the estuary was estimated
at 638×103and 1366×103m3, respectively (Fig. 3).
Rainfall in the study area was seasonal. About 75% of rainfall occurred during the rainy season. The rain vol-ume over the whole estuary area (13 km2) was found
to be 41 and 125×103 m3 d−1, respectively, with an
annual value of 83×103m3d−1. Evaporation from the
water surface was calculated to be 1.4 times greater in the dry season than in the rainy season (Fig. 3).
The residence time of water was estimated by di-viding the estuary volume by the sum of the mixing ex-change flux (VX) and the residual flux (VR). Therefore,
the time of total water exchange in the BJE ranged be-tween 7-21 days. As expected, higher residence times were observed during the dry season (>13 days), while
during the rainy months they did not exceed 9 days (Table II).
DIPANDDIN BUDGET
The calculated four major components of the ma-terial balance (VRDIPR, VX(DIPOC-DIPSYS), VGDIPG,
VQDIPQ), in the estuary indicated that BJE acts as
a source for DIP (import-export = 1220 mol d−1)
(Fig. 4). Throughout the year, phosphorus (P) budgets in the BJE change sign according to the season. During the dry season, the balances are negative during four months (Table II). This implies that the BJE sequesters the difference between import and export, and acts as a sink for P during these months. This period of the year shows the smallest potential of exportation and higher residence times. The mixing outflow of DIP from this system is substantially larger than the residual inflow, and demonstrates that there must be DIP production (1DIP) of approximately+57 mol d−1in the system.
We assume that this represents decomposition of or-ganic matter. We have observed that there is very high release of DIP, especially from the sediments associated with sugar cane wastes, so this and other organic dis-charges into the system are assumed to support the high non-conservative flux of DIP.
This period (September-March) is when the sugar-cane harvest and milling occur. During the rainy season, the sign is positive. This implies that the BJE acts as a source for P, mainly in July, which is a characteristically high rainfall month (Table II).
Seasonal variations of river runoff (VQDIPQ) DIP
were found to be 2396 and 5782 moles d−1during the
dry and rainy seasons, respectively. SECTMA (1999) indicated a residual organic pollution load during the sugar-cane harvest of 5000 and 2000 kg of BOD d−1
−
− −
−
− −
Fig. 3 – Annual and seasonal water (103m−3d−1) and salt flux (103psu) budgets, and residence time (τ =Volestuary/(VX|VR|), in days) at the BJE. (+) indicates
source, and (−) indicates sink.
which represents 57.8 and 37.8 kg of DIP d−1, according
to the coefficients of San Diego-McGlone et al. (2000). The total estimated for this study was 95.6 kg of DIP d−1, while our estimates were 74.2 kg of DIP d−1 for
the period of the sugar-cane harvest (dry season). According to CPRH (2003), the Jaboatão River showed concentrations of total phosphorus 1.3 times higher than the Pirapama River during the dry season (0.71 / 0.56 mg L−1) from 1999 to 2003, and 1.5 times
higher during the rainy season. The Jabotão River had a P total 1.3 times higher than the Pirapama River in the dry season, and 1.5 times higher in the rainy season (5 years monitoring) (CPRH 2003).
The daily DIP load from the watershed was 4089 moles d−1(annual average) (Table II). This represents a
riverine load in the BJE of 1492 moles of DIP per km−2
per yr−1 (or 46 kg of DIP per km−2per yr−1) ((Load
DIPQ/Watershed area)×365).
During the dry season, the flux per unit area of catchment was 874 moles of DIP per km−2 per yr−1,
and during rainy season it was estimated at 2110 moles of DIP per km−2per yr−1. According to Smith et al.
(2003), the average concentrations of 6 mmoles m−3
correspond to a high population density (1000 people per km−2) and high runoff (V
Q) per unit area (1 m yr−1)
in excess of 6300 moles per km−2per yr−1. These
au-thors used a regression model to describe DIN and DIP exportation by analyzing 165 systems for which DIN and DIP flux data were available (http://data.ecology. su.se/MNODE/). In the present study, the June load reached 3154 moles per km−2per yr−1, a value 0.5 times
lower than that estimated by Smith et al. (2003). The region presents a per capita load for the hydrographic basin of 1.4 moles of DIP per person per yr−1 ((Load
DIPQ/Population Watershed) × 365) or 0.04 kg per
person per yr−1 of DIP (annual average), a value that
reflects the high population density and low runoff, ac-cording to Smith et al. (2003). The population density of the Jaboatão and Pirapama basins is about 1100 peo-ple per km−2, with a total population of∼1 100 000 hab.
Bidone and Lacerda (2002) estimated a daily riverine load for estuarine or riverine areas in Northeast Brazil around 0.002 kg of P hab−1d−1. This value was
−
−
(τ
)
−
1
−
−
1
Fig. 4 – Annual and seasonal phosphorus flux (in moles d−1) budget at the BJE. (+) indicates source, and (−) indicates sink.
typical water consumption for developing countries. This is actually overestimated compared to the real wa-ter consumption of 100-150 L hab−1d−1in the Brazilian
northeastern coastal area (I.M. Abreu et al., unpublished data). These figures would yield 0.01 kg of DIP per person per yr−1, considering the San Diego-McGlone et
al. (2000) transformations from P to DIP, which is 4-fold smaller than our previously calculated value. During the dry season, this value was nearer to that estimated by Bidone and Lacerda (2002) (0.02 kg of DIP per person per yr−1). Therefore, during the rainy season, it was 6
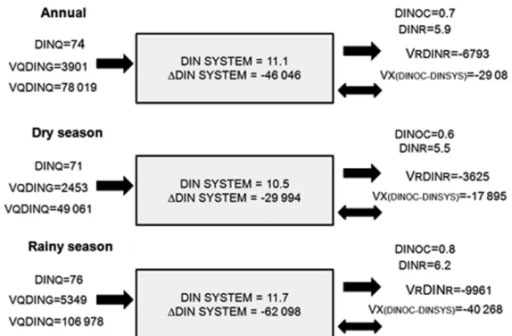
times higher. Our estimates identify a high organic load as a result of unplanned activities in the hydrographic basin, such as disposal of domestic sewage, uncontrolled land runoff, and industrial and agro-industrial effluents. The calculated four major components of the mate-rial balance (VRDINR, VX(DINOC-DINSYS), VGDING,
VQDINQ), in the estuary indicated that BJE acts as a
sink for DIN (import-export = –46 046 mol d−1) (Fig. 5).
The nitrogen budget in the BJE shows a higher in-flow contribution during the rainy season, due to fresh-water runoff and reduced residual fresh-water flow (Fig. 5).
1DIN is negative in all months, suggesting that inputs
are higher than outputs and indicating a net sink of in-organic nitrogen in the BJE. Seasonal variations of river runoff DIN (VQDINQ) were found to be 46 061 and
106 978 moles d−1 during the dry and rainy seasons,
respectively. According to SECTMA (1999), the daily loads of BOD during the sugar-cane harvest (dry sea-son) for the Jaboatão and Pirapama rivers are 5000 and 2000 kg of BOD d−1, respectively, which represents 950
and 380 kg of DIN d−1, according to the coefficients of
San Diego-McGlone et al. (2000). The total daily load estimated for this study was 1092 kg of DIN d−1, while
our estimates were 687 kg of DIN d−1for the period of
the sugar-cane harvest (dry season).
According to CPRH (2003), the Jaboatão River shows concentrations of ammonium 4 times higher than the Pirapama River (3.37/0.82 (dry season); 3.0/ 0.70 mg L−1(rainy season)). The daily DIN load from
the watershed was 78 019 moles d−1 (annual average)
(Table II), which would represent a yield of 28 477 moles of DIN per km−2per yr−1 (400 kg of DIN per
km−2per yr−1), a value two times greater than the mean
estimate (Smith et al. 2003).
During the dry season, the flux per unit area of the catchment was 17 907 moles of DIN per km−2per
yr−1, while during the rainy season it was estimated as
39 047 moles of DIN per km−2per yr−1.
The computed per capita load was 26 moles of DIN per person per yr−1 (0.4 kg of DIN per person
per yr−1), a value 9 times greater than the scenario with
Camacho (2000)). In either cases, if the DIP uptake primarily represents net organic metabolism, rather than sorption or precipitation of inorganic P, this sys-tem is net heterotrophic. During the dry season (Sepsys-tem- (Septem-ber-February), we observed a slightly heterotrophy of –0.5 mmoles C m−2 d−1(seasonal average). The long
residence time retains materials long enough to react internally during the dry season. In addition, the wa-ter quality is enhanced by a slightly deeper euphotic depth (Noriega et al. 2005, Branco 2002), which also favors the phytoplankton community. In the rainy sea-son, the biggest nutrient contribution to the rivers occurs (–19 mmoles C m−2d−1; seasonal average).
Mukhopa-dhyay et al. (2006) suggest that tropical estuaries with a shallow photic zone dominated by physical processes could cause the phytoplankton to not reach their maxi-mum growth rates, which could contribute to the phyto-planktonic production of the estuary being limited. The objective is to modify the riverine flux of nutrients be-fore it is released to the coastal water. These values demonstrate that outputs are higher than inputs at the BJE, with highlights on the mineralization of organic matter and a net source of CO2to the atmosphere.
The seasonal differences between heterotrophy (January to August) and autotrophy (September to December) indicate an extension of this second condi-tion (Fig. 6).
Gordon et al. (1996) pointed out that p (primary
production) andr (respiration) are within about 10%
of one another. Assuming that p is known, this
im-plies that the quantity (p-r)= ±0.1p. The lack of
di-(annual mean) represents∼10% of the primary
produc-tion, which is considered appropriate. In this way, res-piration would represent –138 mmoles C m−2d−1, and p/r = 0.92, which means that the system uses 8%
more organic matter than it produces. During the dry season, the value of (p-r) is –0.5 mmoles C m−2d−1,
considering that phytoplanktonic primary production is 155 mmoles C m−2d−1, p/r =0.99. It follows that
r is approximately 155.5 mmoles C m−2 d−1. That
is, the system produces about 0.1 more organic matter than it uses. On the other hand, during the rainy season, (p-r)=–19 mmoles C m−2d−1and primary
produc-tion is 101 mmoles C m−2d−1, and so the value ofr is ∼120 mmoles C m−2d−1, with p/r =0.84. The
sys-tem consumes about 16% more organic matter than it produces in this second case.
A simple linear regression was used to relate p -r values to the residence time (TR) (P<0.05) (Fig. 7).
Longer residence times indicate that the system remains closer to 0, with a small trend towards autotrophy. On the other hand, shorter residence times show oscillations between heterotrophy and autotrophy (Fig. 7).
Fig. 5 – Annual and seasonal nitrogen flux (in moles d−1) budget at the BJE. (+) indicates source, and (−) indicates sink.
Fig. 6 – Monthly variation of the Ecosystem Net Metabolism (NEM) at the BJE. Negative and positive values indicate heterotrophy and autotrophy, respectively.
The nitrogen fixation and denitrification are impor-tant processes in coastal systems. Again, because the major source of reacting matter is unclear, two N/P ra-tios are used. The decomposing material has a mean C/P of 106/1, and N/P of 16/1, which is near the value of N/P of 11/1 quoted for mangrove litter (Gordon et al. 1996). Based on this ratio of N/P, we estimated that
1DINobs-1DINesp1DIP* 11 = –5 mmoles m−2d−1
(annual average). Smith and Camacho (2000) esti-mated that the differences between N fixation and deni-trification are in general close to zero (with a domi-nance of denitrification), and that values above 5 moles m−2yr−1are rare. Our results in general suggest
deni-trification (Fig. 8).
Fig. 7 – Budget monthly (p-r) as a function of the system exchange time (days).
Fig. 8 – Monthly variation of N fixation and denitrification rates in the BJE. Negative and positive values indicate denitrification and fixation of nitrogen, respectively.
Swaney and Smith (2003), although they suggested that some coral reef, mangrove and tropical seagrass com-munities may exhibit rates>20 times this upper limit.
As a general rule, few systems have nitrogen fixation faster than this rate. The value reported for the BJE in February was low, submitting to this limit, and indicating
that the adjacent mangrove forest did not accelerate this fixation in the estuary.
The apparently high denitrification during the rainy season (–7 mmoles m−2d−1) indicates high benthic
are around 0.5-2 mmoles N m−2 d−1. Systems with
high benthic respiration may have denitrification rates
>10 mmoles m−2d−1(Swaney and Smith 2003).
Dur-ing the dry season, denitrification is lower (–2 mmoles m−2d−1) than in the rainy period. Other tropical
estu-aries, such as the Piauí River Estuary (Brazil), presented a denitrification rate of –0.13 mmoles m−2 d−1, while
the Sergipe River Estuary (Brazil) seems to fix nitrogen at 0.1 mmoles m−2d−1(Souza 2000).
CONCLUSIONS
We used a bulk modeling approach to evaluate the nu-trient budgets (C, N and P) and the trophic state of a tropical estuarine system (BJE). Results show that vari-ations in the annual cycle of the net ecosystem meta-bolism from 1999-2003 depend on seasonal forces, such as basin-scale runoff and DIP loads. Results obtained through mass balance indicate large amounts of anthro-pogenic nutrient inputs to the system. These loads act as a source for dissolved inorganic phosphorus during the dry and rainy season. The loads of dissolved inorganic nitrogen act as sinks throughout the year. During the winter, the BJE basin exceeded the values reported for DIP and DIN (moles km−2 yr−1) in the literature for
basins of up to 1000 km2. These seasonal oscillations of heterotrophy and autotrophy show a moderate ten-dency to heterotrophy, indicating that the system passes to liquid production stages of organic matter when pro-duction surpasses mineralization (September-December) and liquid mineralization stages (March-August).
The linear regression between p-r and the
resid-ence time shows lower entropy in the dry season and autotrophy at lower rates than during the high residence times but, this needs to be confirmed in future studies.
Also evident is the importance of denitrification in the BJE, which establishes that the system is a net deni-trificator at moderate rates, probably in association with the degradation of labile organic matter originated from sewage.
Consequently, both heterotrophy and denitrification are enhanced by the production of carbon and nitrogen during the rainy season, whereas heterotrophic systems mainly depend on the inputs or loads of organic carbon of the adjacent systems.
We considered that high-density human occupation
in the basin contributes significantly to N and P emis-sions throughout the year. High per capita loads of N and P indicate a scenario of high population density and high runoff. However, it seems important to recog-nize that ignoring the uptake and release of nutrients (N and P) by abundant mineral particles in the estuary may cause errors in nutrient balances, although the evidence reported here helps us to understand the main processes driving the metabolism of poorly studied typical small low-latitude estuaries.
ACKNOWLEDGMENTS
We thank the Pernambuco State Water Resources Agency (SRH) (Secretaria de Recursos Hídricos) and Pernambuco State Environmental Agency (CPRH) (Agência Estadual de Meio Ambiente e Recursos Hí-dricos) for their cooperation regarding the field data used in this work. The authors would like to thank the Brazilian National Council of Scientific and Technolo-gical Development – CNPq (Conselho Nacional de Desenvolvimento Científico e Tecnológico) under the scope of the Project BIO-NE (grant 558143/2009-1). We are also grateful to Dr. Monica Costa for her manu-script review and insightful comments.
RESUMO
in the Jaboatão estuary, NE-Brazil. Braz J Oceanogr 47: 145–154.
BERGERWH (ED). 1989. Global maps of ocean productiv-ity. In: SCHLESINGER WH (Ed), Biogeochemistry an analysis of global change, New York: Academic Press, New York, USA, p. 301–307.
BIDONEED. 2000. Análise econômica-ambiental aplicada à contaminação de águas fluviais de pequenas bacias cos-teiras do Estado do Rio de Janeiro. In: ESTEVESFA ANDLACERDALD (Eds), Ecologia de restingas e lagoas costeiras, Rio de Janeiro, Ed. UFRJ, Rio de Janeiro, Brasil, p. 371–394.
BIDONEEDANDLACERDALD. 2002. A preliminary ap-proach of the link between socio-economic and natural indicators into a driver-pressure-impact-response frame-work case study: Guanabara Bay Basin, Rio de Janeiro, Brazil. In: LACERDALDET AL. (Eds), South American Basins: LOICZ global change assessment and synthesis of river catchment – coastal sea interaction and human dimensions, Texel, LOICZ Reports and Studies No. 21, Texel, The Netherlands, 212 p.
BISWAS H, MUKHOPADHYAY SK, DE TK, SEN S AND JANATK. 2004. Biogenic controls on the air-water car-bon dioxide exchange in the Sundarban mangrove envi-ronment, northeast coast of Bay of Bengal, India. Limnol Oceanogr 49(1): 95–101.
BNDO – BANCO NACIONAL DEDADOS OCEANOGRÁFI -COS. 2004. Serviço de banco de dados oceanográficos. <http://www.mar.mil.br/dhn/chm/bndo/>.
BRANCOES. 2002. Variação Sazonal e Espacial da Biomas-sa Fitoplanctônica Relacionada com Parâmetros Hidro-lógicos no Estuário de Barra das Jangadas (Jaboatão dos Guararapes – Pernambuco – Brasil). Trop Ocean 30: 79–96.
phosphorus budgets for a shallow subtropical coastal embayment (Moreton Bay, Australia). Limnol Oceanogr 47: 1043–1055.
GATTUSO JP, FRANKIGNOULLE M AND WOLLAST R. 1998. Carbon and carbonate metabolism in coastal aquatic ecosystems. Annual Review of Ecol and Syst 29: 405–434.
GORDON JRDC, BOUDREAU PR, MANNKH, ONGJ-E, SILVERTWL, SMITH SV, WATTAYAKORNG, WULFF FANDYANAGIT. 1996. LOICZ Biogeochemical Mod-elling Guidelines. LOICZ Reports and Studies No. 5, 96 p.
HESSENDO, AGRENGI, ADERSONTR, ELSERJJAND DE RUITERPC. 2004. Carbon sequestration in ecosystems: the role of stoichiometry. Ecology 85: 1179–1192. HOLLAND HD. 1978. The chemistry of the atmosphere and
oceans. New York, Willey, 351 p.
IBGE – INSTITUTO BRASILEIRO DE GEOGRAFIA E ES -TATÍSTICA. 2000. Censo demográfico.
<http://www.ibge.gov.br/cidadessat/default.php>. INMET – INSTITUTO NACIONAL DE METEOROLOGIA.
2003. Relatório mensal de dados meteorológicos 1999-2003. <http://www.inmet.gov.br>.
IRIGOIEN XANDCASTEL JC. 1997. Light limitation and distribution of Chlorophyll pigments in the highly turbid estuary: the Gironde (SW France). Estuar Coast Shelf Sci 44: 507–517.
KNOPPERS BA, FIGUEIREDO AG AND EKAU W. 1999. The coast and shelf of east and northeast Brazil and material transport. Geo-Mar Lett 19: 171–178.
(Eds), Biologia Marinha. 2aed., Rio de Janeiro: Inter-ciência, p. 529–553.
LALR, KIMBLEJMANDSTEWARTBA. 2000. Global cli-mate change and tropical ecosystems, Boca Raton: CRC Press, 438 p.
MARONE E, MACHADOE, LOPES RAND DA SILVA ET. 2005. Land-Ocean fluxes in the Paranaguá Bay estuarine system, southern Brazil. Braz J Oceanogr 53(3/4): 169– 181.
MEYERS T, SICKLES J, DENNIS R, RUSSELLRK, GAL -LOWAY J ANDCHURCH T. 2001. Atmospheric nitro-gen deposition to coastal estuaries and their watersheds. In: VALIGURA RA, ALEXANDER RB, CASTRO MS, MEYERS TP, PAERL HW, STACEY PE AND TURNER RE (Eds), Nitrogen loading in coastal water bodies: An at-mospheric perspective, Washington: American Geophys-ical Union, p. 401–410.
MUKHOPADHYAYSK, BISWASH, DETKANDJANATK. 2006. Fluxes of nutrients from tropical River Hooghly at the land-ocean boundary of Sundarbans NE Coast of Bay of Bengal, India. J Marine Syst 62: 9–21.
NORIEGACED, MUNIZK, ARAUJOMC, TRAVASSOSRK ANDNEUMANN-LEITÃOS. 2005a. Fluxos de nutrientes inorgânicos dissolvidos em um estuário tropical – Barra das Jangadas – PE, Brasil. Trop Ocean 33: 129–139. NORIEGACED, MUNIZK, FEITOSAFA, FLORES-MONTES
MJ, GREGO CK, SCHEIDT GAND SILVA HP. 2005b. Distribuição espacial da biomassa fitoplanctônica e sua relação com os sais nutrientes em um estuário tropical (Barra das Jangadas – PE – Brasil). Arq Cien Mar 38: 5–21.
NORIEGACED, MUNIZK, FLORES-MONTESMJ, MACÊ -DOS, ARAUJOM, FEITOSAFAANDLACERDAS. 2009. Series temporales de variables hidrobiológicas en un es-tuario tropical (Brasil). Rev Biol Mar Oceanog 44(1): 93–108.
PASSAVANTEJZANDFEITOSAFA. 2004. Dinâmica da pro-dutividade fitoplanctônica na zona costeira marinha. In: ESKINAZI-LEÇAE, NEUMANN-LEITAOSANDCOSTA MF (Eds), Oceanografia: Um cenário tropical, Recife: Edições Bagaço, Recife, Brasil, p. 425–440.
RAMPAS, NAIRS ANDCHANDRAMOHAND. 2003. Sea-sonal shift in net ecosystem production in a tropical estu-ary. Limnol Oceanogr 48: 1601–1607.
SANDIEGO-MCGLONEML, SMITHSVANDNICOLASVF. 2000. Stoichiometric interpretations of C:N:P ratios in organic waste materials. Mar Pollut Bull 40: 325–330.
SCHINDLER DW. 1978. Factors regulating phytoplankton production and standing crop in worlds freshwaters. Lim-nol Oceanogr 23: 478–486.
SCHLESINGER WH. 1997. Biogeochemistry: An analysis of global change. 2nd ed. San Diego: Academic Press. 430 p.
SECTMA – SECRETARIA DE CIÊNCIA, TECNOLOGIA E MEIOAMBIENTE. 1999. Plano estadual de recursos hí-dricos, PERHPE.<http://www.inmet.gov.pe.br>. SMITHSVANDCAMACHOV. 2000. Flujos de CNP en la
zona costera.<http://nest.su.se/mnode/Methods/ powerpoint/LOICZoverview_sp.ppt>.
SMITHSVANDHOLLIBAUGHJT. 1997. Annual cycle and interannual variability of net and gross ecosystem meta-bolism in a temperate climate embayment. Ecol Monogr 67: 509–533.
SMITHSV, SWANEYDP, BUDDEMEIERRW, SCARSBROOK MR, EATHERHEADMA, HUMBORG C, ERIKSSONH ANDHANNERZF. 2005. River nutrient loads and catch-ment size. Biogeochemistry 75: 83–107.
SMITH SVET AL. 2003. Humans, hydrology, and the dis-tribution of inorganic nutrient loading to the ocean. Bio-Science 53: 235–245.
SOUZAMFL. 2000. Rio Sergipe and Piauí River Estuaries. In: SMITHSV, DUPRAV, MARSHALLCROSSLANDJI AND CROSSLAND CJ (Eds), Estuarine systems of the South American region: carbon, nitrogen and phospho-rus fluxes, Texel, LOICZ Reports and Studies 15, Texel, The Netherlands, p. 6–17.
SWANEY DPAND SMITH SV. 2003. Guidelines for con-structing nutrient budgets of coastal systems. In: CROSS -LANDCJ, KREMERHH, LINDEBOOMHJ, MARSHALL -CROSSLAND JI AND LETISSIER MDA (Eds) Coastal fluxes in the anthropocene, Berlin, Springer, Berlin, Deut-shland, p. 110–111.
TAPPINAD. 2002. An examination of the fluxes of nitrogen and phosphorus in temperate and tropical estuaries: Cur-rent estimates and uncertainties. Estuar Coast Shelf Sci 55: 885–901.
WEBSTERIT, PARSLOWJSANDSMITHSV. 2000. Implica-tions of spatial and temporal for biogeochemical budgets of estuaries. Estuaries 23: 341–350.