Annals of the University of Petroşani, Economics, 11(4), 2011, 263-270 263
FINANCIAL RISK MANAGEMENT,
BASED ON THE BALANCE SHEET AND PROFIT AND
LOSS ACCOUNT
ILIE RĂSCOLEAN, CLAUDIA ISAC, ROBERT SZABO
*ABSTRACT: Existing market economy in Romania currently is characterized by a series of reforms carried out in order to create a competitive economy within the EU but also globally. These reforms and dynamic environment where there is a range of factors that can create specific conditions of different types of event risk. Most important is the risk of insolvency. Analysis of these risks can be done through various methods such as: analysis of scores method, using the Connan – Holder model.
KEY WORDS:risk; cost analysis; break-even; solvency; insolvency; liquidity rates
JEL CLASSIFICATION: G32
1. INTRODUCTION
The economic risk is the possibility of occurrence of adverse events that may generate losses. A decident can accept the probability of loss in terms of expected income to obtain additional gains wich will compensate for the risk taken. The literature distinguishes between risk and uncertainty. Risk is defined as a situation where not known with certainty the characteristics of an event, but is known alternatives such characteristics and possibilities of their occurrence. Approximate uncertainty implies knowledge of the characteristics pertaining to a particular event, but not the probability of them. Between bankruptcy risk and direct link exists in the sense that, as a draft action entails a higher risk of bankruptcy more likely, and reverse. Diagnosis bankruptcy risk is assessing the ability of the company to honor commitments to third parties.
*
Assoc.Prof., Ph.D., University of Petroşani, Romania, [email protected] Assoc.Prof., Ph.D., University of Petroşani, Romania, [email protected]
264 Răscolean, I.; Isac, C.; Szabo, R.
Our country's legislation defines insolvency as "the state of the debtor's assets are characterized by insufficient cash funds available to clear debt, liquid and payable: Insolvency is presumed to be manifest when the debtor, after 30 days due, is not paid the debt to one or more creditors, insolvency is imminent also when it is shown that the debtor can not pay the outstanding debt incurred maturity with available cash funds on the due date."
Thus, the creditor entitled to participate in the insolvency is that creditors who filed and who has been admitted wholly or in part, an application to register its claim against the debtor claims tables. Creditor is entitled:
- to participate and vote in the creditors, including a reorganization plan accepted by the syndic judge;
- to be appointed as a member of the committee of creditors;
- to participate in distributions of funds from the debtor's reorganization or liquidation of the debtor;
- to be informed or notified of the procedure and to participate in any other proceedings subject to this law.
The quality of the creditor entitled to participate in insolvency proceedings without personal statements of claim filed, the debtor's employees.
Method based on statistical techniques by which to analyze the financial characteristics discriminatory, or by using the method score rates. This method is one of the tests along with others such as breakeven analysis, analysis of direct expenses or other tests performed with different rates, such as analysis of liquidity risk through rates. Discriminated analysis has been used since the 1930s the first applications in biology and natural sciences. Later, after 1945, has been successfully applied in economic fields such as consumer credit assessment, classification of investments, and since 1960, and financial analysis.
The study is Walter (1959), who proposed a model to estimate the rate per share, the study Smith (1965) which presented an interesting model of calsificare investments in standard categories using multiple discriminant analysis. Dignostic score is a method that is external risk measurement and interpretation that is subject to the investor, creditor company, but now the system in future work. He relies on the development of value judgments that combines linear group of financial rates vary significantly. All studies able to predict the bankruptcy of the firms are based on the original contribution of Beaver and Altman.
Beaver (1966) made the greatest contribution to the bankruptcy of the enterprise, Univariate analysis. Univariate analysis technique involves using a single financial rates a bankruptcy prediction model. Beaver looked at several separate financial rates and rate selected for each critical point so as to maximize prediction accuracy. Altman (1968) conducted a multivariate analysis of falimetului developing a analizaă multiple discrimination, based on combined financial information rates in a single position of the author and his model of analysis popularized bankruptcy model score or Z-score.
Financial Risk Management, Based on the Balance Sheet and Profit ... 265
period of time, two groups of companies, based on a set of indicators considered to be significant, progressive selection of indicators made the best discrimination, determining a ranking called indicator score (Z) form:
Z = a1x R1 + a2 x R2 + a3x R3 + ... + anx Rn
where:
ai weighting of each installment;
Ri is selected rates to the highest discriminating power.
The score is a linear function of several variables (rates) are characterized by average coefficients determined from observations made in a given period on a sample of firms, according to the values we can estimate the probability that the risk of bankruptcy for each firm.
Most classifications retain four categories of financial rates:
- rates of operational activity and principlalele assessing income streams generated by the business, liquidity levels, which measures the adequacy of available sources to short-term obligations due on the same period;
- rates on term debt and balance long, which characterizes the company capital structure in order to emphasize the ability to meet long term obligations and investment needs;
- rates of return, which measures the capacity of the income necessary to achieve both development and capital remuneration.
The selected rates are independent in relation to each score to eliminate duplication function of the same influence of the financial and economic phenomenon. Among the most popular models, based on scores metod we can, remember: Altman, Springate, Koh, Conan-Holder, Center of the Central Bank of France balance sheets. The most representative models developed in Romania, are model Băiliştenu and model Anghel.
E.I. Altman has developed one of the first feature score in 1968, using information obtained from studying a sample of U.S. companies. In this sample included both firms went bankrupt, and companies with good business. In his study included a sample of 66 companies including many 33 in each group and the period considered for analysis was from 1946 to 1965.
The author found a total of 22 potential variables grouped into five categories, the author selected five installments wich he has considered to have the highest significance, with reference to: liquidity, profitability, leverage, solvency and activity. Springate model was developed in 1978 by Canadian Professor Gordon Springate, following the author's procedure Altman from 19 financial rates, the most commonly used in the literature.
266 Răscolean, I.; Isac, C.; Szabo, R.
Z = 0.22 x 0.24 x R1 + R2 + R3 x 0.16 - 0.87 x R4 - 0.10 x R5
where:
R1 = gross operating surplus / total debt R2 = Equity / Total liabilities
R3 = Current Assets - Inventory / total assets R4 = Financial expenses / turnover
R5 = personnel costs / value added.
Based on this model were set following margins score function:
- if Z> 0.16, the company has a very good situation, and bankruptcy risk is <10%;
- if 0.1 <Z <0.16, the company has a good situation and the risk of failure is between 10% and 30%;
- if 0.04 <Z <0.1, the company has a state of alert, and bankruptcy risk is between 30% and 65%;
- if - 0.05 <Z <0.04, the company has a situation of danger and risk of failure is between 65% and 90%;
- if Z <-0.05, the company has a state of failure and bankruptcy risk is > 90%.
Model B - Băileşteanu. From traditional studies (Altman, Argenti, Taffler, Conan and Holder) states that the author believes that the causes of bankruptcy are: the impossibility of paying current obligations, lack of financial resources for repayment of loans, collection of great products delivered late; record loss. Anghel model was developed based on the observation of a number of 20 economic-financial indicators, the sample was composed of 276 companies in 12 sectors of national econo.
2. PROBLEM FORMULATION
The question which arises is, how a company is able to face risk factors that appear on the market the way the company is able to cope with risks, but not least, and how it manages to adapt to market conditions .
The economic and financial analysis system, fitness business analysis to be solvent and defeat the risk of bankruptcy is central. Any failure on payment obligations generate damage and require urgent correction. However, financial stability is an absolute imperative, that can not be missed under any motivation. Undertaking capacity assessment to adjust obligations is assessed within shaded according to specific economic and financial conditions in which he operates. Even if sustainability is not compromised company image may degrade due to periodic disturbances. The permanence of difficulties to pay the obligation is an expression of economic and financial structural fragility.
3. SOLUTIONS / CASE STUDY
Financial Risk Management, Based on the Balance Sheet and Profit ... 267
which the case study was conducted, was established in 2000 as state owned enterprise under the name S.C. ABC S.A. and is active in the production and trading of carbon, the execution of repairs. To achieve financial analysis s.c. ABC s.a., to make available summary documents - balance sheet in 2 consecutive years , 2008 and 2009, profit and loss for three consecutive years and for balance - , 2008, 2009.
Risk score calculation method is based on the linear function Z and to calculate the five installments ratios:
R1 = gross surplus of exploitation/ total liabilities = 22 871045 / 56445748 = 0, 40; R2 - ratio of permanent capital and total assets = 43769387 / 129161219 = 0,33; R3 - ratio of current assets less inventories and total assets = 25271225 / 129161219 = 0,19;
R4 - the ratio of financial costs and turnover = 2822735 / 105019718 = 0,02; R5 - ratio of personnel costs and value added = 13610436 / 36776238 = 0,37. Follows function:
Z = 0,24 * 0,40 +0.22 * 0,33 +0.16 * 0,19-0,87 * 0,02-0,10 * 0,37 = 0.14
This value signifies a risk of 0.14 obtained between 10 and 30%, as obtained from the value in calculations so this time Z is between 0.1 and 0.16. Same method was established risk score for 2009. Thus from this calculation was obtained for Z a value of 0.12 which means that the risk remains in the range of 10-30%, but we can speculate on the basis that the value obtained is less than the previous year which means that the company is on a good path to recovery.
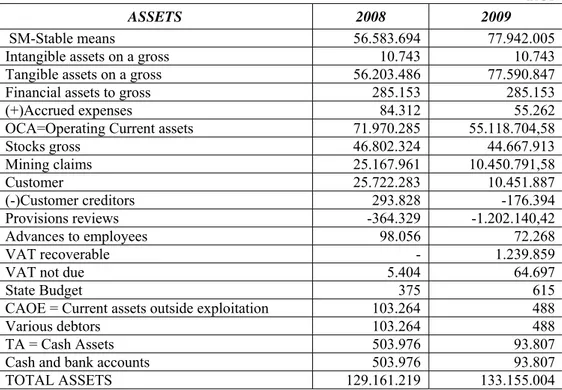
Table nr.1. The balance sheet
- RON -
ASSETS 2008 2009
SM-Stable means 56.583.694 77.942.005 Intangible assets on a gross 10.743 10.743 Tangible assets on a gross 56.203.486 77.590.847 Financial assets to gross 285.153 285.153
(+)Accrued expenses 84.312 55.262
OCA=Operating Current assets 71.970.285 55.118.704,58
Stocks gross 46.802.324 44.667.913
Mining claims 25.167.961 10.450.791,58
Customer 25.722.283 10.451.887
(-)Customer creditors 293.828 -176.394 Provisions reviews -364.329 -1.202.140,42
Advances to employees 98.056 72.268
VAT recoverable - 1.239.859
VAT not due 5.404 64.697
State Budget 375 615
CAOE = Current assets outside exploitation 103.264 488
Various debtors 103.264 488
TA = Cash Assets 503.976 93.807
Cash and bank accounts 503.976 93.807
268 Răscolean, I.; Isac, C.; Szabo, R.
LIABILITIES 2008 2009
SR = Sustainable Reserves 72.255.476 88.157.186 Equity / Own founds 43.769.387 71.011.949
(+) Income in advance 756.786 588.838
(+) Depreciation and provisions 27.729.303 16.556.399 DS = debt service 36.549.287 22.025.089
Suppliers 34.237.310 19.907.064
(-) Care Providers -9.999 -904
(+) debts to person. and social assurance 723.802 1.565.804 (+) Other debts and pub instit. 1.598.174 553.125 LOE = Liabilities outside exploitation 20.356.456 22972730
Settlements associations 1.878.000 -
(+) Diverse creditors 17.911.061 22.432.151
(+) Payable dividends 31.981 31.981
(+) Income Taxes 535.414 508.598
TOTAL LIABILITIES 129.161.219 133.155.004,58
One of the most important concepts that characterizes an entreprise is solvency. Solvency is the company's ability to honor maturing obligations resulting either from previous commitments entered into, either current operations or compulsory levies.
Solvency ratios used in financial analysis of risk are:
- General liquidity ratio:
GLR = Current assets / liabilities from exploitation
This ratio compares current assets associated with all potential liquidity, with total outstanding debt in one year. For normal work, general liquidity ratio must be over unit;
- Partial liquidity rate:
PLR = (Current Assets - Stocks) / debt service.
This rate expresses the company's ability to meet short-term debt on debt and cash. For a good work adequacy of this rate should be 0.8;
- The rate of immediate liquidity
ILR = cash money / debt service
Financial Risk Management, Based on the Balance Sheet and Profit ... 269
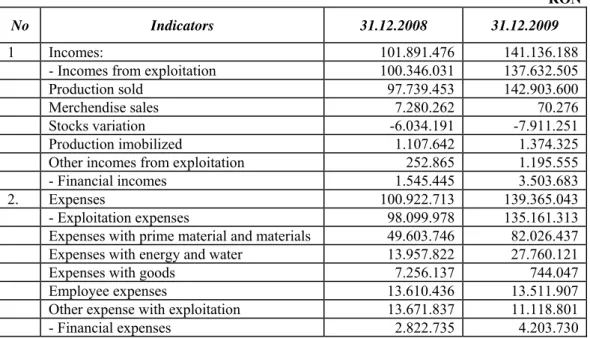
Table 2. The profit and loss acount
RON
No Indicators 31.12.2008 31.12.2009
1 Incomes: 101.891.476 141.136.188
- Incomes from exploitation 100.346.031 137.632.505
Production sold 97.739.453 142.903.600
Merchendise sales 7.280.262 70.276
Stocks variation -6.034.191 -7.911.251
Production imobilized 1.107.642 1.374.325 Other incomes from exploitation 252.865 1.195.555 - Financial incomes 1.545.445 3.503.683
2. Expenses 100.922.713 139.365.043
- Exploitation expenses 98.099.978 135.161.313 Expenses with prime material and materials 49.603.746 82.026.437 Expenses with energy and water 13.957.822 27.760.121 Expenses with goods 7.256.137 744.047
Employee expenses 13.610.436 13.511.907
Other expense with exploitation 13.671.837 11.118.801 - Financial expenses 2.822.735 4.203.730
Table 3. Table with Liquidity rates calculated
Indicators Values for 2008 Values for 2009
GLR 1,4497 1,4171
PLR 0,5740 0,3719
ILR 0,0094 0,0022
4. CONCLUSIONS
General liquidity rate (GLR) was not favorable liquidity in a range between 2 and 2.5, indicating that the company encountered difficulties in debt repayment due in the short term through short-term assets. It may be noted, however, a slight increase of RLG in 2009 than in 2008 due to lower short-term debt of the company.
Low liquidity rate (LLR) was not at the recommended level of 0.8 which indicates that the company has experienced difficulties in paying payments due in the short term, but on account of assets readily convertible into cash. Small amounts of debt and cash assets are the main causes. Rates of immediate liquidity (ILR) is well below the optimal value of 0.2 representing a high risk undertaking with regard to cover immediate liabilities.
270 Răscolean, I.; Isac, C.; Szabo, R.
the calculation of liquidity or borrowing rate. The company is solvent - which shows company's ability to pay its monetary obligations as it is placed in a low risk, operations risk acceptable, in fact most companies are in this category.
REFERENCES:
[1]. Brezeanu, P. (2008) Financial management, Romanian-British University publishing house, Bucharest
[2]. Monea, M. (2009) Financial Ratios – Reveal How a Business is Doing?, Annals of the University of Petroşani, Economics, Vol IX, Part II, Universitas Publishing House, Petroşani, ISSN 1582-5949, pp.137-144
[3]. Răscolean, I. (2004) Financial management of the enterprise, Focus publishing house, Petroşani
[4]. Vasile, I. (1997) Financial management of the enterprise, Didactical and pedagogical publishing house, Bucharest, 1997