www.hydrol-earth-syst-sci.net/13/793/2009/ © Author(s) 2009. This work is distributed under the Creative Commons Attribution 3.0 License.
Earth System
Sciences
Inclusion of potential vorticity uncertainties into a
hydrometeorological forecasting chain: application to
a medium size basin of Mediterranean Spain
A. Amengual, R. Romero, M. Vich, and S. Alonso
Grup de Meteorologia, Departament de F´ısica, Universitat de les Illes Balears, Palma de Mallorca, Spain Received: 5 December 2008 – Published in Hydrol. Earth Syst. Sci. Discuss.: 28 January 2009
Revised: 26 May 2009 – Accepted: 26 May 2009 – Published: 17 June 2009
Abstract. The improvement of the short- and mid-range numerical runoff forecasts over the flood-prone Spanish Mediterranean area is a challenging issue. This work analy-ses four intense precipitation events which produced floods of different magnitude over the Llobregat river basin, a medium size catchment located in Catalonia, north-eastern Spain. One of them was a devasting flash flood – known as the “Montserrat” event – which produced 5 fatalities and ma-terial losses estimated at about 65 million euros. The char-acterization of the Llobregat basin’s hydrological response to these floods is first assessed by using rain-gauge data and the Hydrologic Engineering Center’s Hydrological Model-ing System (HEC-HMS) runoff model. In second place, the non-hydrostatic fifth-generation Pennsylvania State Univer-sity/NCAR mesoscale model (MM5) is nested within the ECMWF large-scale forecast fields in a set of 54 h period simulations to provide quantitative precipitation forecasts (QPFs) for each hydrometeorological episode. The hydro-logical model is forced with these QPFs to evaluate the re-liability of the resulting discharge forecasts, while an en-semble prediction system (EPS) based on perturbed atmo-spheric initial and boundary conditions has been designed to test the value of a probabilistic strategy versus the pre-vious deterministic approach. Specifically, a Potential Vor-ticity (PV) Inversion technique has been used to perturb the MM5 model initial and boundary states (i.e. ECMWF fore-cast fields). For that purpose, a PV error climatology has been previously derived in order to introduce realistic PV perturbations in the EPS. Results show the benefits of using a probabilistic approach in those cases where the determin-istic QPF presents significant deficiencies over the Llobregat river basin in terms of the rainfall amounts, timing and
lo-Correspondence to:A. Amengual
calization. These deficiences in precipitation fields have a major impact on flood forecasts. Our ensemble strategy has been found useful to reduce the biases at different hydromet-ric sections along the watershed. Therefore, in an operational context, the devised methodology could be useful to expand the lead times associated with the prediction of similar future floods, helping to alleviate their possible hazardous conse-quences.
1 Introduction
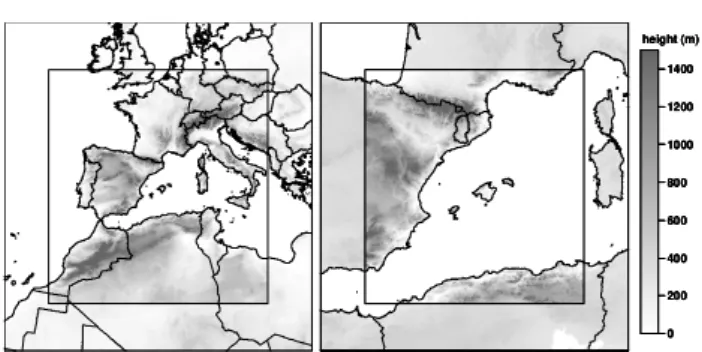
Fig. 1. Geographical locations and main mountain systems of the Western Mediterranean region. Major topographic features are shown according to the colour scale at 500 m intervals starting at 500 m. The thick continuous line shows Catalonia and its internal basins (highlighted with shaded grey).
The short-time scales of flash flood events imply that the traditional warning systems based on hydrological models driven by rainfall observations do not provide the timely predictions required to implement the precautionary civil protection measures (Siccardi, 1996). Hence, to further extend the lead times associated to discharge predictions, the forecasting procedures are increasingly dependent upon high-resolution numerical weather prediction (NWP) models (with lead times up to 12–48 h; e.g. Ranzi et al., 2000; An-derson et al., 2002; Ferraris et al., 2002; Ducrocq et al., 2003; Benoit et al., 2003; Diomede et al., 2006). One of the most important challenges for NWP models nowadays is to im-prove the quantitative precipitation forecasts (QPFs) for hy-drological purposes. For example, Younis et al. (2008) have shown that high-resolution operational weather forecasting in combination with a rainfall-runoff model could be useful to determine flash floods more than 24 h in advance.
The Llobregat river basin is a medium size catchment lo-cated in Catalonia, north-eastern Spain (Figs. 1 and 2), and it is periodically affected by intense precipitation events re-sulting in floods which sometimes produce hazardous ef-fects. As a first objective of this work, we are interested in testing the feasibility of HEC-HMS discharge predictions driven by MM5 mesoscale model forecasts over the Llobre-gat river basin within a real-time hydrometeorological chain forecasting framework. Four notable hydrometeorological episodes occurred over the 1996–2004 period have been selected and the MM5 numerical weather model has been nested within large-scale meteorological forecasts provided by the European Center for Medium Range Weather Fore-casts (ECMWF). One of the selected cases –known as the “Montserrat” flash flood event, on 9–10 June 2000 – is a good
## # # # ## # ## # # # # # # # # # # # # # # ## # # ##### # # # # # # # # # # # # ## # # # # ### # # # # # # ## # # # # # # # # # # # # # # # # # # # # # # # # # # # # # # # # # # # # # # # # # # # # # # # # # ## # # ## # # # # ## # #
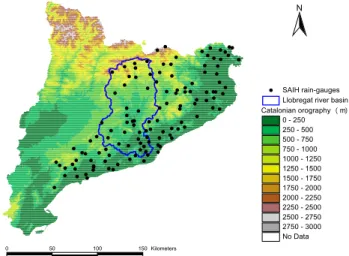
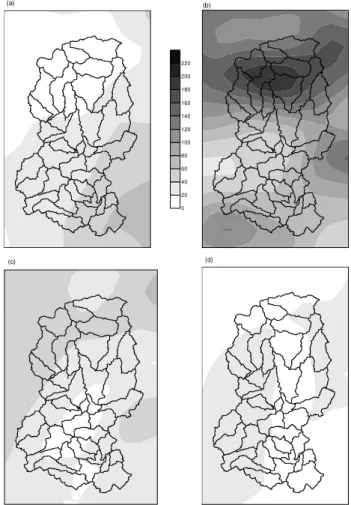
Catalonian orography (m) 0 - 250 250 - 500 500 - 750 750 - 1000 1000 - 1250 1250 - 1500 1500 - 1750 1750 - 2000 2000 - 2250 2250 - 2500 2500 - 2750 2750 - 3000 No Data Llobregat river basin # SAIH rain-gauges
0 50 100 150 Kilometers
N
Fig. 2.Distribution of the rain-gauges from the Automatic
Hydro-logical Information System (SAIH) in the internal basins of Cat-alonia (IBC; shown in Fig. 1). It includes a total of 126 automatic rainfall stations distributed over an area of 16 000 km2. Llobregat basin is highlighted.
example of the catastrophic effects related to such episodes. Many internal basins of Catalonia (IBC, Fig. 1) were over-whelmed as a result of the heavy precipitation produced by a quasi-stationary mesoscale convective system. The subse-quent flood produced serious human and material damages over the Llobregat river basin (Llasat et al., 2003). In a pre-vious work, Amengual et al. (2007) studied the “Montser-rat” episode by using HEC-HMS runoff simulations driven by high-resolution precipitation fields provided by the MM5 mesoscale model, which was nested within NCEP analyses. This procedure was found useful to simulate the flash flood 24 h in advance with appropriate space and temporal scales.
ensemble of mesoscale model forecasts has become a valu-able tool to further span the space of possible results. This is motivated by the fact that forecasts are sensitive to the uncertainties found in the initial and boundary conditions, model formulations, or both. Forecasting ensemble strategies can provide better short-range prediction guidance as long as they take into account these aspects. Several methods are be-ing used to create perturbed initial conditions, such as breed-ing of growbreed-ing modes (Toth and Kalnay, 1993), sbreed-ingular vec-tors (Buizza and Palmer, 1995; Molteni et al., 2006) and Monte Carlo approaches (Mullen and Baumhefner, 1988; Houtekamer and Derome, 1995: Du et al., 1997). The use of multi-physics ensemble strategies in order to take into ac-count the model imperfections are widely described, for ex-ample, in Stensrud et al. (2000) and Jones et al. (2007).
Nowadays, many efforts are being devoted to explore the potential of using Ensemble Prediction Systems (EPS) for flood forecasting in order to extend the warning lead times for large river basins and to develop suitable probabilistic hydrological predictions techniques (de Roo et al., 2003; Gouweleeuw et al., 2005; Schaake et al., 2006, 2007). As an example, the European Flood Alert System (EFAS) is a trans-national European effort to provide deterministic and proba-bilistic flood forecasting information to several regional hy-drological services (Thielen et al., 2009; Bartholmes et al., 2009). Recent studies have shown that flood forecasting sys-tems based on ensembles of quantitative precipitation fore-casts or high-resolution rainfall simulations can also be of great value for medium and small size river basins (Roulin, 2007; Amengual et al., 2008; Diomede et al., 2008).
The second objective of this work is to study the impact on the hydrometeorological modelling chain of the uncertainties found in the initial and boundary conditions of the mesoscale model forecasts. For this purpose, an EPS has been generated by means of spatial shifts and variations of intensity of the upper-level precursor synoptic scale trough – a PV anomaly – for each case under study. Essentially, we try to encompass the uncertainties associated with an imprecise representation of the upper-level precursor troughs on the synoptic scale. With this method, it is possible to assess the effects on the driven runoff forecasts of the spatial and temporal uncertain-ties found in the QPFs. A previous PV error climatology has been derived in order to introduce realistic (i.e. with an ap-propriate range) PV perturbations in the EPS. Furthermore, the short-range prediction guidance value of a probabilistic hydrometeorological chain framework against a determinis-tic one in the Llobregat river basin can be assessed with this ensemble method.
The rest of the paper is structured as follows: Sect. 2 con-sists of a brief description of the study area and the rain and flow gauge networks; Sect. 3 describes the hydrometeoro-logical episodes; Sect. 4 presents the hydrohydrometeoro-logical tools used for the basin characterization and to set-up the runoff sim-ulations; Sect. 5 contains the meteorological tools applied to forecast the intense rainfall events and to design the
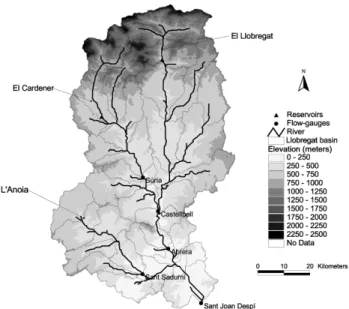
en-Fig. 3.Digital terrain model of the Llobregat river basin with a cell
size of 50 m. It displays the basin segmentation, main tributaries, stream-gauges (circles) and reservoirs (triangles).
semble prediction system; Sect. 6 presents and discusses the results; and Sect. 7 provides an assessment of the presented methodology which includes future directions for the later development of the system.
2 The study area
2.1 Overview of the Llobregat river basin
Among the internal hydrographic catchments of Catalonia, the Llobregat river basin is the most important regarding to its size, river length, mean flow and population living inside (Figs. 2 and 3). This catchment is formed by the Llobregat river and its main tributaries, the Anoia and the Cardener. Llobregat basin extends from the Pyrenees – with heights over 3000 m, through the pre-Pyrenees – with a height tran-sition from 750 m to 200 m in the pre-coastal range. The last section of the river flows through the Mediterranean oro-graphic systems which consist of two mountainous aligments almost parallel to the coast line: the pre-coastal and coastal ranges. The basin has a total drainage area of 5040 km2and a maximum length close to 170 km (for a more detailed de-scription of the watershed see Amengual et al., 2007).
occurring mainly in autumn and occasionally in the other seasons. These intense daily precipitation events can rep-resent a large fraction of the annual amounts.
2.2 The rain and stream gauge networks
Validation of QPFs is not always straightforward, in par-ticular for exceptional events. If rain-gauge networks are not dense enough, these are not able to resolve the small-scale features of the highly variable precipitation fields driv-ing floods. Furthermore, a point comparison among the ob-served and simulated rainfall fields is not always appropriate for hydrological purposes that emphasize an integrated value over the watershed surface (Chancibault et al., 2006). In this study, the spatial and temporal distributions of the forecasted rainfall fields are evaluated against the observed rainfall pat-terns at the subcatchment scale by using a set of continuous and categorical verification indices using the sub-basins as rainfall accumulation units.
Available raw precipitation consists of 5-min rainfall data recorded at 126 stations inside the Internal Basins of Catalo-nia (IBC) and distributed over an area of 16 000 km2(Fig. 2). These stations belong to the Automatic Hydrological Infor-mation System (SAIH) network of the Catalan Agency of Water (ACA). Out of the 126 stations, about 40–50 lie inside the Llobregat basin or near its boundaries.
The flow forecasts resulting from the one-way coupling between the meteorological and hydrological models will be compared against the rain-gauge driven runoff simulations, thus employing the hydrological model as an advanced val-idation tool. This approach has been found especially suit-able for the evaluation of high-resolution simulated precipi-tation fields (Benoit et al., 2000; Jasper and Kaufmann, 2003; Chancibault et al., 2006; Amengual et al., 2008).
Runoff in the Llobregat river basin is available at five flow gauges (Fig. 3) also integrated in the SAIH network, located in: (i) S´uria town, on the Cardener river, with a dranaige area of 940 km2and elevation from 250 m at gauge level to 2350 m in the Pyrenees; (ii) Sant Sadurn´ı d’Anoia city, on the Anoia river, with a drainage area of 736 km2 and ele-vations from 125 m at gauge level to 850 m at headwater; and (iii) Castellbell (3340 km2), (iv) Abrera (3587 km2) and (v) Sant Joan Desp´ı (4915 km2) towns along the Llobregat river. Unfortunatelly, only a partial amount of the stream-flow data is available for this study owing to the malfunction of some gauges for some of the analysed hydrometeorologi-cal episodes.
3 Description of the hydrometeorological episodes We have selected four intense precipitation episodes which resulted in floods of remarkable magnitude from 1996, when the SAIH network was deployed, until 2004. These case studies are a sample of different intense rainfall episodes
pro-duced by prototype atmospheric dynamical situations. The first two cases were linked with sustained and stratiform-like rainfalls over long periods of time, which resulted in remark-able discharges at the Llobregat basin outlet. The last two cases produced important and sudden rising flows owing to their convective nature, bearing heavy precipitations in short temporal scales. Next, the causative atmospheric patterns as well as the characteristics of the rainfall distributions and subsequent floods are briefly summarized.
3.1 Case 1: 16–17 November 1996
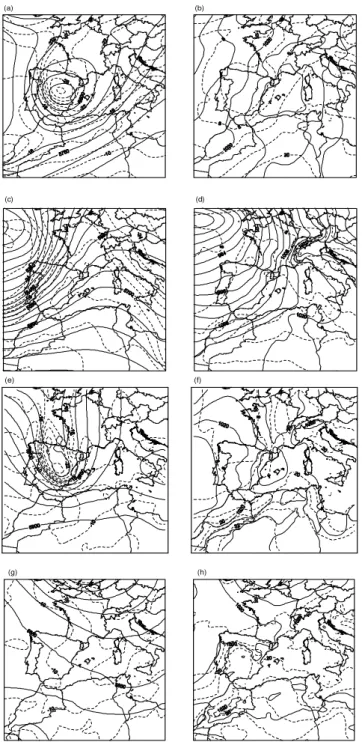
This episode involved the intrusion of an Atlantic surface cold front and a positively tilted upper-level trough that con-tributed to the generation of a mesoscale cyclone over the western Mediterranean Sea. The cyclone was located off the Catalonian coast and advected warm and moist air toward Catalonia (Fig. 4a and b). The whole episode led to maxi-mum precipitation values above 100 mm inside the Llobregat catchment from 14 November 00:00 UTC to 18 November 00:00 UTC, though the most of the amounts were concen-trated on the last two days, with maxima close to 80 mm in-side the basin. This was an example of sustained stratiform-like precipitation rates over a 48 h period distributed between the pre-coastal and the Pyrenees ranges (Fig. 5a).
The maximum flow discharge recorded at S´uria was close to 133 m3s−1 at 19:40 UTC on 17 November 1996. In
the Anoia affluent, only a moderate flow increase was ob-served with a maximum of about 67 m3s−1 at 10:45 UTC.
In Castellbell town, a remarkable peak discharge up to 972 m3s−1 at 23:10 UTC was produced owing to the
im-portant rainfall amounts registered in the north-western and central areas of the basin (figures not shown). In Abrera, data was not available and, in Sant Joan Desp´ı, a maximum peak discharge of 1250 m3s−1was recorded on 18
Novem-ber 1996 at 03:15 UTC (Fig. 6a). 3.2 Case 2: 17–18 December 1997
This event was characterized by a deep depression centered to the north-west of Spain and a general south-westerly flux at all levels (Fig. 4c). In Catalonia, there was warm and moist advection from the south-southeast that favoured important precipitations on the south-faced ranges of the Pyrenees ow-ing to the important orographic forcow-ing (Fig. 4d). Precipita-tion amounts reached 232 mm from 15 to 19 December 1997 00:00 UTC, albeit maximum quantities were observed during the last 48 h period. From 17 to 19 December 00:00 UTC, the Llobregat river basin collected a maximum amount up to 202 mm and a 24 h accumulation above 120 mm. Maximum rainfall affected the northern part of the watershed (Fig. 5b). Again, this flood event was linked to sustained stratiform-like precipitation.
(a) (b)
(c) (d)
(e) (f)
(g) (h)
Fig. 4. ECMWF forecast maps. Geopotential height
(continu-ous line, in gpm) and temperature (dashed line, in◦C) at 500 hPa
for: (a)17 November 1996 at 00:00 UTC,(c)18 December 1997
at 00:00 UTC, (e)10 June 2000 at 00:00 UTC and (g) 30
Au-gust 2004 at 00:00 UTC. Sea level pressure (continuous line, in hPa) and temperature at 925 hPa (dashed line, in◦C) for:(b)17
Novem-ber 1996 at 00:00 UTC,(d)18 December 1997 at 00:00 UTC,(f) 10 June 2000 at 00:00 UTC and(h)30 August 2004 at 00:00 UTC. The Llobregat river basin is highlighted in shaded grey.
0 20 40 60 80 100 120 140 160 180 200 220
(a) (b)
(c) (d)
Fig. 5. Observed accumulated precipitation in the Llobregat basin
(in mm according to the scale) for: (a)16–17 November 1996, (b)17–18 December 1997,(c)9–10 June 2000 and(d)29–30 Au-gust 2004 episodes.
shown). At Castellbell stream-gauge, the peak discharge was 503 m3s−1 at 20:00 UTC (Fig. 6b). At Anoia, Abrera and
Sant Joan Desp´ı flow-gauges, no data were available on this case.
3.3 Case 3: 9–10 June 2000
Sant Joan Despí (4915 km2) 0 200 400 600 800 1000 1200 1400 16/11/1996 00:00 16/11/1996 12:00 17/11/1996 00:00 17/11/1996 12:00 18/11/1996 00:00 18/11/1996 12:00 19/11/1996 00:00 19/11/1996 12:00 date Q( m 3/s) Q_observed Q_SAIH Q_MM5-ECMWF (a)
Sant Joan Despí (4915 km2)
0 200 400 600 800 1000 1200 1400 16/11/1996 00:00 16/11/1996 12:00 17/11/1996 00:00 17/11/1996 12:00 18/11/1996 00:00 18/11/1996 12:00 19/11/1996 00:00 19/11/1996 12:00 date Q( m 3/s) Q_observed Q_SAIH Q_MM5-ECMWF (a)
Castellbell (3340 km2
) 0 100 200 300 400 500 600 700 17/12/97 12:00 18/12/97 00:00 18/12/97 12:00 19/12/97 00:00 19/12/97 12:00 20/12/97 00:00 20/12/97 12:00 date Q( m 3/s ) Q_observed Q_SAIH Q_MM5-ECMW F (b)
Castellbell (3340 km2
) 0 100 200 300 400 500 600 700 17/12/97 12:00 18/12/97 00:00 18/12/97 12:00 19/12/97 00:00 19/12/97 12:00 20/12/97 00:00 20/12/97 12:00 date Q( m 3/s ) Q_observed Q_SAIH Q_MM5-ECMW F (b)
Sant Joan Despí (4915 km2)
0 200 400 600 800 1000 1200 1400 1600 9/6/00 12 :00 10/6/00 0:00 10/6/0 0 12:00 11/6/00 0:00 11/6 /00 12:00 1 2/6/00 0:00 12 /6/00 12:00 date Q ( m 3/s ) Q_observed Q_SAIH Q_MM5-E CMWF (c)
Sant Joan Despí (4915 km2)
0 200 400 600 800 1000 1200 1400 1600 9/6/00 12 :00 10/6/00 0:00 10/6/0 0 12:00 11/6/00 0:00 11/6 /00 12:00 1 2/6/00 0:00 12 /6/00 12:00 date Q ( m 3/s ) Q_observed Q_SAIH Q_MM5-E CMWF (c)
Castel lbell (3340 km2
) 0 50 100 150 200 250 300 350 30/08/2004 12:00 30/08/2004 18:00 31/08/2004 00:00 31/08/2004 06:00 31/08/2004 12:00 31/08/2004 18:00 date Q ( m 3/s ) Q observed Q_SAIH Q_M M 5-EC MW F
(d)
Castel lbell (3340 km2
) 0 50 100 150 200 250 300 350 30/08/2004 12:00 30/08/2004 18:00 31/08/2004 00:00 31/08/2004 06:00 31/08/2004 12:00 31/08/2004 18:00 date Q ( m 3/s ) Q observed Q_SAIH Q_M M 5-EC MW F
(d)
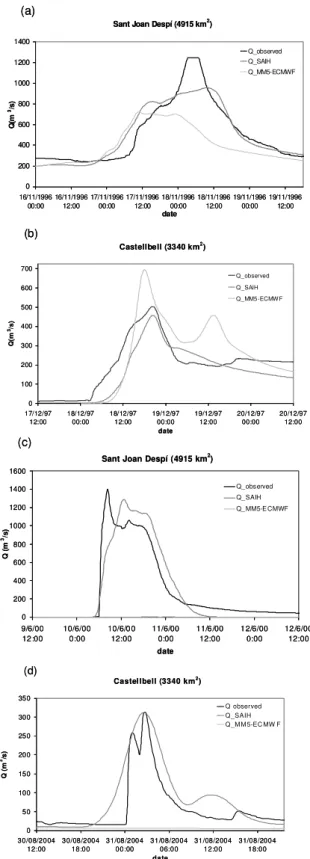
Fig. 6.Observed, SAIH rain-gauge driven, and MM5 control
sim-ulation driven runoff discharge for: (a) 16–17 November 1996 episode, (b) 17–18 December 1997 episode, (c) 9–10 June 2000 episode and(d)29–30 August 2004 episode. The hydrographs are shown at the stream-gauges indicated in Table 1.
notable disasters consisted of the partial destruction of the in-frastructure of a monastery in Montserrat’s mountain (720 m) where about 500 people had to be evacuated. The episode caused five fatalities and material losses estimated at about 65 million euros (Llasat et al., 2003).
The most remarkable hydrometeorological feature of this case – known as the “Montserrat” flash flood event – was the high intensity of the convective rainfall: the accumulated hourly quantities were above 100 mm with a 6 h maximum up to 224 mm, mainly affecting the pre-coastal ranges (Fig. 5c). The maximum discharge observed at S´uria was 260 m3s−1at
10:25 UTC on 10 June 2000. In the Anoia affluent, the peak discharge was 270 m3s−1at 04:45 UTC. In Castellbell town,
several peak discharges were observed and the maximum of these reached 1000 m3s−1at 06:00 UTC. In Abrera, the peak
discharge was close to 1200 m3s−1at 10:50 UTC (figures not
shown). Finally, in Sant Joan Desp´ı city, the maximum peak flow was up to 1400 m3s−1at 08:15 UTC (Fig. 6c).
3.4 Case 4: 29–30 August 2004
Figure 4g and h depicts a synoptic situation not clearly de-fined and with a weak dynamical forcing. Relatively cold air was present at mid-upper tropospheric levels over Catalonia. At low levels, a relative thermal low located in the south-western part of Iberian Peninsula and its associated meso-low over the Ebro valley resulted in an easterly flow over Catalo-nia. Then, the warm and humid Mediterranean air together with the cold air aloft was enough to trigger a very localized and intense convective storm. This synoptic situation is typ-ical of the warm season stormy conditions in Mediterranean Spain. This episode was characterized by accumulated rafalls over 180 mm upon the Llobregat basin. Again, high in-tensities of mostly convective precipitation were found, with hourly amounts close to 51 mm and 6 h maximum quanti-ties up to 115 mm from 14:00 to 20:00 UTC on 30 August (Fig. 5d).
With regard to the observed runoff, the maximum peak flow was close to 150 m3s−1 on 30 August 2004 at
23:25 UTC for S´uria. In Castellbell town, the peak flow was 314 m3s−1on 31 August 2004 at 02:40 UTC (Fig. 6d).
Ow-ing to the high spatial localization of this episode, no remark-able flow was observed at the Anoia gauge (the peak dis-charge was only about 15 m3s−1). Unfortunately, in Abrera
and Sant Joan Desp´ı, no data were recorded.
4 Hydrological tools
4.1 Rainfall-runoff model and input data
rainfall and control variables for the simulations. Figure 3 depicts the digital terrain model for the Llobregat river basin – with a cell resolution of 50 m – together with the main wa-tercourses and its tributaries, the considered division in sub-basins and the location of the available river gauges. After the sensitivity analysis presented in Amengual et al. (2007), the modelled basin was segmented into 39 sub-basins with an average size of 126 km2and a total extension of 4915 km2 upstream from Sant Joan Desp´ı, where the last flow-gauge is installed.
The hydrological model is forced by using a single hyeto-graph for each sub-basin. Rainfall spatial distributions are first generated from hourly accumulated values recorded at SAIH rain-gauges by applying the kriging interpolation method with a horizontal grid resolution of 1000 m. Then, the hourly rainfall series are calculated for each sub-basin as the area-averaged of the gridded rainfall within each sub-catchment. The same methodology is used to assimilate QPFs in HEC-HMS, except that atmospheric model grid point values are used instead of SAIH observations. The kriging analysis method has been used by applying a linear model for the variogram fit (variogram slope = 1, anisotropy ratio = 1, anisotropy angle = 0, no nugget effect). This mini-mal error variance method is recommended for irregular ob-servational networks and has been commonly used to com-pute rainfall fields from rain-gauges (Krajewski, 1987; Bha-garva and Danard, 1994; Seo, 1998).
4.2 Theoretical background and basin calibration The rainfall-runoff model calculates runoff volumes by sub-tracting from rainfall the water volume that is lost through interception, infiltration, storage, evaporation and transpira-tion. The loss rate is calculated using the Soil Conservation Service Curve Number (SCS-CN, US Department of Agri-culture 1986). This method assumes the storm runoff vol-umes to be proportional to the rainfall volvol-umes exceeding an initial abstraction threshold, through the ratio of the accumu-lated infiltration to a storage capacity. With this assumption and the continuity principle the cumulative volume of storm-flow becomes nonlinearly related to the excess rainfall vol-ume which is a function of cumulative rainfall, soil cover, land use and antecedent moisture (Chow et al., 1988; Bacchi et al., 2002). The SCS-CN model has been tested on sev-eral experimental areas and river basins worldwide and, in Catalonia has been adopted by ACA for their technical stud-ies (ACA, 2001, 2003). A synthetic unit hydrograph (UH) provided by SCS is used to convert rainfall excess into di-rect runoff on a watershed. The SCS-UH relates the peak discharge with the time to the UH peak through the sub-basin area and a conversion constant. Baseflow is calculated by means of an exponential recession method to explain the drainage from natural storage in the watershed (Linsley at al., 1982). The flood hydrograph is routed using the Muskingum method (Chow et al., 1998; USACE-HEC, 2000).
The Llobregat basin contains two reservoirs located in the upstream areas of the Cardener affluent and the Llobregat river (Fig. 3). Therefore, these reservoirs have been mod-eled using the technical characteristics – storage capacity, maximum outflow, maximum elevation and initial level – available from the aforementioned technical reports issued by ACA. The detention ponds have been modelled by intro-ducing a reservoir element that follows the elevation-storage-outflow relationship series which depends on the characteris-tics of the dam, the outlet and the spillway, besides the initial elevation of the water level.
The calibration of the rainfall-runoff model is carried out using six events: the four episodes under study and two addi-tional cases available for the period comprised between 1996 and 2004. Table 1 shows the selected flood events, the hydro-logical model simulation periods and the observed maximum precipitation and flow inside the Llobregat river basin. The malfunction of the flow-gauge network at Abrera and Sant Joan Desp´ı for some of these episodes (Table 1) has limited to some extent the calibration of the lower part of the catch-ment. In addition, the low available number of high magni-tude flood cases is a problem for the calibration process. To mitigate this problem, it has been applied a cross-calibration methodology, i.e. for each of our case studies, the rest of available hydrometeorological episodes are used to calibrate the model. Thus, in effect, four different calibrations of the model are performed, using, in each case, fully independent flood events.
Calibration of the infiltration parameters for each indepen-dent episode combines a manual procedure, where the SCS curve numbers are derived from field measurements and nor-mal antecedent moisture conditions (ACA, 2001), and an automatic procedure. The automatic procedure uses as ob-jective function the peak-weighted root mean square error and applies the univariate-gradient search algorithm method (USACE-HEC, 2000). In addition, the flood wave celerity for the main streams is considered as a calibration index – by means of the K parameter – owing to the nature of these kinds of episodes characterized by high flow velocities. Baseflow recession parameters have also been calibrated.
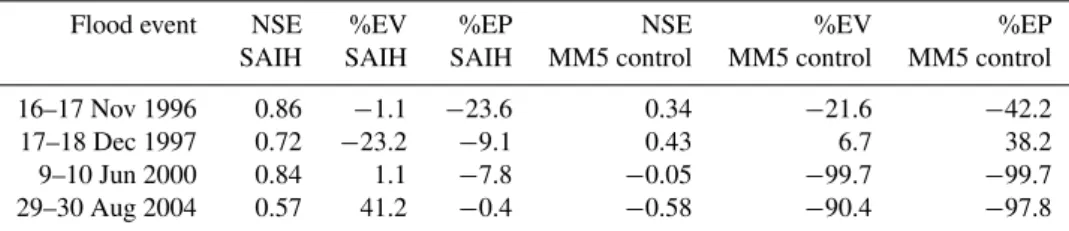
Table 1. Summary of the episodes used for the calibration of the hydrologic model. Note that the observed flow at the basin outlet in Sant Joan Desp´ı is not available for the second, fifth and sixth cases.
Flood event Simulation period Maximum obs. Maximum obs.
rainfall (mm) flow (m3s−1)
16–17 Nov 1996 14/11/1996–20/11/1996 00:00 UTC (144 h) 102.1 1250.0 (Desp´ı)
17–18 Dec 1997 15/12/1997–22/12/1997 00:00 UTC (168 h) 232.0 502.7 (Castellbell)
9–10 Jun 2000 09/06/2000–13/06/2000 00:00 UTC (96 h) 224.0 1400.0 (Desp´ı)
19–20 Oct 2001 17/10/2001–24/10/2001 00:00 UTC (168 h) 84.5 254.4 (Desp´ı)
4–5 Dec 2003 03/12/2003–07/12/2003 00:00 UTC (96 h) 63.6 436.9 (Castellbell)
29–30 Aug 2004 29/08/2004–02/09/2004 00:00 UTC (96 h) 178.3 313.5 (Castellbell)
0 200 400 600 800 1000 1200 1400 height (m)
0 200 400 600 800 1000 1200 1400 height (m)
0 200 400 600 800 1000 1200 1400 height (m)
Fig. 7. Configuration of the two computational domains used for
the MM5 numerical simulations (inner squares, with horizontal res-olutions of 22.5 and 7.5 km for left and right, respectively). The Llobregat river basin is highlighted as thick line.
5 Meteorological tools
The non-hydrostatic MM5 numerical model is used to per-form the meteorological simulations. It is a high resolution short-range weather forecast model developed by the Penn-sylvania State University (PSU) and the National Center for Atmospheric Research (NCAR) (Dudhia, 1993; Grell et al., 1995). The model domains are configured as in the real-time operational version used at the University of the Balearic Is-lands (UIB; see http://mm5forecasts.uib.es). Simulations are designed using 30 verticalσ-levels and two spatial domains with 121×121 grid points (Fig. 7). Their respective horizon-tal resolutions are 22.5 and 7.5 km. In particular, the sec-ond domain spans the entire Catalonian territory and con-tiguous land and oceanic areas, and is used to supply the high-resolution rainfall fields to drive the hydrologic simu-lations. The interaction between the domains follows a two way nesting strategy (Zhang et al., 1986).
To initialize the model and to provide the time-dependent boundary conditions, the European Center for Medium Range Weather Forecasts (ECMWF) large-scale meteorolog-ical grid forecasts are used, with a spatial resolution of 0.30 and an update frequency of 6 h. The deterministic MM5 ex-periments (also labelled as ’control’ simulations) for the four hydrometeorological episodes follow the same physics
op-tions as in the UIB operational runs. To parameterise moist convective effects, the Kain-Fritsch parametrization scheme (Kain, 2004) is used in both domains. Explicit microphysics are represented in both domains with prediction equations for cloud and rain water fields, cloud ice and snow allowing for slow melting of snow, supercooled water, graupel and ice number concentration (Reisner et al., 1998). The planetary boundary layer physics is formulated using a modified ver-sion of the Hong and Pan scheme (Hong and Pan, 1996). Sur-face temperature over land is calculated using a force-restore slab model (Blackadar, 1979; Zhang and Anthes, 1982) and over sea it remains constant during the simulations. Finally, long- and short-wave radiative processes are formulated tak-ing into account the cloud cover (Benjamin, 1985).
With the purpose of generating the ensemble of perturbed runs, the invertibility principle of Ertel potential vorticity (PV; Hoskins et al., 1985) is applied. In particular, we are interested in studying the sensitivity of the hydrometeorolog-ical events to uncertainties in the precise representation of the upper-level precursor troughs on the synoptic scale for each hydrometeorological episode, being aware that small scale aspects of the circulation are propitious to analysis or fore-cast errors. The piecewise PV inversion scheme described in Davis and Emanuel (1991) is then used as a clean approach to manipulate the upper-level synoptic troughs in the model ini-tial and boundary conditions. What it is necessary is a simple identification of the anomalous PV signatures of the troughs and then the balanced mass and wind fields associated with that PV element can be used to alter the meteorological fields in a physically consistent way (effectively, a change in the structure or position of the troughs). This method has al-ready shown its value for assessing the predictability of ex-treme floods in the western Mediterranean area (e.g. Romero, 2001; Homar et al., 2002; Romero et al., 2006).
c) c)
Fig. 8. Percentile levels at 300 hPa of: (a)south-north
displace-ment PV errors,(b)west-east displacement PV errors and(c)PV intensity errors.
further information at http://medex.inm.uib.es). In particu-lar, 19 cyclonic episodes – which comprise 56 days covered every 6 h by ECMWF grid analyses and forecasts – are used to provide the displacement and intensity error climatologies of the PV fields in the study region at the standard pres-sure levels (i.e. 100, 200, 300, 400, 500, 700, 850, 925 and 1000 hPa).
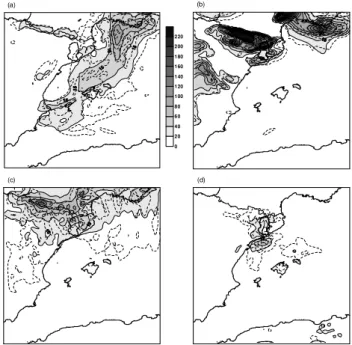
The displacement error (DE) corresponds to the minimum displacement of the ECMWF 24 h forecasts PV field nec-essary to obtain the maximum local correlation with the ECMWF analysis PV field (referred to as “optimal displace-ment”). Displacements of the forecast PV field local ma-trix – which corresponds to a domain of 21×21 grid points or 450×450 km – in all directions up to 10 grid points (i.e. 225 km) are tested. The minimum displacement which shows a local maximum correlation between the displaced forecast and analysis fields is assigned to the matrix cen-tral grid point as the corresponding displacement error. This method is repeated for each domain grid point along with its associated local matrix. Figure 8a and b displays the statis-tics of displacement errors at 300 hPa as percentile levels. These figures only show the results for the south-north (and west-east) directions owing to the symmetry found between the S-N (W-E) and N-S (E-W) displacement errors. It is also worth to note the independency of DE on the PV values. DE percentile levels have been adjusted to a constant function of the PV values.
The intensity error (IE) corresponds to the local difference between the optimally displaced ECMWF 24 h forecast PV field and the ECMWF analysis field. It is computed for each domain grid point as the difference in the 21x21 grid points PV average between the aforementioned optimally displaced forecast and analysis fields and it is expressed as an error percentage relative to the analysis PV average. Figure 8c shows the percentile levels of intensity errors at 300 hPa. It is found a symmetry between positive and negative values (not shown), and therefore, absolute values are used to formulate the intensity error. For each isobaric surface, IE percentile levels have been adjusted to a potential function of the PV values. It has been imposed a superior limit to the intensity error corresponding to IEmax=200%, since the relative error tends to infinity for PV tending to zero.
Finally, the PV error climatology (DE and IE percentiles) is used to implement the EPS by randomly perturbing the PV field in the ECMWF forecasts used to nest the MM5 simula-tions. The perturbations are applied along the areas with the most intense PV values and gradients, usually found within and around the upper-level precursor troughs.
This ensemble of simulations for each hydrometeorolog-ical event is a first approximation to the problem of incor-porating the spatial and temporal uncertainties of the rain-fall forecasts into a medium size catchment as the Llobre-gat basin. The MM5 simulations cover a 54 h period for each of the flood episodes under study, starting at 00:00 UTC 16 November 1996 for Case 1; 00:00 UTC 17 Decem-ber 1997 for Case 2; 00:00 UTC 9 June 2000 for Case 3; and 00:00 UTC 29 August 2004 for Case 4.
6 Results and discussion
6.1 Runoff simulations driven by SAIH rain-gauge data SAIH rain-gauge derived rainfalls of the four hydrometeo-rological events (recall Fig. 5) are used to drive the cali-brated HEC-HMS model for each episode in a single eval-uation runoff simulation according to the methodology de-scribed in Sect. 4. The skill of the resulting runoff simula-tions is expressed in terms of the Nash-Sutcliffe efficiency criterion (NSE; Nash and Sutcliffe, 1970), a “goodness-of-fit” measure widely used in hydrological model validation (Dolcin´e et al., 2001; Jasper et al., 2003). The performance of the runoff simulations is also checked by means of the rel-ative error of total volume at flow-gauge sites, expressed as percentage (%EV). %EV>0 and %EV<0 would indicate an over and underestimation of the volume by the model, re-spectively. In addition, the relative error in percentage of the peak discharge has also been calculated (%EP). Hereafter, the results are only commented at the stream-gauges indi-cated in Table 1 in order to summarize the discussion.
Table 2. NSE efficiency criterion, percentage of error in volume (%EV) and peak flow (%EP) for the calibration episodes at the stream-gauges indicated in Table 1.
Flood event NSE %EV %EP
16–17 Nov 1996 0.87 1.3 −21.7
17–18 Dec 1997 0.84 −21.3 −0.9
9–10 Jun 2000 0.95 −3.4 −12.2
19–20 Oct 2001 0.55 10.3 4.2
4–5 Dec 2003 0.77 −25.1 −3.4
29–30 Aug 2004 0.43 −17.6 −29.4
the observed peak flows, runoff volumes and peak flows for most of the six hydrometeorological events used for the cal-ibration (Table 2). Table 3 shows the statistical skill scores of the single evaluation rain-gauge driven runoff simulations when compared against the observed flows for the study cases (Fig. 6). In particular, NSE widely exceeds 0.8 for the 16–17 November 1996 episode with only a very slight un-derestimation of the runoff volume. However, SAIH driven runoff simulation does not capture satisfactorily the observed peak discharge and its underestimation is remarkable (Ta-ble 3, Fig. 6a). With regard to the 17–18 December 1997 ex-periment, the peak discharge is slightly underestimated and the time to peak is well simulated, but it can also be observed a noticiable error in %EV. Although NSE score is penalized due to this last feature, it still overpasses 0.7 (Table 3 and Fig. 6b). With regard to the “Montserrat” event, rain-gauge driven runoff simulation yields a suitable performance: NSE score is above 0.8 together with small relative errors in the volume runoff and the peak flow. These results point out a goodness-of-fit for the main peak discharge, even though a significant delay occurs in its timing (Fig. 6c). Finally, the 29–30 August 2004 episode depicts the worst statistical in-dices in terms of NSE and %EV among the whole set of se-lected floods. NSE is slightly below 0.6 and a clear overesti-mation in the simulated flow volume can be observed (above 40%). This wide overestimation in the rain-gauge driven runoff volume clearly is against the NSE score, since the maximum peak discharge and its timing are well estimated. However, the evaluation run only simulates an envelop of the two observed peaks (Table 3 and Fig. 6d).
6.2 Runoff simulations driven by MM5 deterministic QPFs
Prior to analysing the runoff simulations, a set of continu-ous verification indices have been used to evaluate the skill of the MM5 deterministic runs over the Llobregat river basin (Fig. 9). The spatial and temporal distributions of the fore-casted rainfall volumes have been compared against the ob-served precipitation volumes by using the correlation coef-ficient (r), root-mean-square error (RMSE) and mean
abso-0 20 40 60 80 100 120 140 160 180 200 220
(a) (b)
(c) (d)
Fig. 9.Spatial distribution of the accumulated precipitation for the
MM5 control forecast simulations in the Llobregat basin (in mm according to the scale) for: (a)16–17 November 1996, (b) 17– 18 December 1997,(c)9–10 June 2000 and(d)29–30 August 2004 episodes.
lute error (MAE) statistical scores. To evaluate the spatial distributions, the 39 sub-basins of the Llobregat catchment are used as areal accumulation units for the precipitation vol-umes. Thus, the statistical scores provide information on the general performance of the mesoscale model to forecast the cumulative rainfall volumes at the sub-basin scale. The tem-poral distributions are computed using hourly rainfall vol-umes over the whole basin. These hourly discretizations were found optimum to model the times of concentration of the basin when it is affected by intense rainfalls (Amengual et al., 2007).
Table 3.NSE efficiency criterion, percentage of error in volume (%EV) and peak flow (%EP) for the SAIH rain-gauge driven and the MM5 control driven runoff simulations. Statistical indices are shown for the flow-gauges indicated in Table 1.
Flood event NSE %EV %EP NSE %EV %EP
SAIH SAIH SAIH MM5 control MM5 control MM5 control
16–17 Nov 1996 0.86 −1.1 −23.6 0.34 −21.6 −42.2
17–18 Dec 1997 0.72 −23.2 −9.1 0.43 6.7 38.2
9–10 Jun 2000 0.84 1.1 −7.8 −0.05 −99.7 −99.7
29–30 Aug 2004 0.57 41.2 −0.4 −0.58 −90.4 −97.8
Table 4.Correlation coeficient, RMSE (in Hm3) and MAE (in Hm3) of the spatial and temporal rainfall volume distributions yielded by the
set of MM5 control simulations.
Flood event r RMSE MAE r RMSE MAE
spatial spatial spatial temporal temporal temporal
16–17 Nov 1996 0.46 3.4 2.5 −0.09 4.4 3.5
17–18 Dec 1997 0.84 7.1 4.5 0.67 8.4 5.6
9–10 Jun 2000 0.28 8.7 6.8 0.11 24.2 15.8
29–30 Aug 2004 0.37 1.9 1.3 −0.17 5.4 3.3
but RMSE and MAE skill scores penalize the wider over-forecasting of the maximum amounts (Table 4). MM5 con-trol forecast for the 16–17 November 1996 episode shows a considerable shift of the predicted maximum amounts south-eastwards of the watershed (Table 4, Fig. 9a): the maxima are located off the Catalonian coast, and the low part of the basin collects up to 80 mm. The timing of the forecasted precip-itation shows remarkable deficiencies as well. The remain-ing deterministic forecasts display a poor skill in reproduc-ing the observed accumulated precipitations and their spatial and temporal distributions over the catchment. MM5 con-trol simulations are clearly deficient and maximum bulks of precipitation are located quite far away from the Llobregat basin (Table 4, Fig. 9c and d). The maximum quantities are located in the north-western part of the Pyrenees range for the 9–10 June 2000 episode, whereas for the 29–30 Au-gust 2004 episode, these fall over the Mediterranean Sea be-tween the Catalonian coastline and the Balearic Islands (fig-ures not shown).
The aforementioned deficiencies are propagated into the MM5 driven runoff forecasts. These runs do not capture in a suitable way the observed peak flows. The severe under-estimation in the QPFs for the June 2000 and August 2004 episodes results in a complete miss of the floods by the runoff simulations (Table 3, Fig. 6c and d). For the 16–17 Novem-ber 1996 episode, it can be appreciated a remarkable under-forecasting of the observed runoff volume and the peak flow (Table 3). The simulated maximum peak discharge is also affected by the biases found in the rain-gauge driven runoff evaluation run, but still it reaches a considerable maximum of 722.8 m3s−1. This fact is mainly due to have driven the
hydrologic model using the previous 48 h observed rainy
pe-riod in order to intend reproducing an operational hydrome-teorological chain framework (Fig. 6b). The 17–18 Decem-ber 1997 MM5 control driven runoff simulation is the most suitable among all the study cases. However, the excessive rainfall accumulations inside the Llobregat river basin result in an overestimation of the peak flow – with a value close to 700 m3s−1, even though the volume presents a small error
(Table 3, Fig. 6b). We have also simulated this event includ-ing the previous 48 h observed precipitation.
It appears that the skill of the hydrometeorological predic-tions is highly dependent on the flood event as well as on the initial and boundary conditions of the databases. For exam-ple, in Amengual et al. (2007), the MM5 mesoscale model was initialized using NCEP analyses – rather than ECMWF forecasts – to study the “Montserrat” flash-flood. It was found that the control simulation reasonably reproduced the spatial and temporal distributions of the observed rainfall, the total precipitated water and the runoff volume over the Llo-bregat river basin.
0 20 40 60 80 100 120 140 160 180 200 220
(a) (b)
(c) (d)
Fig. 10. Ensemble mean (shaded contours, in mm) and ensemble
standard deviation (dashed line, in mm at 7.5 mm intervals) for the accumulated precipitation over the second MM5 computational
do-main for: (a)16–17 November 1996,(b)17–18 December 1997,
(c)9–10 June 2000 and(d)29–30 August 2004 hydrometeorologi-cal episodes. The Llobregat river basin is highlighted as thick line.
large errors in runoff forecasts have been found for the June 2000 and August 2004 episodes which would not allow the triggering of any warning. The difficultities encountered by NWP models to forecast localized convectively-driven rain-fall systems become evident. The arduous reproduction of the precise location and timing of these kinds of events poses great challenges to overcome, even more if affect small and medium size basins. Next, the value of our ensemble fore-casting system to convey the external-scale uncertainties en-countered in the hydrometeorological chain will be analysed. 6.3 Runoff simulations driven by MM5 probabilistic
QPFs ensemble
Following the PV inversion method described in Sect. 5, twenty additional MM5-perturbed mesoscale runs are pro-duced and used to drive new runoff simulations of each hy-drometeorological episode. This population, together with the previous MM5-control experiment, becomes a useful ex-pression of a probabilistic quantitative precipitation forecast in order to investigate the effects on the hydrometeorological chain of the uncertainties present in the atmospheric initial and boundary conditions.
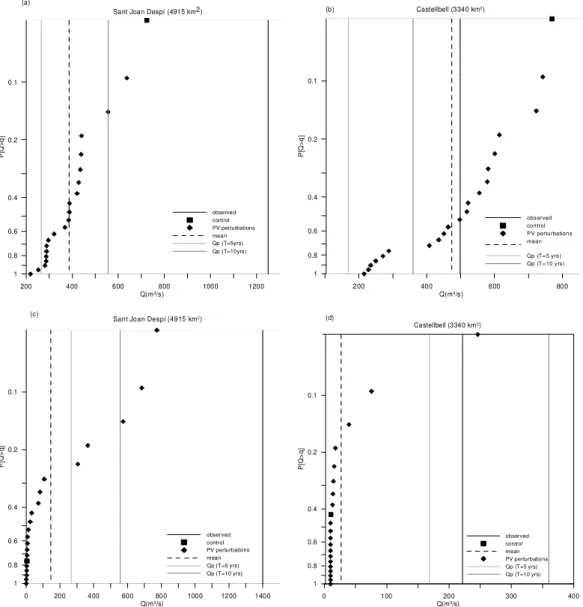
For the discussion of the results, we have considered all the members of the MM5 ensemble to be equally-like and the subsequent driven runoff peak flows are represented as cu-mulative distribution functions (CDFs) plotted in a Gumbel
chart (Ferraris et al., 2002; Taramasso et al., 2005; Fig. 11). Together with the peak flows, we include a vertical black line which represents the observed maximum discharge for each hydrometeorological event at a particular hydromet-ric section. Although no hydrometeorological forecasting chain is currently implemented for civil-protection purposes in the Llobregat river basin, we have considered suitable for the present study the introduction of two hypothetical warn-ing discharge thresholds. Then, the additional vertical light and dark grey lines in Fig. 11 denote the maximum peak discharges for return periods of 5 and 10 years (labelled
as Qp(T=5 yrs) andQp(T=10 yrs), respectively). These peak
flows have been extracted from the aforemented technical re-port issued by ACA (ACA, 2001). The first and second warn-ing discharge thresholds are 168.5 m3s−1and 359.9 m3s−1
at Castellbell flow-gauge, and 266.3 m3s−1and 555.4 m3s−1
at Sant Joan Desp´ı hydrometric section.
A set of categorical verification indices has been used in order to test the quality of the PQPFs at sub-basin scale. Specifically, the probability of detection (POD), the false alarm rate (F), the frequency-bias score (BIAS) and the relative-operating-characteristics (ROC) score are computed for diverse precipitation and runoff volume thresholds (Jol-liffe and Stephenson, 2003; Wilks, 2006). These skill scores are calculated using all the hydrometeorological episodes in order to increase the statistical significance of the results as follows:
– the rainfall and driven runoff volumes of the MM5 con-trol runs are compared against the observed rainfall and SAIH rain-gauge driven runoff volumes, respectively; – the rainfall and driven runoff volumes of the ensemble
means are employed;
– the rainfall and driven runoff volumes by the individual members of the ensembles are used for the comparison with the observed rainfall and rain-gauge driven runoff volumes.
200 400 600 800 1000 1200 Q(m3/s)
0.1
1 0.2
0.4
0.6
0.8
P
[Q
>
q
]
observed control PV perturbations mean Qp (T=5yrs) Qp (T=10yrs) Sant Joan Despí (4915 km2) (a)
200 400 600 800
Q(m3/s) 0.1
1 0.2
0.4
0.6
0.8
P
[Q
>
q
]
obs erved con trol PV perturbation s mean
Qp (T=5 yrs ) Qp (T=10 yrs) Castellbell (3340 km2)
(b)
0 200 400 600 800 1000 1200 1400
Q(m3/s)
0.1
1 0.2
0.4
0.6
0.8
P
[Q
>
q
]
observed control PV perturbations mean Qp (T=5 yrs) Qp (T=10 yrs) Sant Joan Despí (4915 km2)
(c)
0.1
1 0.2
0.4
0.6
0.8
P
[Q
>
q
]
observed control mean PV perturbations Qp (T=5 yrs) Qp (T=10 yrs)
0 100 200 300 400
Q(m3/s) Castellbell (3340 km2) (d)
Fig. 11.Peak discharge exceedance probability plotted on a Gumbel chart for: (a)16–17 November 1996,(b)17–18 December 1997,(c)
9–10 June 2000 and(d)29–30 August 2004 hydrometeorological episodes. The cumulative distribution functions of peak discharge are shown at the stream-gauges indicated in Table 1. The vertical black line indicates the observed maximum peak flow, the vertical dashed black line indicates the maximum peak discharge from the ensemble mean. Light and dark grey vertical lines show the maximum peak flows corresponding to return periods of 5 and 10 years, respectively.
6.3.1 The 16–17 November 1996 episode
Figure 10a depicts the ensemble mean and standard devia-tion of the accumulated forecasted rainfall over the MM5 in-ner domain. The rainfall pattern is clearly distributed over a maritime strip along the Spanish Mediterranean coastline and the maximum quantities are found over the Gulf of Lyons and southern France. Relatively small amounts are collected upon the Llobregat river basin. Figure 11a depicts that the best member of the ensemble is the control experiment, even though the simulated peak discharge presents an important underforecasting. Then, none of the members of the ensem-ble is aensem-ble to reproduce the observed peak discharge at the
basin outlet. It appears that the introduction of realistic PV perturbations does not achieve to alter substantially the rain-fall control pattern when the biases are so important and the maximum rainfall amounts are located so far away from the Llobregat river basin.
The peak discharge exceedance probabilities for
Qp(T=5 yrs) and Qp(T=10 yrs) are close to 0.9 and 0.15,
respectively. Albeit the first level of the theoretical warning is widely exceeded, this fact can be attributed to a couple of reasons: first, the antecedent baseflow is rather close to
Qp(T=5 yrs) for the driven runoff simulations; and second,
skill of this event and the few benefits obtained from the hydrometeorological model ensemble strategy. It is worth to note that the Spanish Agency of Meteorology (AEMET) issues a warning when the probability of occurrence of an extreme event exceeds 0.2. Following this criterion, no second level warning would have been released by a hypothetical real-time forecasting hydrometeorological chain.
6.3.2 The 17–18 December 1997 episode
With regard to the 17–18 December 1997 episode, the MM5 ensemble accumulates substantial precipitations for the whole of the Pyrenees range, including large areas over the Llobregat river basin (Fig. 10b). In addition, coastal ar-eas of the Gulf of Lyons are affected by remarkable precipi-tations as well. It seems clear that the south-westerly flow to-gether with the orographic enhancement of the Pyrenees de-termine the location of the intense rainfalls and the mesoscale model ensemble correctly captures this physical mechanism. A high degree of spatial consistency occurs among the mem-bers of the ensemble as reflected in the standard deviation field of Fig. 10b. Figure 11b shows that some members of the ensemble are very close to the observed peak flow, thus cor-recting the overforecasting of the control driven runoff peak flow. It is worth noting that the probabilities of exceedance
ofQp(T=5 yrs)andQp(T=10 yrs)are 1.0 and greater than 0.7,
respectively. Furthermore, the exceedance probability for the observed maximum discharge is above 0.5. Then, the proba-bilistic PV perturbed ensemble proves to be suitable for civil protection procedures for this case.
6.3.3 The 9–10 June 2000 episode
Recall that the control run missed completely this extreme case, since the greatest precipitation amounts were mainly located over the north-western part of the Pyrenees range, far away from the Llobregat river basin. Therefore, the con-trol driven runoff simulation was not able to produce any remarkable signal. Figure 10c depicts an important spread of the rainfall cumulative values over north-eastern Spain within the mesoscale model ensemble. It seems that the “Montserrat” hydrometeorological event is highly sensitive to the PV perturbations. This episode was characterized by an important orographic enhancement mechanism in the or-ganization, development and duration of the quasi-stationary mesoscale convective system, but the atmospheric dynami-cal forcing played an essential role as well. Dynamidynami-cal fac-tors are linked to the upper-level synoptic trough and mid-to-upper-tropospheric flow, which are emphasized by the PV perturbation approach. As consequence, the biases found in the control run are partially corrected, and in spite that none of the members of the ensemble is able to forecast the ob-served peak flow for this exceptional event, some of them yield important peak discharges (Fig. 11c). The probabilities
Table 5. ROC scores and the 95% percentile confidence intervals
for the control simulation, ensemble mean and ensemble members of all the hydrometeorological experiments, for hourly rainfall and runoff volumes.
control mean ensemble
rainfall volumes 0.62 (0.56–0.68) 0.65 (0.61–0.69) 0.58 (0.54–0.62)
runoff volumes 0.79 (0.73–0.84) 0.79 (0.73–0.84) 0.87 (0.83–0.89)
of exceeding the first and second warning discharge thresh-olds are close to 0.3 and 0.15, respectively. At least, a first theoretical warning could have been issued, even though the magnitude of the “Montserrat” episode would have remained completely undetected.
6.3.4 The 29–30 August 2004 episode
This summer episode was driven by physical processes of local convective origin. It was found for the MM5 determin-istic run a misplacement and underforecasting of the rain-fall amounts. Figure 10d depicts that the ensemble mean from rainfall is mainly located off the Catalonian coastline, south-eastwards from the Llobregat river basin, but precipita-tion amounts are also collected within the catchment. How-ever, the NWP ensemble underforecasts the observed rainfall amounts. This fact can be noticed on the cumulative distri-bution functions of peak discharges at Castellbell (Fig. 11d): only one member of the ensemble is sufficiently accurate to reproduce the observed discharge. Thus, the probabilities of exceeding both the observed maximum peak and the pre-determined thresholds –Qp(T=5 yrs) andQp(T=10 yrs) – lie
below 0.1. Obviously, the triggering of any emergency man-agement directives would have been suppressed.
It appears that the hydrometeorological events with an en-hanced synoptic-scale dynamical component are more sensi-tive to the PV perturbations, whereas the events with a more important orographic involvement in their development be-come more insensitive. It is worth to remember that the tech-nique for generating the EPS is based on randomly perturb-ing the upper-level precursor trough in a realistic magnitude. Therefore, if the biases in the deterministic QPFs are impor-tant, the great precipitation errors will be hardly corrected by the technique.
6.3.5 POD, F, BIAS and ROC skill indices
0 0.2 0.4 0.6 0.8 1
0 40 80 120 160
volume (103
m3 ) POD control mean ensemble (a) 0 0.2 0.4 0.6 0.8 1
0 40 80 120 160
volume (103
m3 ) POD control mean ensemble (a) 0 0.2 0.4 0.6 0.8 1
0 40 80 120 160
volume (103
m3 ) F control mean ensemble (b) 0 0.2 0.4 0.6 0.8 1
0 40 80 120 160
volume (103
m3 ) F control mean ensemble (b) 0 0.2 0.4 0.6 0.8 1 1.2 1.4
0 40 80 120 160
volume (103
m3 ) BI AS control mean ensemble (c) 0 0.2 0.4 0.6 0.8 1 1.2 1.4
0 40 80 120 160
volume (103
m3 ) BI AS control mean ensemble (c)
Fig. 12.POD, F and BIAS skill scores and the 95% percentile confidence intervals for different precipitation volume thresholds obtained by
the ensemble of MM5 simulations for all the hydrometeorological experiments.
0 0.2 0.4 0.6 0.8 1
0 40 80 120 160
volume (103
m3 ) PO D control mean ensemble (a) 0 0.2 0.4 0.6 0.8 1
0 40 80 120 160
volume (103
m3 ) PO D control mean ensemble (a) 0 0.2 0.4 0.6 0.8 1
0 40 80 120 160
volume (103
m3 ) F control mean ensemble (b) 0 0.2 0.4 0.6 0.8 1
0 40 80 120 160
volume (103
m3 ) F control mean ensemble (b) 0 0.2 0.4 0.6 0.8 1 1.2
0 40 80 120 160
volume (103
m3 ) BI AS control mean ensemble (c) 0 0.2 0.4 0.6 0.8 1 1.2
0 40 80 120 160
volume (103
m3 ) BI AS control mean ensemble (c)
Fig. 13.POD, F and BIAS skill scores and the 95% percentile confidence intervals for different runoff volume thresholds obtained by the
ensemble of MM5 driven runoff discharge simulations for all the hydrometeorological experiments.
also induces a rise of the F score. A tendency in underfore-casting the rainfall amounts at mid- and high thresholds can be observed attending to the BIAS index as well. The ensem-ble mean presents the highest ROC score as a consequence
runs at all the volume thresholds together with similar false alarm rates for both sets of experiments. A systematic under-forecasting of the precipitation amounts at all thresholds are found for the deterministic and the probabilistic experiments (Fig. 12c).
With respect to the driven runoff forecasts, Table 5 shows the highest performance in terms of ROC score for the full ensemble of all the hydrometeorological experiments owing to the smallest false alarm scores at small volume values. However, in terms of the probability of detection, the con-trol simulations appear to be superior. It is worth to note an overall underforecasting of the full ensemble of runoff exper-iments at all the thresholds, although the control simulations show a better behaviour for this feature (Fig. 13a–c). This general underprediction of the runoff volumes clearly bene-fits the false alarm rates which become smaller, and there-fore, leading to higher ROC scores. In addition, no improve-ment of the ROC scores is found when comparing the ensem-ble means against the deterministic simulations.
7 Conclusions and further remarks
The feasibility of HEC-HMS runoff forecasts driven by QPFs provided by the MM5 mesoscale model has been assessed over the Llobregat medium size river basin. This issue is fundamental to help extend the forecast lead times beyond the concentration time of the watershed. Any gain in these times could be used to trigger warning and emergency pro-cedures before extreme floods in order to alleviate their pos-sible hazardous consequences. The analysis has focused on four intense rainfall episodes which resulted in flood events of different spatial and temporal scales. These kinds of in-tense precipitation events – often highly localized and con-vectively driven – present short recurrence periods in the Spanish Mediterranean area and deserve special attenttion.
Deterministic quantitative precipitation forecasts for the four cases have been obtained by forcing the NWP model with the ECMWF large-scale forecasts, thus mimicking an operational hydrometeorological context. In addition, an en-semble of MM5 experiments has been introduced by means of realistic spatial shifts and changes in intensity of the upper-level synoptic-scale trough for each case study. The performance of the control QPFs has been evaluated from a comparison of the forecasted and observed rainfall volumes in space and time over the sub-basins by means of a set of continuous verification scores. The probabilistic QPFs have been evaluated following the same procedure, but using a set of categorical verification indices. This methodology allows to assess the performance of the forecasted rainfall patterns at the catchment scale. The one-way coupling between the meteorological and hydrological models has been regarded as a validation tool as well.
Most of the deterministic quantitative precipitation fore-casts have shown significant deficiencies over the Llobregat
river basin in terms of the rainfall amounts, their timing and localization. Obviously, these deficiencies have a major im-pact on the one-way coupling between the meteorological and hydrological models. Our ensemble strategy has been found useful to reduce these biases at the analyzed hydromet-ric sections – Castellbell and Sant Joan Desp´ı –, for most of the hydrometeorological episodes. However, the probabilis-tic approach would have indicated surpassion of pre-defined theoretical warning runoff thresholds for only the 17–18 De-cember 1997 case. It is worth to note that the procedure pre-sented in this work has been applied to a limited number of cases – although this population is representative of different dynamical atmospheric situations bearing important precipi-tation amounts – owing to the restricted number of important floods available in the databases. It must be expected that a future application and evaluation of this procedure for a broader climatology could better establish its confidence lev-els. Then, we could apply the presented methodology onto a larger sample of events in order to use the results from an operational perspective.
The value of our PV perturbed ensemble to encompass in a realistic way the uncertainties intrinsic to the QPFs has been proven. It has also been possible to highlight the sensitiv-ity – or insensitivsensitiv-ity – to the PV perturbations of different dynamical and orographic factors. The external-scale mete-orological uncertainties have been reflected through moder-ate spatial and temporal variations of the forecasted rainfall patterns as well as in significant changes of the precipitation amounts. Obviously, if the control simulations are character-ized by large biases, our ensemble strategy presents limita-tions when trying to address these forecast errors.
Acknowledgements. Florian Pappenberger, associate editor of Hydrology and Earth System Sciences, and two anonymous reviewers are deeply acknowledged for their valuable comments, which helped to improve the quality of this work. The Catalan Agency of Water (ACA) of the Department of Environment of the Government of Catalonia is acknowledged for providing the SAIH rain and flow data. Figure 1 was produced by Alberto Mart´ın from the Meteorology Group of the University of the Balearic Islands. This work has been sponsored by CGL 2005-03918/CLI (PRECIOSO) Spanish project, which is partially supported with FEDER funds.
Edited by: F. Pappenberger
References
Ag`encia Catalana de l’Aigua: Delimiting of flood plain for the draft of the INUNCAT. Internal Basins of Catalonia. Hydrological cal-culations and determination of the flood wave discharge, Vol. 2, Departament de Medi Ambient, Generalitat de Catalunya, 88 pp., 2001.
Ag`encia Catalana de l’Aigua: Technical recommendations for flood studies at local area, Departament de Medi Ambient, Generalitat de Catalunya, 106 pp., 2003.
Amengual A., Romero R., G´omez M., Mart´ın A., and Alonso S.:A hydrometeorological modeling study of a flash flood event over Catalonia, Spain, J. Hydrometeor., 8, 282–303, 2007.
Amengual A., Romero R., and Alonso S.: Hydrometeorological en-semble simulations of flood events over a small basin of Majorca Island, Spain, Q. J. R. Meteorol. Soc., 134, 1221–1242, 2008. Anderson, M. L., Chen, Z. Q., Kavvas, M. L., and Feldman, A.:
Coupling HEC-HMS with atmospheric models for prediction of watershed runoff, J. Hydrol. Eng., 7, 312–318, 2002.
Bacchi, B., Buzzi, A., Grossi, G., and Ranzi R.: Flood forecast-ing in a midsize catchment in the southern Alps: Recent expe-riences on the use of couple meteorological and hydrological model, Proceedings of the third EGS Plinius conference, Baja Sardinia, Consiglio Nazionale delle Ricerche, Roma, Italy, 201– 208, 2002.
Bartholmes, J. C., Thielen, J., Ramos, M. H., and Gentilini, S.: The european flood alert system EFAS – Part 2: Statistical skill as-sessment of probabilistic and deterministic operational forecasts, Hydrol. Earth Syst. Sci., 13, 141–153, 2009,
http://www.hydrol-earth-syst-sci.net/13/141/2009/.
Benjamin, S. G. and Seaman, N. L.: A simple scheme for improved objective analysis in curved flow, Mon. Wea. Rev., 113, 1184– 1198, 1985.
Benoit, R., Pellerin, P., Kouwen, N., Ritchie, H., Donaldson, N., Joe, P., and Soulis, E. D.: Toward the use of coupled atmospheric and hydrologic models at regional scale, Mon. Wea. Rev., 128, 1681–1706, 2000.
Benoit, R., Kouwen, N., Yu, W., Chamberland, S., and Pellerin, P.: Hydrometeorological aspects of the Real-Time Ultrafinescale Forecast Support during the Special Observing Period of the MAP, Hydrol. Earth Syst. Sci., 7, 877–889, 2003,
http://www.hydrol-earth-syst-sci.net/7/877/2003/.
Bhagarva, M. and Danard, M.: Application of optimum interpola-tion to the analysis of precipitainterpola-tion in complex terrain, J. Appl. Meteor., 33, 508–518, 1994.
Blackadar, A. K.: High resolution models of the planetary boundary layer, Adv. Environ. Sci. Eng., 1, 50–85, 1979.
Buizza, R. and Palmer, T. N.: The singular-vector structure of the atmospheric general circulation, J. Atmos. Sci. Eng., 52, 1434– 1456, 1995.
Chancibault, K., Anquetin, S., Ducrocq, V., and Saulnier, G.-M.: Hydrological evaluation of high-resolution precipitation fore-casts of the Gard flash flood event (8–9 September 2002), Q. J. R. Meteorol. Soc., 132, 1091–1117, 2006.
Chow, V. T., Maidment, D. R., and Mays L. W.: Applied hydrol-ogy, McGraw-Hill International Editions, Civil engineering se-ries, 572 pp., 1988
Davis, C. A. and Emanuel, K. A.: Potential vorticity diagnosis of ciclogenesis, Mon. Wea. Rev., 119, 1929–1953, 1991.
De Roo, A., Gouweleeuw, B., Thielen, J., Bates, P., Hollingsworth, A., et al.: Development of a European Flood Forecasting System, Int. J. River Basin Management, 1(1), 49–59, 2003.
Diaconis, P. and Efron, B.: Computer-intensive methods in statis-tics, Sci. Am., 248, 116–130, 1983.
Diomede, T., Davolio, S., Marsigli, C., Miglietta, M. M., Moscatello, A., and Papetti, P.: Discharge ensemble predictions based on multi-model precipitations forecasts, Geophy. Res. Ab-str., 8, EGU06-A-06931, 2006.
Diomede, T., Nerozzi, F., Paccagnella, T., and Todini, E.: The use of meteorological analogues to account for LAM QPF uncertainty, Hydrol. Earth Syst. Sci., 12, 141–157, 2008,
http://www.hydrol-earth-syst-sci.net/12/141/2008/.
Dolcin´e, L., Andrieu, H., Sempere-Torres, D., and Creutin D.: Flash flood forecasting with coupled precipitation model in mountain-ous mediterranean basin, J. Hydrol. Eng., 6, 1–9, 2001. Du, J., Mullen, S. L., and Sanders, F.: Short-range ensemble
fore-casting of quantitative precipitation, Mon. Wea. Rev., 125, 2427– 2459, 1997.
Ducrocq, V., Lebeaupin, C., Thouvenin, T., and Anquetin, S.: Mesoscale modelling of a cooding storm. Application to the ex-treme flood of Gard, 5th EGS Plinius conference, Ajaccio, Cor-sica, France, 2003.
Dudhia, J.: A nonhydrostatic version of the Penn State/NCAR mesoscale model: Validation tests and simulation of an Atlantic cyclone and cold front, Mon. Wea. Rev., 121, 1493–1513, 1993. Epstein, E. S.: Stochastic dynamic prediction, Tellus, 21, 739–759,
1969.
Ferraris, L., Rudari R., and Siccardi, F.: The uncertainty in the pre-diction of flash floods in the Northern Mediterranean environ-ment, J. Hydrometeor., 3, 714–727, 2002.
Gouweleeuw, B. T., Thielen, J., Franchello, G., De Roo, A. P. J., and Buizza, R.: Flood forecasting using medium-range probabilistic weather prediction, Hydrol. Earth Syst. Sci., 9, 365–380, 2005, http://www.hydrol-earth-syst-sci.net/9/365/2005/.
Homar, V., Romero, R., Ramis, C., and Alonso, S.: Numerical study of the October 2000 torrential precipitation event over eastern Spain: analysis of the synoptic-scale stationarity, Ann. Geophys., 20, 2047–2066, 2002,
http://www.ann-geophys.net/20/2047/2002/.