The Impact of the Osteosynthesis Devices over the
Trochanteric Area: Analysis Using the Finite Elements
Method
Ş
tefan CHINDRI
Ş
*1 “Iuliu Haţieganu” University of Medicine and Pharmacy Cluj-Napoca. Clinic of Ortopaedics and Traumatology, 47 General Moşoiu, 400132 Cluj-Napoca, Cluj, Romania.
E-mail: [email protected]
* Author to whom correspondence should be addressed; Tel.: 594023; Fax: +40-264-593256.
Abstract: The present research’s aim was to examine the ability to create an experimental model of the proximal femural region, to simulate the presence of an unstable intertrochanteric fracture line and an implant used for fracture fixation, using the finite element analysis. In addition, the PC software I used had the ability to examine the stress induced by static forces over the bone and implant and the deformation of the bone-implant assembly. The results are consistent and have clinical relevance, being useful in the choice of the implant design or implantation site in the operating area.
Keywords: Finite Element Analysis; Hip Fracture; Fracture Fixation.
Introduction
The finite element method (FEM), sometimes referred to as finite element analysis (FEA), is a numerical technique for finding approximate solutions of partial differential equations (PDE) as well as of integral equations. In solving partial differential equations, the primary challenge is to create an equation that approximates the equation to be studied, but is numerically stable, meaning that errors in the input data and intermediate calculations do not accumulate and cause the resulting output to be meaningless. There are many ways of doing this, all with advantages and disadvantages.
The Finite Element Method is a good choice for solving partial differential equations over complex domains, when the domain changes (as during a solid state reaction with a moving boundary), when the desired precision varies over the entire domain, or when the solution lacks smoothness.
In a structural simulation, FEA helps tremendously in producing stiffness and strength visualizations and also in minimizing weight, materials, and costs. FEM allows detailed visualization of where structures bend or twist, and indicates the distribution of stresses and displacements. FEM software provides a wide range of simulation options for controlling the complexity of both modelling and analysis of a system
More recently these techniques have been utilized in a biomedical engineering context, for modelling parts of the human body using realistic biomechanical data for the relevant tissues/materials. Furthermore, finite element techniques, used purely as a computer graphics construct, are finding application in physically based modelling and deformable models that incorporate Newtonian mechanics to produce realistic behaviour and animations [1].
volume of information to be stored in the software and the lack of automated software to import such data [4].
Material and Method
The research took place at the Faculty of Materials Science and Engineering of The Technical University of Cluj-Napoca. The used software was RDM-Elementes finis, commonly used in this department. The final analysis has been made on a two dimensional or plane model of a proximal femoral region, an unstable intertrochanteric line and a fracture fixation device called DHS (Dynamic Hip Screw)
• Step1. Defining geometrical dimensions and object shape
In order to determine the exact shape and dimension of the proximal femoral region a molding of the region was created, using plaster of Paris, the genuine model representing a cadaver femur. Epoxidic synthetic resin has been poured in the molding. The resulted pattern was divided in sections in the frontal plane in order to obtain a 5 mm plane section (Figure 1).
Figure 1. Frontal section of the epoxidic cast
The outline of the pattern was drawn on scale paper. In the same time the axis of co-ordinates and the reference point were defined on the scale paper. The origin and end point of any straight line and curve was defined in accordance with this co-ordinates (Figure 2).
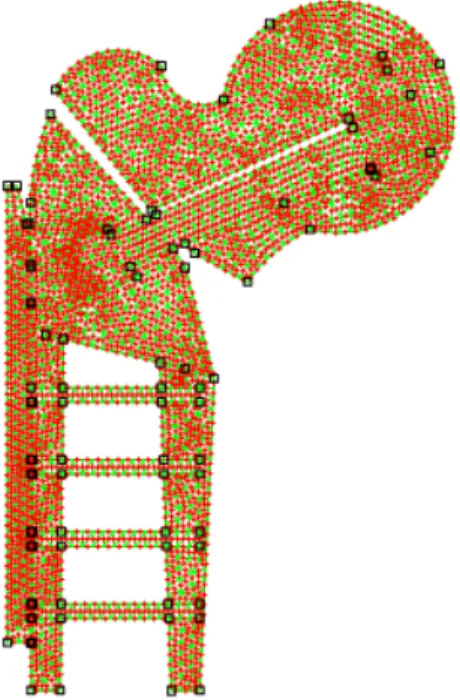
• Step 2. Discretization of the resulted pattern (unstable intertrochanteric fracture, dynamic hip screw). This has been made using triangular elements, with 6 nodes, leading to a model containing 2384 triangular elements and 5267 nodes.
Figure 3. Discretization of the resulted pattern
• Step 3. Defining the mechanical properties of the materials of the assembly. The given values for Young’s elastic modulus are [5] (Figure 4):
o cortical bone 17.3 Gpa o trabecular bone 10.5 Gpa o steel 210 Gpa.
• Step 4. Defining the fulcrum. The assembly has to be firm relating to both axis ox and oy (Figure 5).
Figure 5. Definition of the fulcrum.
• Step 5. Defining the force bearing area. The assembly has to be loaded in a manner that imitates the physiological load bearing over the femoral head and the pull of the pelvitrochanteric muscles over the greater trochanter. Values of the forces were established at 10 N/mm², for the load and 0.4 N/mm² for the traction (Figure 6).
• Step 6. The phase of the post processing of the inputted data. The used software gives the results.
Results
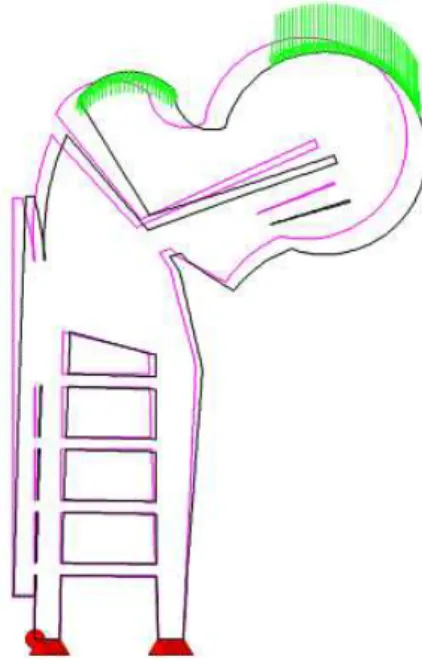
The analysis of the deformation values are represented in the next Figure 7. It can be seen that the highest values are at the level of the femoral head and neck (Figure 7).
The next figure represents the disposal of the shear stress (Tresca forces) over the bone-implant assembly. The maximum values are at the level of the traction screw (Figure 8).
Figure 7. Image of the pattern before and after loading
Further, the used software has the capability to provide sections over the bone-implant assembly.
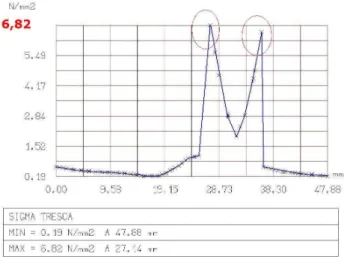
On the first section, the highest strain level is concentrated at the superior pole of the traction screw, at the bone-metal contact site. The maximal stress has the value of 6.82 N/mm² (Figure 9 and 10)
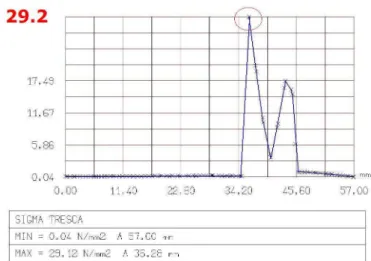
The same distribution of the shear stress can be seen on sections 2, 3 and 4. The maximal shear stress levels are 16.3 N/mm², 29.1 N/mm² and 22 N/mm² (Figures 11-16).
Figure 9. Section through the femoral head
Figure 10. Distribution of the forces through the section from figure 9
Figure 11.Section through the femoral neck
Figure 12. Distribution of the forces through the section from figure 11
The maximal shear stress values can be seen at the most distal screw, both on the inner and external cortex. The maximal value is 5 N/mm² (Figure 19).
Figure 13. Section through the intertrochanteric line,proximal to
the fracture site
Figure 14. Distribution of the forces through the section from figure 13
Figure 15 Section through the intertrochantericline,distal to the
fracture site
Figure 16. Distribution of the forces through the section from figure 15
Discussion
The actual study started from the need of understanding the way the Dynamic Hip Screw reacts with the trochanteric area during cyclic load bearing, following an unstable intertrochanteric fracture.
The usage of FEA method gives the possibility to simulate the behaviour of any bone implant used in this bone area, in a way that is very close to the real condition.
The analysis of figures 9-16 reveals the distribution of the strain beyond the traction screw.
Figure 17. Section through the external femoral diaphysis
Figure 19. Distribution of the forces through the section from Figure 17 and 18
In figures 10, 12, 14, 16 on can see that the strain levels over the superior margin of the traction screw are much higher than the loading, initial, stress. The stress levels are over the shearing appliable force over the cancellous bone tissue, meaning that the bone-implant assembly is yet unstable. Full weight bearing is not possible on this assembly, until bone healing will occur.
In figure 18 on can see the distribution of the shear stress over the femoral plate. The maximum load is over the last cortical screw, both on the internal and external cortex. The stress over this screw is four times greater than on the other three screws.
The advantages of the finite element method are:
• The ability to simulate various types of sites, fracture patterns and fracture complexities. • The ability to define the loading values or sites in order to be as close as possible to the
physiological loading pattern.
• The ability to carry out an infinite number of sections over the resulted assembly, in order to emphasize the stress locations and values.
• The ability to offer a highly impressive visual representation, under the appearance of diagrams.
The disadvantages of this method are:
• The data input is highly demanding. A minor mistake over this data ca mislead the outcome • The inability to define the interfaces in motion between two different surfaces.
Conclusions
Finite element analysis provides the resources for an elaborate research over the mechanical impact concerning an exact bone area.
References
1. Wirtz DC, Pandorf T, Portheine F, Radermacher K, Schiffers N, Prescher A, et all. Concept and development of an orthotropic FE model of the proximal femur. J Biomech 2003;36(2):289-93.
2. Tai CL, Shih CH, Chen WP, Lee SS, Liu YL, Hsieh PH. Finite element analysis of the cervico-trochanteric stemless femoral prosthesis. Clin Biomech 2003;18(6):53-8.
3. Sakai R, Itoman M, Mabuchi K. Assessments of different kinds of stems by experiments and FEM analysis: appropriate stress distribution on a hip prosthesis. Clin Biomech 2006;21(8):826-33.
4. Sowmianarayanan S, Chandrasekaran A, Kumar RK. Finite element analysis of a subtrochanteric fractured femur with dynamic hip screw, dynamic condylar screw, and proximal femur nail implants--a comparative study. Proc Inst Mech Eng [H] 2008;222(1):117-27.
5. Corvin SC et all. Bone Mechanics Handbook.Second ed. New York; CRC Press, 2001