Spatial and temporal variations of
Cocconeis placentula
var.
euglypta
(Ehrenb.) 1854 Grunow, 1884 in drift and periphyton
Gari, EN.* and Corigliano, MC.
Departamento de Ciencias Naturales, Facultad de Ciencias Exactas Físico Químicas y Naturales, Universidad Nacional de Río Cuarto, Ruta 36, Km 601, 5800, Córdoba, Argentina
*e-mail: ngari@exa.unrc.edu.ar
Received September 16, 2004 – Accepted February 1, 2006 – Distributed November 30, 2007 (With 6 figures)
Abstract
Spatial and temporal variations of Cocconeis placentula var. euglypta in drift and periphyton were studied in mountain streams of the Córdoba Province (Argentina). The sampling program was conducted in study sites located on a con-fluence between different order streams during an annual cycle. Samples were also taken every two hours during the daylight period in high and low water conditions. The relationship between drift and cellular reproduction was evalu-ated by valve length biometrics analysis. C. placentula var. euglypta drift was continuous; its density was not always dependent on periphyton density in each locality. C. placentula var. euglypta drift could be related to abiotic factors such as temperature and flow during the annual cycle. There were significant differences between periphyton and drift valve lengths. Moreover, drift can be associated with cellular reproduction because density was higher when valve lengths were shorter at different hours of the day. C. placentula var. euglypta epiphytims on Cladophora glomerata also influenced drift density and size distribution, modifying the relationship between periphyton and drift during the late spring when C. placentula var. euglypta was detached from senescent mats.
Keywords: periphyton, drift, stream, Cocconeis placentula var. euglypta.
Variações espaciais e temporais do Cocconeis placentula
var. euglypta, na deriva e no perifiton
Resumo
As variações espaciais e temporais do Cocconeis placentula var. euglypta, na deriva e no perifiton, foram estudadas em córregos da montanha da província de Córdoba (Argentina). O programa de amostragem foi conduzido, durante um ciclo anual, nas estações de coleta situadas antes e após uma confluência entre córregos da ordem diferente. As amos-tras foram feitas também a cada duas horas ao longo do período de luz do dia, sob condições de águas altas e baixas. O relacionamento entre deriva e reprodução celular foi avaliado pela análise biométrica do comprimento da valva. A deriva do C. placentula var. euglypta foi contínua, sua densidade não dependeu sempre da densidade do perifiton em cada uma das estações de coleta. A deriva demonstrou uma correlação com fatores abióticos como a temperatura e o fluxo no ano. Foram obtidas diferenças não significativas entre os comprimentos das valvas do perifiton e da deriva. Adicionalmente, a deriva pode ser associada à reprodução celular porque a densidade foi maior quando os compri-mentos das valvas foram mais curtos, em diferentes horas do dia. Epifitia do Cocconeis placentula var. euglypta sobre Cladophora glomerata também influenciou na densidade da deriva e na distribuição dos tamanhos. Modificaram-se os relacionamentos entre as densidades do perifiton e da deriva quando Cocconeis placentula var. euglypta fora despren-dido das esteiras senescent , na primavera tardia.
Palavras-chave: perifiton, deriva, córrego, Cocconeis placentula var. euglypta.
1. Introduction
The dislodgement of periphyton cells in streams with a strong flow speed establishes a link with a true phy-toplankton component that has ecological implications in river functions due to the importance of transported algae in river food weds (Wallace and Merritt, 1980; Feminella and Resh, 1991). Periphyton organisms that
The number of individuals does not increase because drift cells recolonize the substrate downstream (Klasvik, 1974; Müller-Haeckel, 1976).
Algal species have differences in the predisposition to drift that can be determined by their life form and morpho-logical characteristics. Those that attach strongly to the substrate present a greater resistance to the drag forces of the flow (Rosowski, et al., 1986; Steinman and Mc. Intire, 1986; Kawamura and Hirano, 1992). Mechanical release by abrasion of substrate and by herbivorous invertebrate activities also accounts for periphyton cell displacements to free waters (Stevenson, 1983; Silvester and Sleigh, 1985). In addition, the unicellular diatoms, like other unicellular algae in running water, have a circadian verti-cal migration (Müller-Haeckel, 1971) that influences the drift process. Therefore, the factors affecting drift -cel-lular activities, biotic and abiotic external mechanisms and endogenous rhythms- altogether cause the periphy-ton cells to incorporate into stream plankperiphy-ton. This proc-ess affects numerous fluvial system functions: biomass transport, food availability for filter organisms, popula-tion dispersion and colonizapopula-tion of substrates eroded by floods or contamination. However, there are few studies devoted to the evaluation of the mechanisms that influ-ence the periphyton drift.
Cocconeis placentula var. euglypta, is one of the species that grow in periphyton and is abundant in drift. It is a late colonizer, efficient in incorporating nutrients, with a prostrate habit, having a slow movement and high sticky force (Stevenson and Peterson, 1989; Kawamura and Hirano, 1992). In addition, it is the most abundant epiphyte on Cladophora glomerata (L.) Kütz., which is a suitable substrate for diatoms (Dodds and Gudder, 1992; Allan, 1995). In foothill streams of southern Comechingones Sierras, Cladophora glomerata (L.) Kütz displays the maximum vegetative growth in spring, when the rainy season begins and floods transport the macroalga mats (Corigliano et al., 1998). This proc-ess influences C. placentula var. euglypta drift, which is dominant in the epilitic communities (Luque et al., 1997; Luque and Martínez de Fabricius, 2000; Martínez de Fabricius et al., 2003). Vegetative multiplication of diatoms involves a decrease tendency of valve size after several generations, as it has been demonstrated experi-mentally, although not yet in natural population studies (Round et al., 1990). The analysis of frequency in valve length can be an indicator of the demographic conditions of drifting and periphyton populations of diatoms. The aim of this study is to compare drift periphyton abundance and valve sizes in populations of Cocconeis placentula var. euglypta (Ehr.) Grun. from foothill streams during annual and diurnal periods.
2. Material and Methods
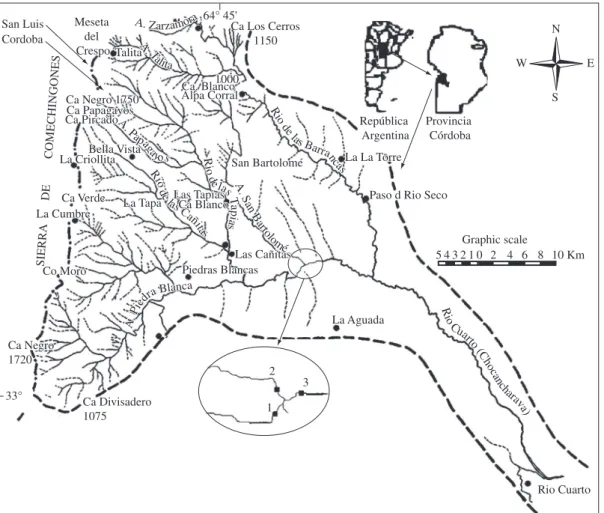
The study area is located in the upper basin of the Chocancharava river, in the southern part of Comechingones Sierras, Cordoba, Argentina. The area is between two phytogeographical units; Bosque Serrano
and Espinal woodlands, areas that have been very im-poverished by forestry and agricultural practices, with low human population density. Streams are fed by groundwater during dry seasons and flood pulses oc-cur during summer storms. Bottom materials are com-posed of cobble, boulders and gravel in riffles. Pools and backwaters are covered by sand and silt, surrounded by aquatic and semiaquatic plants such as Myriophyllum elatinoides, Myriophyllum brasiliense, Polygonum acuminatum and Hydrocotile bonaerensis. Cladophora glomerata filaments (1-3 m long) cover streambeds from July to October. An exotic fish species, rainbow trout Onkorhynchus mykiss, was introduced in upland streams in 1930.
The study sites were located in the confluence of two tributaries streams Piedra Blanca (study site 1PB) and San Bartolome (study site 2SB) and the main river Chocancharava (study site 3CH) in foothill regions at 550 m.a.s.l., 32° 56’ S and 64° 41’ (Figure 1). At this point Piedra Blanca is a fourth order stream that drains an area of 326 km2. An average annual discharge at the
sam-pling site is 3.25 m3.seg-1. The hydraulic parameters of
the river channel (current velocity, channel width, depth) were recorded and physical and chemical variables –pH, temperature and conductivity- were measured monthly in situ, with portable electronic sensors Altronix CT2. To characterize ionic composition, water samples were taken in high water and low water conditions. Sulfate (SO4), chloride (Cl), aluminum (Al), calcium (Ca), iron (Fe), potassium (K), magnesium (Mg), manganese (Mn), sodium (Na) carbonate (CO3) and bicarbonate (HCO3), were analyzed according to standard methods (APHA, 1989). The precipitation data came from the National University Rio Cuarto, Meteorological Station in a near-by location (La Aguada). These data were used instead of discharge data, since there are no gauge stations at study streams. In each site, periphyton and drift sam-ples were taken monthly from April 1994 to May 1995. Samples were taken at the same time from 10:00 AM to 1:00 PM. Samples for the analysis of diurnal distri-bution of Cocconeis placentula var. euglypta drift were taken during the light period from 7:00 AM to 8:00 PM, with two hour intervals, in one day of high water (DHW, March) and one day of low water (DLW, June) condi-tions, in the main river (study site 3CH). Periphyton was sampled scraping 0.010 m2 off randomly selected stones
and drift was collected by filtering 100 liters of water through a 25-µm mesh size plankton net. Counts were made by a transect method (Villafañe and Reid, 1995) and measurements of valve length (VL) and valve width (VW) of C. placentula var. euglypta were accomplished using an optical microscope to 100 x. At least 60 indi-viduals per sample were measured.
2.1. Data analysis
condi-tions of normality (Kolmogorov Smirnov Test, Cochran test and Barlett- Box test), original data were standard-ized by means of log (x+1) to stabilize the variance, ex-cept for pH values. Chi-Square Statistics χ2 were used
to compare expected valve size frequencies, F statistics were applied to compare the variance of two samples and t statistics were used to compare two sample means. Pearson correlation coefficients were calculated in each date and locality to examine if there was an alometric function between valve width and valve length.
Differences in VL and abundance for periphyton and drift cells from different sites and dates were tested us-ing one-way ANOVAs. When the ANOVA yielded sig-nificant results, post hoc analyses were done using the Tukey’s Honest Significant Different (HSD) Test (Steel and Torrie, 1988). Monthly and diurnal samples were grouped by principal component analysis (PCA) using the CANOCO program, version 3.10 (Ter Braak 1988). A dataset of 73 samples was used in the monthly PCA and a dataset of 13 samples was used in the diurnal PCA. The variables used in the ordination were VL means, VL ranges, Maximum and Minimum VL, organism density (percent standardized to analyse drift and periphyton
abundance simultaneously), water temperature, hydro-gen ion potential (pH), conductivity, stream current ve-locity and pluviosity (rainfall). In addition, the daytime sampling hour was used as a variable in the diurnal or-dination.
3. Results
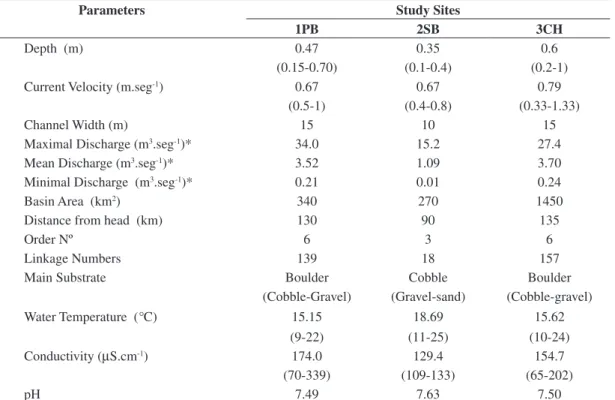
Geographic, physical and chemical parameters supported the characteristics of temperate streams with thermal and hydrological seasonal amplitudes and flood pulses originated by pluvial precipitations (Table 1). Rainfall was concentrated in the spring-sum-mer months, and consequently, higher temperatures were observed in higher water conditions (Figure 2). Stream waters were calcium bicarbonatates and cir-cumneutrals (Table 2). All observed organisms were vegetative cells as reproductive forms like conjugants or auxospore pairs were not observed. The average of 30 Pearson correlation coefficients obtained was r: 0.82 ± 0.12, (p < 0.05), indicating a strong correla-tion between valve width and length in all dates, so VW and VL grew isometrically, although the valve width
N S W E SIERRA DE COMECHINGONES Graphic scale R io C
uart
o
(C ho
canc
hara
va)
San Bartolomé R
io de
las B
arranc
as R
io de
las B
arranc
as
R
io
de las B
arranc as 1 2 3 Ri
o de las C
añitas
Ri
o de las C
añitas La Tapa La Tapa La Cumbre La Cumbre A
. Papa gayos
A
. Papa
gayos
Piedras Blancas Piedras Blancas
La Aguada
Rio Cuarto Paso d Rio Seco
La La Torre La La Torre Meseta
del
Crespo A. T alita
A. Ta lita Talita Talita Ca Verde Ca Verde A. Pied
ra Blanca
A.
Pied
ra Blanca A
. S an
B arto
lomé
A . S
an B
arto
lomé Las Cañitas Las Cañitas R i o de
las Ta
p ia s R i o de
las Ta
p
ia
s
Ca Divisadero 1075
Ca Los Cerros 1150 Bella Vista Bella Vista La Criollita Las Tapias Las Tapias Ca Blanco Ca Blanco Ca. Blanco Alpa Corral Ca. Blanco Alpa Corral 1000 1000 A. Zarzamora A. Zarzamora 64° 45'
Ca Negro 1720 Ca Negro 1720 Ca Papagayos San Luis
Ca Negro 1750 Cordoba
Ca PircadoCa Papagayos Ca Negro 1750 Ca Pircado 33° República Argentina Provincia Córdoba
5 4 3 2 1 0 2 4 6 8 10 Km Co Moro
Co Moro
was more constant than the length. For this reason we only used VL for size analyses.
VL range varied between 9.60 to 40 µm during the study period, and the range of the VW varied between 7.2 to 12 µm. There were no significant differences be-tween VL means (t-test statistics), and VL frequency dis-tribution (χ2 statistics) on drift and periphyton in each
locality. Whereas the F statistic showed evidence that variances were heterogeneous between 1PB (F(225; 245): 2.15, p < 0.01) and 2SB (F(123; 144): 1.61 p < .01). The VL of all samples changed significantly between the months (ANOVA F(46- 11) = 5.88, p < 0.0001) and the Tukey HSD test determined that September and October were the months that influenced the change. Drift cell size ranges displayed the minimum VL values in the summer. The results of the ANOVA comparing VL between
periphy-Table 1. Hydraulic and physical.-chemical parameters of study sites in the Comechingones Sierras streams, Córdoba,
Argentina.
Parameters Study Sites
1PB 2SB 3CH
Depth (m) 0.47 0.35 0.6
(0.15-0.70) (0.1-0.4) (0.2-1)
Current Velocity (m.seg-1) 0.67 0.67 0.79
(0.5-1) (0.4-0.8) (0.33-1.33)
Channel Width (m) 15 10 15
Maximal Discharge (m3.seg-1)* 34.0 15.2 27.4
Mean Discharge (m3.seg-1)* 3.52 1.09 3.70
Minimal Discharge (m3.seg-1)* 0.21 0.01 0.24
Basin Area (km2) 340 270 1450
Distance from head (km) 130 90 135
Order Nº 6 3 6
Linkage Numbers 139 18 157
Main Substrate Boulder Cobble Boulder
(Cobble-Gravel) (Gravel-sand) (Cobble-gravel)
Water Temperature (°C) 15.15 18.69 15.62
(9-22) (11-25) (10-24)
Conductivity (µS.cm-1) 174.0 129.4 154.7
(70-339) (109-133) (65-202)
pH 7.49 7.63 7.50
* From Agua y Energía, 1987.
0 20 40 60 80 100 120 140 160
Apr 94
Jul Sep Nov Jan 95
Mar May
°C
0 5 10 15 20 25 30
mm
Rainfall Water Temperature °C
Figure 2. Monthly variations of rainfall and mean
wa-ter temperature at study sites in the Chocancharava basin streams, Córdoba, Argentina.
Table 2. Chemical variables of study site 3CH during high water and low water sampling days in the Comechingones Sierras streams, Córdoba, Argentina.
Study sites
C µS.cm-1
SDT mg.L-1
CO3H -mg.L-1
SO4 = mg.L-1
Cl -mg.L-1
Na+ mg.L-1
K+ mg.L-1
Ca++ mg.L-1
Mg++ mg.L-1
F -mg.L-1 High waters 1PB 225.00 154.90 88.50 16.91 7.71 11.16 3.08 21.60 5.61 0.30
sites of periphyton and drift samples (Figure 4). Those of the same day and sites grouped together were indicated by a positive correlation between drift and periphyton density (r = 0.49, p < 0.05, n = 73).
The daily thermal amplitude was of 5 degrees, 17 to 22 °C in the summer and 8 to 13 °C in the winter in the study site 3CH, where drift diurnal samples were obtained every two hours, during photo phase periods. Differences between diurnal height water samples (DHW) and diur-nal low water sample (DLW) densities were observed related to the time of day. The density curve was bimo-dal in DHW, maximum densities observed at 1:00 and 6:00 PM and in DLW maximal density was at 7:00 PM. (Figure 5). In DLW, the minimum value of the VL was correlated with a temperature (r: 0.78, p < 0.05); χ2, F,
and t statistics indicated significant differences of LV between DHW and DLW. The former had a greater size (χ2: 11.54; n: 900; p < 0.01; F
(480; 420) 1.18, p < 0.01; t: 2.5
n: 900; p < 0.05), and higher density. One way ANOVA showed significant differences within the diurnal time schedule: ANOVA DHW F(7-393)= 3.098, p < 0.03; The Tukey HSD test showed significant differences within
0 1.3 2.6 3.9 5.2 6.5 Density (or g.mL -2.10 3) Density (or g.mL -2.10 3) Density (or g.mL -2.10 3) 40 30 20 10 0
Apr Jul Sep Nov Jan Mar May Apr Jul Sep Nov Jan Mar May
Apr Jul Sep Nov Jan Mar May
Apr Jul Sep Nov Jan Mar May
VL M m) VL M m) VL M m) VL M m) VL M m) VL M m) 1 PB Drift
1.8 1.5 1.2 0.9 0.6 0.3 0
Apr Jul Sep Nov Jan Mar May 2 SB Drift
40 30 20 10 0 3 2.5 2 1.5 1 0.5 0
Apr Jul Sep Nov Jan Mar May
60 50 40 30 20 10 0 30 20 10 0 40 30 20 10 0 40 30 20 10 0 40 30 20 10 0 50 40 30 20 10 0 3CH Drift Density (or g.mL -1) Density (or g.mL -1) Density (or g.mL -1) 2SB Periphyton 1 PB Periphyton
3 CH Periphyton
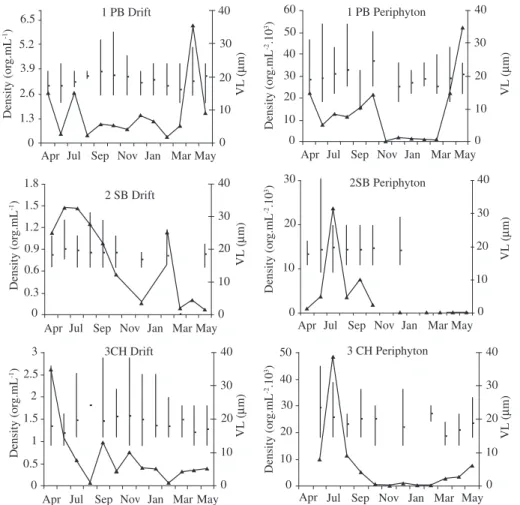
Figure 3. Monthly variations of mean and range of valve length (vertical lines) and density (continuous lines) of Cocconeis
placentula var euglypta in drift and periphyton of the study site. 1PB: Piedra Blanca stream, 2SB: San Bartolomé stream, 3CH: Chocancharava river.
ton and drift values among the 3 study sites were not sig-nificant. The highest densities of Cocconeis placentula var. euglypta in periphyton were registered in the winter in 2SB and 3CH and the autumn in site 1PB and the low-est in the summer in 1PB and the summer and autumn in 2SB and 3 CH. The drift maximal peak was registered in April (1995) in site 1 PB (Figure 3). ANOVA for peri-phyton and drift density among dates, sites and origin of the cells showed significant differences between study sites 1PB and 2SP (ANOVA F(2-70) 4.28,p < .0017, the Tukey HSD test p < .003) and among months (ANOVA F(12-6) = 2.84, p < .0038). The Tukey HSD test showed differences of July and December, February and March. Density was not associated with periphyton and drift ori-gin of the cells (ANOVA F (1-71) = 1.22 p > 0.05)
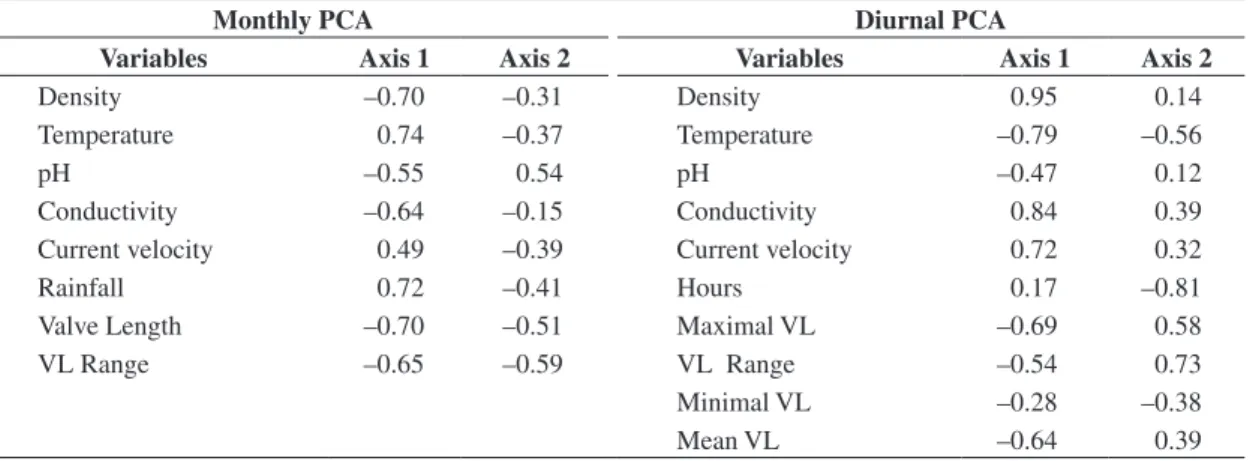
Table 3. Factor scores on Axis 1 and Axis 2 of biological and environmental variables in monthly and diurnal PCA ordina-tions. Bold type indicates factor loading ≥ 0.70.
Monthly PCA Diurnal PCA
Variables Axis 1 Axis 2 Variables Axis 1 Axis 2
Density –0.70 –0.31 Density 0.95 0.14
Temperature 0.74 –0.37 Temperature –0.79 –0.56
pH –0.55 0.54 pH –0.47 0.12
Conductivity –0.64 –0.15 Conductivity 0.84 0.39
Current velocity 0.49 –0.39 Current velocity 0.72 0.32
Rainfall 0.72 –0.41 Hours 0.17 –0.81
Valve Length –0.70 –0.51 Maximal VL –0.69 0.58
VL Range –0.65 –0.59 VL Range –0.54 0.73
Minimal VL –0.28 –0.38
Mean VL –0.64 0.39
11:00 AM vs. 7:00 AM, 1:00 PM and 7:00 PM, (p < 0.05), and ANOVA DLW F(6-413) = 2.94, p < 0.008; the Tukey HSD test showed significant differences within 1:00 PM vs. 3:00 PM and 7:00 PM., (p < 0.05).
In the PCA grouping of diurnal samples the two first axes (F1: eigenvalues: 0.43; F2: eigenvalues: 0.25) ex-plained 68% of the accumulated variance. Samples were ordered in two groups: high water and low water sam-ples dispersed by hourly scheduled sequences in each ordination quadrant (Figure 6). The F1 correlated with a
3JaD
Current velocity
1 Fd3Md 1Dp3Dd 3Aprp3Nd 1Nd3Dp
1Dd 3Myd 1Jad
1Md
Rainfall Water Temperature temperature 2Fd
2App 2Dd2Dd
2Op 2Dp 1Mp 1 Jap
1 Jap 3Fd 1Fp
Axis 1 2Myd
2Od3Mp 3Fp
2Aprd 3Jap
1Np 2Md3Np 2Mp 2Fp 2Aprp 2Myp 3Agd
3Od 1Agd
2Sp 2Sp 2Agp
3Op 2Jlp pH
1Jnp 1Jnd 1Sp 1Sd 3Jld 3Agp
1Agp 3Sd 1Jld
1Jlp 2Jnd 2Jld 2Jlp
3Sp 2Agd3Jlp
Conductivity Density Mean VL Range VL
1Op 1Od 3Jnp 3Apd 3Apd 3Aprd 1App1Aprp
1Apra 3Myp 1Myd 1Myp
2Apd 2Apd 1Apd 1Apd3Jnd
+1.0 –1.0
–1.0
+1.0
Axis2
density (r: 0.95; p < 0.05), water temperature (r: –0.79, p < 0.05), conductivity (r: 0.84, p < 0.05) and current velocity (r: –0.72, p < 0.05) and the F2 correlated with an hourly schedule (r: –0.81, p < 0.05) and LV ranges (r: – 0.73, p < 0.05) (Table 3).
4. Discussion
Seasonal and daily variations in VL and the density of C. placentula var. euglypta cells in periphyton and
Figure 4. Principal Component Analysis (PCA) plots of samples based on physical and chemical parameters and Cocconeis
drift were observed. Density values were higher in the winter and early spring, despite shorter light periods. In the summer, rains and the consequent increase in stream discharge and current velocity reduced the periphyton
DHW a
M
m
7:00 AM 11:00 AM 3:00 PM 7:00 PM
DHW b
M
m
7:00 AM 11:00 AM 3:00 PM 7:00 PM 4
10 16 22 28 34 40
0.00 0.10 0.20 0.30 0.40 0.50 0.60 0.70
or
g.mL
–1
7:00 AM 11:00 AM 3:00 PM 7:00 AM c Density
DHW DLW Min-Max 25-75% Median value
Figure 5. Drift patterns observed during daylight hours in high water (DHW) and low water conditions (DLW). a and b) Valve length and c) density of Cocconeis placentula var euglypta cells.
density, with smaller valve sizes from November to March, which indicates higher cellular activity.
The epiphytic life form of this species is also a trait that can influence its drift with water flow, when the
se-1LW 2LW
3LW 4LW6LW
5LW 8LW 2HW
3HW
6HW
5HW 4HW
8HW 7HW
1HW 1HW
Hour Range VL
MaxVL Mean VL
pH
Current velocity Conductivity
Density
Water temperature
Axis 1
Axis 2
+1.0 –1.0
–1.0
+1.0
MinVL
nescent filaments of Cladophora glomerata detach from the thallus during the late spring (Corigliano et al., 1998). This would explain the presence of drifting C. placentula var. euglypta cells when they are under minimal densi-ties in periphyton or even when they are absent. Other authors have reported that C. placentula var. euglypta is frequent in drift even when it has not been recorded in epilitic communities (Yoshitake and Fukushima, 1985). The drift process does not constitute a significant erosion of periphyton populations because substrate recovery by algae occurs immediatly after rain (Müller-Haeckel and Håkansson, 1978; Halminton and Duthie, 1987).
During the summer, the C. placentula var. euglypta density diminished or was absent in periphyton, prob-ably because the processes of substrate recolonization were made by the early colonizers like Achnanthidium minutissimum (Küt.) Czarnecki (Stevenson and Peterson, 1991) that accompanies C. placentula var. euglypta in al-gal communities in study sites (Luque et al., 1997).
There are few previous data of daily hourly based studies of diatom drift in streams. Müller-Haeckel (1971) investigated drift circadian rhythms in a polar stream, but in tempered zones there are not many previous records throughout a dial period. Our results showed evidence of two types of density increase: one around mid afternoon (3:00 PM in DLW), coincident with that observed by Halminton and Duthie (1987), and another at sunset.
The frequency of VL values, both seasonal and daily, indicates a heterogeneous population and significant shifts in spring months, of the annual cycle, and at mid-day, in diurnal hours, when 75 % of VL was lower.
A tendency to decrease in valve size after several generations could be accepted as a premise, although there are not yet enough studies in natural populations (Round et al. 1990). With respect to the diurnal differ-ences, the PCA showed a higher density in low waters. A separation in the samples of hourly measurements was observed. Significant changes in valve length were re-vealed by ANOVA after midday, which suggests that a mitotic activity took place in periphyton and that daugh-ter cells were released to drift.
Cocconeis placentula var. euglypta drift is continu-ous during the annual cycle and at different hours of the day. Length frequency distributions showed evidence of significant changes between periphyton and drift cells and valve sizes underwent seasonal changes in both as-semblages. C. placentula var. euglypta drift seems to be related to abiotic factors like temperature and discharges during the annual cycle, and to cellular reproduction process, during the different hours of the light period.
Acknowledgments — This work was supported by the Consejo Nacional de Investigaciones Científicas (CONICET) and Secretaria de Ciencia y Técnica de la Universidad Nacional de Río Cuarto (SCYT, UNRC).
Reference
AGUA y ENERGÍA. ELECTRICA SOCIEDAD DEL ESTADO., 1987. Estadística Hidrológica hasta 1983. Tomo I.
Fluviometría. Red hidrometeorológica. Buenos Aires: División de Recursos Secretaria de energía. 230p.
ALLAN, DJ., 1995. Stream Ecology. Structure and function of running waters. 1st. ed, London: Chapman and Hall, 400p. ISBN 04122-29450-3.
AMERICAN PUBLIC HEALTH ASSOCIATION (APHA). Standard Methods for the Examination of Water and Waste Waters. 17th ed. Washington: American Public Health Association, 1989. 1275p. ISBN: 087553161-X
CORIGLIANO, MC., MARTÍNEZ DE FABRICIUS AL., 1998. and SÁNCHEZ V. Desarrollo estacional de Cladophora glomerata (L.) Kütz. en el arroyo Piedras Blancas. Revista UNRC, vol. 18, no. 1, p. 103-111.
DODDS, WK and GUDDER, DA., August 1992. The ecology of Cladophora. Journal of Phycology, vol. 28, no. 4, p. 415-427. FEMINELLA, KK, and RESH, VH., July 1991. Herbivorous caddisflies, macroalgae and epilithic microalgae dynamic interaction in a stream grazing system. Oecologia, vol. 87, no. 2, p. 247- 256.
HALMINTON, PB. and DUTHIE, HC., 1987. Relationship between algal drift, discharge and stream orden in a boreal forest watershed. Archiv für Hydrobiologie, vol. 110, no. 2, p. 275-289.
KAWAMURA, T. and HIRANO, R., November 1992. Seasonal changes in benthic diatom communities colonizing glass slides in Aburtsubo Bay, Japan. Diatom Research, vol. 7, no. 2. p. 227-239.
KLASVIK, B., 1974. Computerized analysis of stream algae. Växtekologiska Studier 5, p. 1-100.
LUQUE, ME. and MARTÍNEZ DE FABRICIUS, AL., 2000. Ficoflora fitoplanctónica y epilítica del río Piedra Blanca (Córdoba, Argentina). Boletín Sociedad Argentina Botánica, vol. 35, no. 1-2, p. 21-32.
-, GARI, EN and MARTÍNEZ DE FABRICIUS, AL., 1997. Fitoplancton y Fitobentos de la cuenca superior del río Chocancharava (Ex Cuarto) (Córdoba, Argentina). Revista UNRC, vol. 17, no. 1, p. 49-67.
MARTÍNEZ DE FABRICIUS, AL., MAIDANA, N., GÓMEZ N. and SABATER S., December 2003. Distribution patterns of benthic diatoms in a Pampean river exposed to seasonal floods: the Cuarto River (Argentina). Biodiversity and Conservation, vol. 12, no. 12, p. 2443-2454.
MÜLLER-HAECKEL, A., 1971. Circadiane Periodik der Kolonisationsaktivität driftender Algen. Naturwissenschaften. no. 58, p. 273-274.
-, 1976. Migrationsperiodik einzelliger Algen in Fliessgewässern. Växtekologiska Studier, no. 10, p. 1-36.
ROUND, FE., CRAWFORD, RM. and MANN, DG., 1990. The diatoms. Biology and morphology of the genera. 1st. ed. Cambridge: Cambridge University Press, 747p. ISBN 0-521-36318-7
SILVESTER, NR. and SLEIGH, MA., August 1985. The forces on microorganisms at surfaces in flowing water. Freshwater Biology, vol. 15, no. 4, p. 433-448.
STEEL, RGD. and TORRIE, JH., 1988. Bioestadística: Principios y Procedimientos. México: McGraw-Hill, p. 622. ISBN: 968-451-495-6.
STEINMAN, A. D. and MC INTIRE, C. D. 1986. Effects of current velocity and light energy on the structure of periphyton assemblages in laboratory streams. Journal of Phycology, vol. 22, no. 3, p. 352-361.
STEVENSON, RJ., December 1983. Effects of current and conditions simulating autogenically changing microhabitats on benthic diatom immigration. Ecology, vol. 64, no. 6, p. 1514-1524.
STEVENSON, RJ. and PETERSON, CG., March 1989. Variation in benthic diatom (Bacillariophyceae) immigration with habitat characteristics and cell morphology. Journal of Phycology, vol. 25, no. 1, p. 120-129.
-, October 1991. Emigration and immigration can be important determinants of benthic diatom assemblages in streams. Freshwater Biology, vol. 26, no. 2, p. 279-294.
SWANSON, CD. and BACHMAN, RW. A model of algal exports in some Iowa streams. Ecology, August 1976, vol. 57, no. 5, p. 1076-1080.
TER- BRAAK, CJF. CANOCO- a FORTRAN Program for Canonical Community Ordination. Microconputer Power. (1987-1992). Technical Report: LWA- 88-02, Ithaca, New York, 118p.
VILLAFAÑE, VE. and REID, FMH., 1995. Métodos de microscopía para la cuantificación del fitoplancton. In ALVEAL, K., FERRARIO ME.,OLIVEIRA, EC. and SAR E. Manual de Métodos Ficológicos. 1ª ed., Chile, Concepción: Universidad de Concepción., p. 169-185. ISBN: 956-227-113-7
WALLACE, JB. and MERRITT RW., 1980. Filter-feeding ecology of aquatic insects. Annual Reviews Entomology, vol. 25, p. 103-132.