ABSTRACT: Maize plants can be N-use efficient or N-stress tolerant. The first have high yields in favorable environments but is drastically affected under stress conditions; whereas the second show satisfactory yields in stressful environments but only moderate ones under optimal condi-tions. In this context, our aim was to assess the possibility of selecting tropical maize lines that are simultaneously N-stress tolerant and N-use efficient and check for differences between simultaneous selection statistical methods. Sixty-four tropical maize lines were evaluated for Nitrogen Agronomic Efficiency (NAE) and Low Nitrogen Tolerance (LNTI) response indices and two per se selection indices, Low Nitrogen Agronomic Efficiency (LNAE) and Harmonic Mean of Relative Performance (HMRP). We performed eight selection scenarios: LNAE; HMRP; Additive index; Mulamba-Mock index; and Independent culling levels. The last three was predicted by REML/BLUP single-trait and multi-trait using genotypic values of NAE and LNTI. The REML/BLUP multi-trait analysis was superior to the single-trait analysis due to high unfavorable correlation between NAE and LNTI. However, the accuracy and genotypic determination coefficient of NAE and LNTI were too low. Thus, neither single- nor multi-trait analysis achieved a good result for simultaneous selection nor N-use efficiency nor N-stress tolerance. LNAE obtained satisfactorily accurate values and genotypic determination coefficient, but its performance in selection gain was worse than HMRP, particularly in terms of N-use efficiency. Therefore, because of the su-perior performance in accuracy, genotypic determination coefficient and selection, HMRP was considered the best simultaneous selection methodology of the scenarios tested for N-use ef-ficiency and N-stress tolerance.
Keywords: abiotic stress, correlation between traits, winter maize, mixed models
Accuracy and simultaneous selection gains for N-stress tolerance and N-use
Leandro de Freitas Mendonça1, Ítalo Stefanine Correia Granato1, Filipe Couto Alves1, Pedro Patric Pinho Morais2, Miriam Suzane Vidotti1, Roberto Fritsche-Neto1*
1University of São Paulo/ESALQ − Dept. of Genetics, Av.
Pádua Dias, 11 − 13418-900 − Piracicaba, SP − Brazil.
2Federal University of Viçosa − Dept. of Crop Science, Av.
Peter Henry Rolfs, s/n − 36570-900 − Viçosa, MG − Brazil. *Corresponding author <[email protected]>
Edited by: Leonardo Oliveira Medici
Received August 04, 2016 Accepted November 01, 2016
Introduction
The achievement of high yields in maize demands high levels of investment in N fertilization (Walsh et al., 2012). With this in mind, breeding programs focus on two research areas, N-stress tolerance and N-use efficiency (Maia et al., 2011). Plants that are N-stress tolerant tend to have satisfactory yields despite stressful environments. However, under optimal conditions, the yields are moder-ate or low. On the other hand, N-use efficient plants have high yields in favorable environments but suffer a signifi-cant reduction in yields under conditions of stress (Maia et al., 2011).
We can use plant response indices to evaluate these traits. These are mathematical expressions that meet the performance of materials under both favorable and stress-ful growing conditions. To evaluate N-use efficiency, Cras-well and Godwin (1984) configured the N-agronomic ef-ficiency (NAE) equation and Miti et al. (2010), proposed the low-N tolerance index (LNTI) to evaluate N-stress tol-erance. However, according to Wu et al. (2011), selection based on these indices could present problems. Follow-ing the mathematical formulae, NAE may be selected for plants with low yield under stress conditions and LNTI for plants with low yield under both conditions. It is, there-fore, important to understand the relationship between N-use efficiency and N-stress tolerance. The possibility of
simultaneous gains would provide plants with a high yield under both optimal and stressful conditions. Simultaneous selection for N-use efficiency and N-stress tolerance can be
performed by two strategies: per se selection indices and
simultaneous selection methods.
Per se selection indices are mathematical expressions that take into account the performance of plants under both favorable and stressful conditions. However, the rank-ings lean towards selecting plants with high yields under both conditions. Some examples of these indices are the low-N agronomy efficiency (LNAE), proposed by Wu et al. (2011), and the Harmonic Mean of Relative Performance (HMRP), developed by Resende (2004). The simultaneous selection methods are linear functions that group impor-tant traits and estimate a value to represent the genotype’s performance in two or more traits (Bernardo, 2010). By these methods, it is possible to use the plant response in-dices (NAE and LNTI) as they simultaneously gain traits in N-use efficiency and low-N stress tolerance. From the numerous simultaneous selection methods proposed in the literature, we selected the Additive Index (ADI) (Resende, 2007), the Mulamba and Mock (1978) index (MMI), and the Independent Culling Levels (ICL) (Bernardo, 2010).
Thus, our aim was to verify whether it is possible to simultaneously select tropical maize lines that have N-use efficiency and N-stress tolerance and to identify the best simultaneous selection method for these conditions.
Materials and Methods
Experimental field
We used sixty four (64) tropical maize lines, ob-tained from the germplasm from Viçosa, MG, Brazil, to generate a population with high genetic variability to assess N-use efficiency and N-stress tolerance (Dovale et al., 2013). The population structure analysis revealed three tropical heterotic pools, which have been used worldwide and by Brazilian maize seed companies. More details about pedigree and heterotic groups of these lines were described by Lanes et al. (2014). It was decided to use lines due to the predominance of the additive effects of N-stress tolerance and N-use efficiency (Dovale et al., 2012).
The lines were cultivated on two fields, side by side, one with high-N availability (HN) and the other with low-N availability (LN). An 8 × 8 lattice with two repetitions was planted in each field. This experiment was repeated three times, as follows: in Anhembi, SP, Brazil (22°50’51” S, 48°01’06” W, 466 m) sown in the winter seasons of 2014 and 2015; and in Piracicaba, SP, Brazil (22°42’23” S, 47°38’14” W, 535 m) sown in the winter season of 2015. Each combination of locale and year was considered a site; thus, there were three sites to be evaluated.
The experimental units consisted of a five-meter line with 0.80 meters between lines and 0.20 meters between plants. Fertilization was administered
compris-ing 300 kg ha−1 of NPK 4-14-8. The 50 % reduction in
maize yield due to N effects was used to determine the amount of N to be used in HN and LN fields (Dovale et
al., 2011). Consequently, 35 kg ha−1 of N and 125 kg ha−1
of N were used in the LN and HN fields, respectively. In
both fields, 12 kg ha−1 of N was applied at sowing, and
the remaining N were split into two sections, one at 30 days (V6) and the other at 50 days (VT) after sowing.
Traits evaluated
From each experimental unit, the grain yield (GY),
in kg ha−1, and grain moisture (%) were collected. Using
these data, the GY was corrected by 13 % of the grain moisture. After correction of the GY of each line in each N-availability field we estimated the plant response
in-dices (NAE and LNTI) and the per se selection indices
(LNAE and HMRP). For this step in the experimental design, the two lattices were merged into one lattice be-cause the GY in both the LN and HN availability fields were used to estimate the indices.
Plant response indices
To assess the N-use efficiency, the Nitrogen Agro-nomic Efficiency (NAE) equation described by Craswell and Godwin (1984), was used as follows:
NAE GY GY
N N ij HN LN HN LN ij ij = − − ( ) ( ) ( ) ( )
where NAEij is the Nitrogen Agronomic Efficiency of
line i in repetition j; GY(HN)ij the grain yield in the HN field (phenotypic value) of line i in repetition j; GY(LN)ij
the grain yield in the LN field (phenotypic value) of line
i in repetition j; N(HN) the amount of nitrogen applied in
the HN field; and N(LN) the amount of nitrogen applied in
the LN field.
In addition, to evaluate N-stress tolerance, the Low-N tolerance index (LNTI), described by Miti et al. (2010), was used as follows:
LNTI GY GY ij LN HN ij ij = − ⋅
1 ( ) 100
( )
where LNTIij is the Low-N tolerance index of line i in
repetition j; GY(HN)ij the grain yield in the HN field (phe-notypic value) of line i in repetition j; and GY(LN)ij the
grain yield in the LN field (phenotypic value) of line i in
repetition j.
Per se selection indices
The per se selection indices do not prioritize ef-ficiency or tolerance due to their mathematical arrange-ment, but they do provide a balance between these traits. One of these is the Low-N agronomic efficiency (LNAE), introduced by Wu et al. (2011), as follows:
LNAE GY GY GY ij LN HN LN ij ij ij = ⋅ ( ) ( ) ( )
where LNAEijis the Low-N agronomic efficiency of line
i in repetition j; GY(HN)ij the grain yield in the HN field (phenotypic value) of line i in repetition j; and GY(LN)ij the
grain yield in the LN field (phenotypic value) of line i in
repetition j.
Another estimated per se selection index was the
Harmony Mean of Relative Performance (HMRP), pro-posed by Resende (2004), as follows:
HMRP GY X GY X ij HN HN LN LN ij ij = + − − 2 1 1 ( ) ( ) ( ) ( )
where HMRPij is the a Harmony Mean of Relative
Per-formance of line i on repetition j; GY(HN)ij the grain yield in the HN field (phenotypic value) of line i in repetition j;
GY(LN)ij the grain yield in the LN field (phenotypic value) of line i in repetition j;X(HN) the mean yield of the HN
field; andX(LN) the mean yield of the LN field.
Deviance analysis and prediction of genotypic values
After obtaining the values of the plant response
indices and per se selection indices for each repetition of
Predictor (REML/BLUP) single-trait (univariate) analy-sis, as follows:
y = Xr + Zg + Wb + Ti + ε
where y is the vector of the plant response indices (NAE and
LNTI) and the per se selection indices (LNAE and HMRP);
r the site and repetition within site effect vector plus the
mean, considered fixed and r ~ N (r,Φr); g the line effect
vector and was considered random where g ~ N (0, G); b the
vector of the block within repetition effect and was
consid-ered random where b ~ N (0,σ2b); i the line × site
interac-tion effect vector and was considered random i ~ N (0, σ2i);
Ɛ the experimental error where Ɛ~ N (0, R). X, Z, W and
T are incidence matrices that relate the independent vector effects from each matrix to the dependent y vector. Thus, for the single-trait model, the following equation was used:
R=I(n1) e
2
σ ; G1 In2 g
2
= ( )σ ; G2 In3 b
2
= ( )σ ; G3 In4 i
2
= ( )σ
where I is the incidence matrix with the dimension n1
(repetition × site × line), n2(line), n3(block × repetition × site)and n4(line × site); and σe
2, σ
g
2, σ
b
2 and σ
i
2
are the residual, genetic, block and line × site interaction variance components, respectively.
Due to an unfortunate genotypic correlation be-tween N-use efficiency and N-stress tolerance (Maia et al., 2011), the genotypic values of NAE and LNTI were also predicted by REML/BLUP multi-trait (multivariate), in which the genotypic values are corrected by the cova-riance between the traits (Henderson and Quaas, 1976). The equation is as follows:
R = I(n1) ⊗ Cove; G1 = I(n2) ⊗ Covg; G2 = I(n3) ⊗ Covb;
G3 = I(n4) ⊗ Covi
where I is the incidence matrix with the dimensions n1
(repetition × site × line), n2 (line), n3 (block ×
repeti-tion × site) and n4(line × site); Cove, Covg, Covband Covi
are the residual, genetic, block and line × site interac-tion variance-covariance matrixes, respectively, between NAE and LNTI; and ⊗ indicates the Kronecker product. All of the analyses were done by ASReml-R® (Gilm-our et al., 2009) using the R software (version 3.3.1).
Scenarios of simultaneous selection
After obtaining the genotypic values of the plant
response indices and per se selection indices, we applied
the scenarios of simultaneous selection. The primary
difference between the per se selection indices and the
plant response indices is that the first rankings based on the genotypic values must lead to a simultaneous selec-tion for efficiency and tolerance. On the other hand, to obtain a simultaneous selection for efficiency and toler-ance using plant response indices, the genotypic values cannot be directly used, and the genotypic values of both indices (NAE end LNTI) are needed for composing the simultaneous selection methods (ADI, MMI and ICL).
This way, for per se selection indices, the
follow-ing scenarios were analyzed: LNAE, which accordfollow-ing to Wu et al. (2011), promotes the selection of plants with satisfactory performance under optimal and stressful growing conditions, and HMRP, which selects produc-tive and stable plants over a range of N-availability fields (Resende, 2004). In addition, to compose the scenarios of simultaneous selection using the plant response indices (NAE and LNTI), a factorial (3 × 2) with three simulta-neous selection methods (ADI, MMI and ICL) and two prediction methods of genotypic values (REML/BLUP single-trait and multi-trait) was generated. These three simultaneous selection methods were chosen to repre-sent three distinct ways to gather the traits. The equa-tions for these methods were:
ADIi = b1X1i+b2 X2i
where ADIiis the value of the additive index to line i; b1
the weight for NAE (0.5); b2 the weight for LNTI (0.5);
X1i the standardized genotypic value of NAE to line i;
and X2i the standardized genotypic value of LNTI to line
i; and:
MMIi P P
i i
= 1 + 2
2
where MMIiis the value of the Mulamba-Mock index to
line i; P1i the positon of line i on NAE's rank; and P2i the
positon of line i on LNTI's rank.
Selection by independent culling levels (ICL) as-signed each axis of a graph with NAE and LNTI geno-typic values. Then, lines were plotted according to their genotypic values on each trait, and the lines that have both favorable values were selected (Bernardo, 2010).
Therefore, the total number of scenarios of
simul-taneous selection were eight: two by per se selection
in-dices (LNAE and HMRP) and six by simultaneous selec-tion methods using NAE and LNTI values (ADI, MMI and ICL, single-trait and multi-trait).
Comparison of the scenarios of simultaneous selection
We simulated 10 % selection intensity in all of the scenarios. The comparisons were based on the
expect-ed selection gains (SG %), accuracy (rˆ) and genotypic
determination coefficient (h2). Accuracy, according to
Resende and Duarte (2007), is the most appropriate criterion for assessing predictive quality because the accuracy takes into account the genetic and residual coefficients of variation and the number of repetitions. The average of all of the sites was used to obtain the following estimations:
SG
GV
n
x ij i n
j
(%)=
×
∑
where SG(%) is the expected selection gain in percent-age; GVij the genotypic value of selected line i to trait j; n
the number of lines selected; and xjthe mean of trait j;
ˆ
.
r
b CVg
CVe
= −
+
1 1
1
2 1
2
where ȓ is the accuracy; b the number of repetitions;
CVg the genetic coefficient of variation; and CVe the
re-sidual coefficient of variation;
h
s r s
g
g
i e
2
2
2 2 2
=
+
σ
σ σ σ
.
where h2 is the genotypic determination coefficient;
σg
2,σ
i
2,σ
e
2, are genetic, interaction line × site and
re-sidual variance, respectively; s is the number of sites;
and r the number of repetition on each site.
Results
ANADEV and the parameters of per se selection in-dices and plant response inin-dices
According to ANADEV, the line effect was signifi-cant for LNAE, HMRP and LNTI (Table 1), indicating ge-netic variability among lines for these indices. Only the
per se selection indices showed significance for line × site interaction. For these, the ANADEV was performed for each site, and the line effect was significant in two of the three sites for LNAE and in all of the sites for HMRP (data not shown).
The line × site interaction was significant by the
per se selection indices, but the average of all of the sites was used to obtain the expected selection gains. This study was conducted at different sites to identify materi-als with high yields that are stable across sites, and not just specific selections at each site.
HMRP achieved the highest genotypic determina-tion coefficient, accuracy and the lowest coefficient of variation. For NAE and LNTI, multi-trait analysis yielded
superior accuracy and genotypic determination coeffi-cient compared with single-trait analysis. However, the values were much lower than LNAE and HMRP (Table 2).
Expected selection gains
Both of the per se selection indices, LNAE and
HMRP, achieved good direct expected selection gains. Likewise, LNTI found good direct expected selection gains in both analyses, but multi-trait was superior (Table 3). There was no selection gain found for NAE because of the absence of genetic variability that was previously shown (Table 1).
Table 1 – Wald test of fixed effects and the likelihood-ratio test (LRT) of random effects for per se selection indices Low Nitrogen Agronomic Efficiency (LNAE) and Harmonic Mean of Relative Performance (HMRP) and plant response indices Nitrogen Agronomic Efficiency (NAE) and Low Nitrogen Tolerance index (LNTI).
Variation factor LNAE HMRP NAE LNTI
Fixed effects
Site 60.99** 0.680ns 9.98** 3.96ns
Repetition/Site 1.58ns 9.20* 5.57ns 0.59ns
Random effects
Block/Repetition 0.06 ns 4.10* 0.10ns 0.01ns
Line 27.61** 62.38** 0.26ns 5.48*
Line × Site 5.07* 17.47** 0.10ns 3.82ns
ns = not significant p > 0.05; *p < 0.05 by LRT or F Wald; **p < 0.01 by LRT or Wald test.
Table 2 –Parameters of Low Nitrogen Agronomic Efficiency (LNAE), Harmonic Mean of Relative Performance (HMRP), Nitrogen Agronomic Efficiency (NAE) and Low Nitrogen Tolerance index (LNTI).
Parameters Single-trait Multi-trait
LNAE HMRP NAE LNTI NAE LNTI
Mean (x) 1568.89 1.01 7.39 0.26 7.41 0.26
Coe. Var. (CV %) 41.38 19.94 82.68 59.89 84.61 64.18 Genotypic det. coe. (h2) 0.61 0.73 0.09 0.06 0.15 0.26
Accuracy (ˆr) 0.72 0.89 0.19 0.19 0.24 0.32
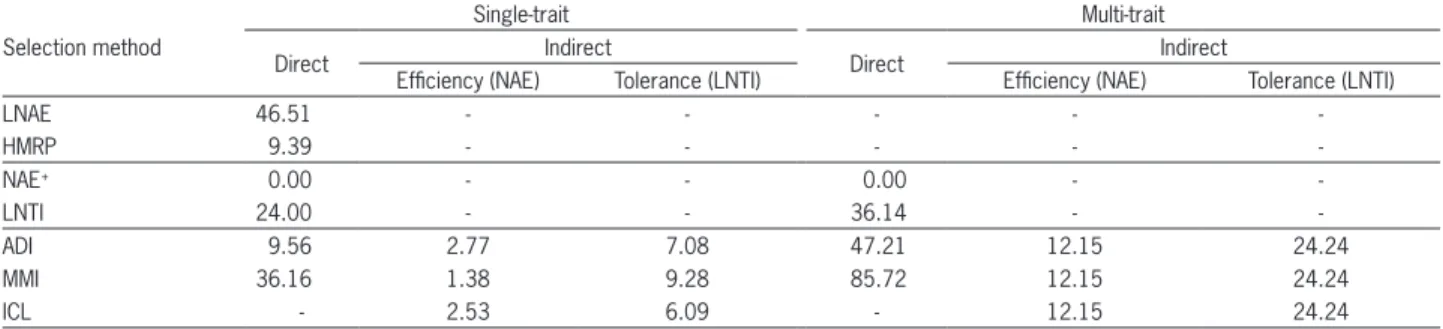
Table 3 – Expected selection gains (%) based on Low Nitrogen Agronomic Efficiency (LNAE), Harmonic Mean of Relative Performance (HMRP), Nitrogen Agronomic Efficiency (NAE) and Low Nitrogen Tolerance index (LNTI) and direct and indirect expected selection gains (%) for Additive index (ADI), Mulamba-Mock index (MMI) and Independent Culling Levels (ICL).
Selection method
Single-trait Multi-trait
Direct Indirect Direct Indirect
Efficiency (NAE) Tolerance (LNTI) Efficiency (NAE) Tolerance (LNTI)
LNAE 46.51 - - - -
-HMRP 9.39 - - - -
-NAE+ 0.00 - - 0.00 -
-LNTI 24.00 - - 36.14 -
-ADI 9.56 2.77 7.08 47.21 12.15 24.24
MMI 36.16 1.38 9.28 85.72 12.15 24.24
ICL - 2.53 6.09 - 12.15 24.24
The three simultaneous selection methods (ADI, MMI and ICL) composed of NAE and LNTI values were used to estimate both direct and indirect expected selec-tion gains. These gains were always higher in multi-trait analysis compared with single-trait analysis. Moreover, in multi-trait analysis, the indirect gains were equal among ADI, MMI and ICL (Table 3), probably because all these simultaneous selection methods selected the same lines.
Despite the performance of NAE and LNTI, our aim was simultaneous selection for N-use efficiency and N-stress tolerance. Towards this goal, the primary
com-parison was between the per se selection indices (LNAE
and HMRP) and the simultaneous selection methods (ADI, MMI and ICL).
Discussion
Performance of per se selection indices
Both per se selection indices performed well in
accuracy and expected selection gains. The accuracy, genotypic determination coefficient and coefficient of variation values were more favorable in HMRP. On the other hand, LNAE obtained a higher expected selection gain (Table 3). However, this gain should be cautiously analyzed because high values of selec-tion gain for this index may not represent the gain in HN and LN yields. Thus, the yield in HN and LN of the selected lines by each index is more important than the expected selection gain values to determine which index is more efficient for simultaneous selec-tion.
In situations in which a trait has unexploited genetic variability, there is no selection gain. In this context, the HMRP values obtained in all of the sites showed a more stable expression of genetic variability. In addition, this index was less sensitive to environ-mental effects based on the genotypic determination coefficient and coefficient of variation, which contrib-uted to more accurate selection (Table 2). The HMRP also showed a strong line × site interaction, which was not observed in LNAE. This interaction explains the low mean gain selection of HMRP compared with LNAE (Table 3).
According to Wu et al. (2011), the main charac-teristic of LNAE is the selection of materials that can maintain high productivity under stressful conditions. On the other hand, Resende (2004) argued that HMRP leads to simultaneous selection for stability and adapt-ability; in other words, plants that maintain their pro-ductivity under optimal and stressful conditions are se-lected. Conceptually, the selection by these two indices is similar and should lead to a high coincidence selec-tion between LNAE and HMRP; however, this similar-ity was not verified. The coincidence in selection was only 57 %. Thus, even with similar proposals, there is a clear difference between selection by HMRP and by LNAE.
Performance of plant response indices (single-trait and multi-trait)
Plants that are N-stress tolerant have low LNTI values and plants that are N-use efficient have high NAE values (Craswell and Godwin, 1984; Miti et al., 2010). A positive correlation between NAE and LNTI is problematic for simultaneous selection because a line with high NAE likely hashigh LNTI or is efficient but not tolerant.
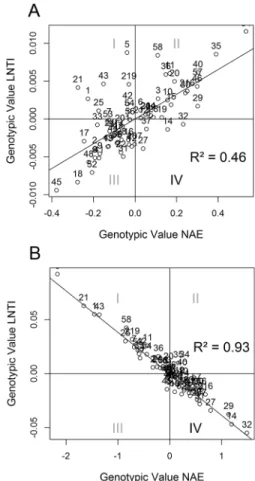
This problem was confirmed when we found a genotypic correlation of 0.69 between NAE and LNTI. This value confirms the results presented by Maia et al. (2011), which stated that N-use efficiency and N-stress tolerance are inversely proportional traits. Thus, stress tolerant plants tend to be N-use inefficient and vice versa. This way, the selection by single-trait analysis is impaired because it is difficult to find genotypes with favorable values of NAE and LNTI simultaneously. This difficulty is represented by the single-trait graph (Figure 1A), where there are only a few lines within quadrant IV (high NAE and low LNTI).
On the other hand, NAE and LNTI predicted by multi-trait analysis achieved a -0.96 Pearson correlation.
This means that using covariance to adjust the genotypic values of the traits changed these values. Therefore, we were able to identify more lines with high NAE and low LNTI (quadrant IV). Comparing both graphs (Figure 1A and B), the impact of the genotypic values in each pre-diction method can be found.
The superiority of multi-trait predictions was also observed in the accuracy and genotypic determi-nation coefficient values that are higher in multi-trait analysis (Table 2). Consequently, the expected selec-tion gains were higher using multi-trait analysis (Table 3). The significant changes in the genotypic values of the lines not only increased the expected selection gains but also were responsible for selection coinci-dence between ADI, MMI and ICL (Table 4). This in-dicates the strong capacity of multi-trait analysis in demonstrating which materials need to be selected, regardless of the method.
The criteria between single-trait and multi-trait analyses were presented by Bauer and Leon (2008). Ac-cording to these authors, inversely correlated traits pres-ent higher simultaneous selection gains using multi-trait analysis. The selection using single-trait analysis for these traits could result in gains in one trait and losses in the other trait. In addition, Viana et al. (2010) simul-taneously selected for yield and expansion volume in popcorn and noted that in cases of traits with similar ge-notypic determination coefficient, the decision between single-trait and multi-trait analysis is the absolute differ-ence between genetic and residual correlations. If both correlations are similar, there is no difference between these prediction methods.
Thus, NAE and LNTI meet the requirements that lead to greater accuracy and expected selection gains by multi-trait analysis. The correlation is unfavorable and strong (Pearson correlation of 0.69), and although the
ge-notypic determination coefficient is lower, it is similar (Table 2). In addition, the genetic and residual correla-tions are 0.41 and 0.61, respectively, which indicates a considerable difference between them.
Differential selection between the scenarios
Despite the fact that multi-trait prediction was better than single-trait prediction, the performance of
multi-trait analysis was lower compared with per se
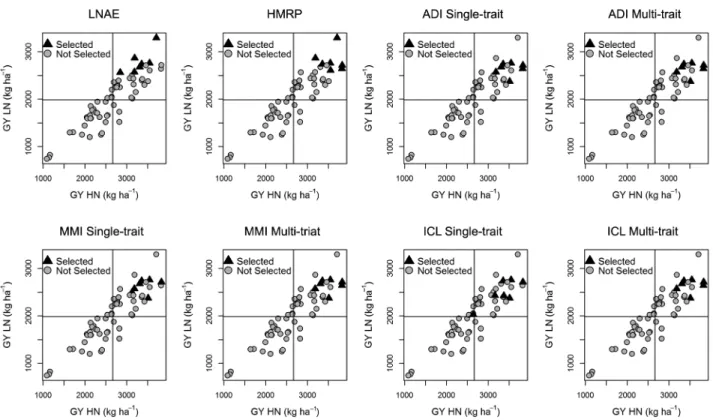
se-lection indices. This was due to the lower accuracy and genotypic determination coefficient of NAE and LNTI and the high coefficient of variation (Table 2). In fact, accuracy and the genotypic determination coefficient increased using multi-trait analysis, which corroborated the published literature, but the values were so low that this increase did not provide active values near LNAE and HMRP levels (Table 2). Thus, the low success level of simultaneous selection methods was caused by the low performance of NAE and LNTI. These plant re-sponse indices are not accurate and cannot select the higher yield lines in HN and LN as these lines were not selected by ADI, MMI and ICL (Figure 2).
The better performances of the per se selection
in-dices were confirmed by checking the materials select-ed by each index (Figure 2) and the expectselect-ed selection gains for each N-availability (Table 5). The productive lines were prioritized in HN and LN. However, there were verified differences between LNAE and HMRP. Although LNAE selected productive materials under both N-availability scenarios, there was a tendency to select lines with higher productivity in low-N. In the case of HMRP, the selection appeared more balanced, and the best lines were selected. Thus, HMRP showed the highest expected selection gain in HN and LN (Ta-ble 5).
In their article, Wu et al. (2011) developed LNAE as the LN yield divided by the HN yield and multiplied by the LN yield. In Figure 2, we noted that this mul-tiplication by LN yield leads to a selection of materi-als with great performance in LN, instead of yielding materials under both conditions. The greater balance presented by HMRP better suits the aim of this study.
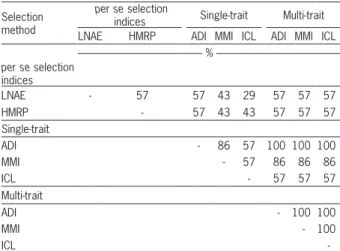
Table 4 – Selection coincidence among the scenarios of simultaneous selection.
Selection method
per se selection
indices Single-trait Multi-trait
LNAE HMRP ADI MMI ICL ADI MMI ICL
--- % --- per se selection
indices
LNAE - 57 57 43 29 57 57 57
HMRP - 57 43 43 57 57 57
Single-trait
ADI - 86 57 100 100 100
MMI - 57 86 86 86
ICL - 57 57 57
Multi-trait
ADI - 100 100
MMI - 100
ICL
-LNAE = Low Nitrogen Agronomic Efficiency; HMRP = Harmonic Mean of Relative Performance; ADI = Additive index; MMI = Mulamba-Mock index; ICL = Independent Culling Levels.
Table 5 – Expected selection gains (SG %) to grain yield (GY) in high nitrogen (HN) and low nitrogen (LN).
Selection method SG (%) HN SG (%) LN
LNAE 24.01 39.94
HMRP 34.01 41.04
ADI (single-trait) 31.64 32.84
MMI (single-trait) 27.89 31.80
ICL (single-trait) 25.49 25.63
ADI (multi-trait) 31.64 32.84
MMI (multi-trait) 31.64 32.84
ICL (multi-trait) 31.64 32.84
Furthermore, HMRP surpassed LNAE in LN condi-tions, which seemed to be the strong point of selection by LNAE (Table 5).
Several articles reinforce the capacity of HMRP to select productive and stable genotypes. For example Carbonell et al. (2007) showed this in the common bean, Borges et al. (2010) examined this in rice, and Oliveira et al. (2005) analyzed this in sugarcane. Another advantage of HMRP is the possibility of considering more than two N-availability scenarios, making it possible to evaluate stress gradients (Resende, 2004).
These results and the aforementioned superior performance in accuracy and genotypic determination coefficient allow us to conclude that simultaneous selec-tion of tropical maize lines for N-stress tolerance and N-use efficiency is possible. We also conclude that un-der the scenarios analyzed, HMRP is the most suitable method among the tested methods.
Acknowledgments
We thank the São Paulo State Foundation for Re-search Support (FAPESP) (Process FAPESP n°2014/23635-4), the Coordination for the Improvement of Higher Lev-el PersonnLev-el (CAPES) and the Brazilian National Council for Scientific and Technological Development (CNPq) for their financial support.
Figure 2 – Lines selected by each simultaneous selection scenario; LNAE = Low Nitrogen Agronomic Efficiency; HMRP = Harmonic Mean of Relative Performance; ADI = Additive index; MMI = Mulamba-Mock index; ICL = Independent Culling Levels.
References
Bauer, A.M.; Leon, J. 2008. Multiple-trait breeding values for parental selection in self-pollinating crops. Theoretical and Applied Genetics 116: 235-242.
Bernardo, R. 2010. Selection for multiple traits. p. 323-336. In: Bernardo, R., ed. Breeding for quantitative traits in plants. Stemma Press, Woodbury, MN, USA.
Borges, V.; Soares, A.A.; Reis, M.S.; Resende, M.D.V.; Cornélio, V.M.O.; Leite, N.A.; Vieira, A.R. 2010. Genotypic perfomance of lines of the upland rice using mixed model. Bragantia 69: 833-841 (in Portuguese, with abstract in English).
Carbonell, S.A.M.; Chioratoi, A.F.; Resende, M.D.V.; Dias, L.A.S.; Beraldo, A.L.A.; Perinai, E.F. 2007. Stability of common bean cultivars and lines in different environments in the state of São Paulo. Bragantia 66: 193-201 (in Portuguese, with abstract in English).
Craswell, E.T.; Godwin, D.C. 1984. The efficiency of nitrogen fertilizers applied to cereals grown in different climates. p. 1-55. In: Tinker, P.B.; Lauchli, A., eds. Advances in plant nutrition. Praeger Publishers, New York, NY, USA.
Dovale, J.C.; Fritsche-Neto, R.; Bermudez, F.; Miranda, G.V. 2012. Genetic effects of traits associated to nitrogen use efficiency in maize. Pesquisa Agropecuária Brasileira 47: 385-392 (in Portuguese, with abstract in English).
Dovale, J.C.; Maia, C.; Fritsche-Neto, R.; Miranda, G.V.; Cavatte, P.C. 2013. Genetic responses of traits relationship to components of nitrogen and phosphorus use efficiency in maize. Acta Scientiarum-Agronomy 35: 31-38.
Gilmour, A.R.; Gogel, B.J.; Cullis, B.R.; Thompson, R.; Butler, D. 2009. ASReml user guide release 3.0. VSN International, Hemel Hempstead, UK.
Henderson, C.R.; Quaas, R.L. 1976. Multiple trait evaluation using relatives records. Journal of Animal Science 43: 1188-1197.
Lanes, E.C.M.; Viana, J.M.S.; Paes, G.P.; Paula, M.F.B.; Maia, C.; Caixeta, E.T.; Miranda, G.V. 2014. Population structure and genetic diversity of maize inbreds derived from tropical hybrids. Genetics and Molecular Research 13: 7365-7376. Maia, C.; Dovale, J.C.; Fritsche-Neto, R.; Cavatte, P.C.; Miranda,
G.V. 2011. The difference between breeding for nutrient use efficiency and for nutrient stress tolerance. Crop Breeding and Applied Biotechnology 11: 270-275.
Miti, F.; Tongoona, P.; Derera, J. 2010. S1 selection of local maize landraces for low soil nitrogen tolerance in Zambia. African Journal of Plant Science 4: 67-81.
Mulamba, N.N.; Mock, J.J. 1978. Improvement of yield potential of ETO blanco maize (Zea Mays L.) population by breeding for plant traits. Egyptian Journal of Genetics and Cytology 7: 40-57.
Oliveira, R.A.; Resende, M.D.V.; Daros, E.; Bespalhok Filho, J.C.; Zambon, J.L.C.; Ido O.T.; Weber, H.; Koehler, H.S. 2005. Genotypic evaluation and selection of sugarcane clones in three environments in the state of Paraná. Crop Breeding and Applied Biotechnology 5: 426-434.
Resende, M.D.V. 2004. Optimum statistical methods in the analysis of field experiments = Métodos estatísticos ótimos na análise de experimentos de campo. Embrapa Florestas, Colombo, PR, Brazil (in Portuguese).
Resende, M.D.V. 2007. Selegen-reml/blup: statistical system and computerized genetic selection by linear mixed models = Selegen-reml/blup: sistema estatístico e seleção genética computadorizada via modelos lineares mistos. Embrapa Florestas, Colombo, PR, Brazil (in Portuguese).
Resende, M.D.V.; Duarte, J.B. 2007. Precision and quality control in variety trials. Pesquisa Agropecuária Tropical 37: 182-194 (in Portuguese, with abstract in English).
Viana, J.M.S.; Sobreira, F.M.; Resende, M.D.V.; Faria, V.R. 2010. Multi-trait BLUP in half-sib selection of annual crops. Plant Breeding 129: 599-604.
Walsh, O.; Raun, W.; Klatt, A.; Solie, J. 2012. Effect of delayed nitrogen fertilization on maize (Zea Mays L.) grain yields and nitrogen use efficiency. Journal of Plant Nutrition 35: 538-555. Wu, Y.S.; Liu, W.G.; Li, X.H.; Li, M.S.; Zhang, D.G.; Hao, Z.F.;