ABSTRACT: High yield stability and adaptability of yellow passion fruit varieties (Passifl ora edulis
Sims. f. fl avicarpa Deg.) are highly desirable attributes when exploring different environments. This study aimed to evaluate the adaptability and yield stability of yellow passion fruit varieties using AMMI (additive main effects and multiplicative interaction) and other ancillary statistics. Twelve varieties were evaluated in eight environments. Analysis of variance showed effects at-tributable to the varieties (G), environment (E) and their interaction (G×E). The fi rst two multipli-cative components of the interaction accounted for 69% of the sum of squares. The scores of the principal interaction components showed high variability for the environments relative to the variety effects. High varietal phenotypic stability was observed in three environments; which can be used in yellow passion fruit breeding programs for initial selection trials. A biplot-AMMI analy-sis and yield stability index incorporating the AMMI stability value and yield capacity in a single non-parametric index were useful for discriminating genotypes with superior and stable fruit yield. AMMI analysis also allowed for the identifi cation of more productive varieties in specifi c environments, leading to signifi cant increase in passion fruit productivity.
Introduction
The yellow passion fruit (Passifl ora edulis Sims. f. fl avicarpa Deg.) is currently grown in almost all regions in Brazil, and accounts for 95 % of the area where this crop is grown. Yellow passion fruit is cultivated under different environmental conditions in Brazil due in part to crop expansion, but primarily to the itinerant aspects that characterize the crop, especially in relation to sev-eral pests and diseases. However, there are few studies in the literature on passion fruit production yield and stability in different regions.
Yellow passion fruit yield is dependent on genetic and environmental factors, in which the interaction be-tween the genotype and environment (G×E) reduces the association between genotypic and phenotypic compo-nents. For a long time, G×E interaction has been the pri-mary theme in plant breeding because it assists breeders in one of the most critical steps in this process, which is the determination of which varieties should be rec-ommended. Several statistical methods have been devel-oped to characterize and minimize the effect of the G×E interaction in selected varieties and to predict phenotyp-ic responses to environmental changes. However, most statistical stability methods are not able to provide an ac-curate and complete variety response pattern for this in-teraction (Holhs, 1995), especially because the genotype response to environmental variation is multivariate (Lin et al., 1986) and most stability indices have a univariate response (Crossa, 1990).
Analysis of variance (ANOVA) is merely an addi-tive model in which the G×E interaction is a source of variation, but its intrinsic effects are not analyzed. In contrast, principal component analysis (PCA) is a multi-plicative model and, therefore, does not present additive main effects for the environment nor genotype. How-ever, the newly developed AMMI (addi tive main effects
and multiplicative interaction) analysis includes ANOVA and PCA in a unifi ed approach that can be used to ana-lyze multiple yield trials (Zobel et al., 1988; Crossa et al., 1990; Gauch and Zobel, 1996). AMMI uses ANOVA to test the main effects of genotypes and environments, and PCA to analyze the residual multiplicative interac-tion between genotypes and environments to determine the sum of squares of the G×E interaction, with a mini-mum number of degrees of freedom. Because ANOVA and PCA are part of the AMMI model, this model is like-ly more suitable for characterizing the G×E interaction (Zobel et al., 1988).
This study aimed to estimate the adaptability and yield stability of yellow passion fruit varieties using AMMI analysis and auxiliary non-parametric statistics to select varieties that have both high performance and phenotypic stability in reducing the G×E interaction ef-fects and make the selection of varieties more refi ned and precise.
Materials and Methods
Yield trials
The experiments were carried out in eight agro-nomic production areas in the State of Bahia, Brazil (Ta-ble 1). Planting was completed in 2009/2010 during the rainy season for each region. The spacing was 2.6 m be-tween rows and 3.7 m bebe-tween plants. A vertical system for the canopy was used, with a single strand of galnized wire (14 gauge) 2 m above the ground. Twelve va-rieties of yellow passion fruit from the breeding program at Embrapa Cassava and Fruits, were evaluated.
Experimental design
Experiments were carried out in a randomized block design with three replicates and ten plants per plot, following all recommended cultivation practices Received July 16, 2013
Accepted October 26, 2013
1Embrapa Cassava & Fruits, R. Embrapa, s/n, C.P. 007 − 44380-000 − Cruz das Almas, BA – Brazil.
2Federal University of Bahia Reconcavo, R. Rui Barbosa, 710 − 44380-000 − Cruz das Almas, BA – Brazil.
*Corresponding author <eder.oliveira@embrapa.br>
Edited by: Leonardo Oliveira Medici
AMMI analysis of the adaptability and yield stability of yellow passion fruit varieties
for passion fruit. The fruit yield data per plot were ac-quired over the fi rst year of production (between 7 and 20 months after planting).
AMMI analysis
An initial analysis of variance was performed for each environment to verify the existence of differences between varieties. After these analyses, the homogeneity between residual variances was determined, and a joint analysis of variance was used to test the genotype and environment effects and the magnitude of the G×E in-teraction. AMMI analysis was used to adjust the main or additive genotype and environmental effects by analysis of variance, in addition to the adjustment of the mul-tiplicative effects for the G×E interaction by principal component analysis. The AMMI model was as follows:
,
where Yij is the fruit yield of the ith
variety in the jth en-vironment, µ is the overall mean, gi and ej are the fi xed varietal effects and environmental deviations, respec-tively, lk is a singular value of the K axis in the principal component analysis, gik and djk are genotype and envi-ronmental factors, respectively, of the singular vectors associated with lk from the interaction matrix, N is the number of principal components retained in the model, rij is the residual G×E interaction, and eij is the average independently assumed error eij N(0, s2).
The sum of squares of the G×E interaction was divided into an n singular axis or Interaction Principal Component Axis (IPCA), which refl ects the standard portion in which each axis corresponded to a particu-lar AMMI model. The selection of a model that best de-scribes the G×E interaction was based on the FR test as proposed by Cornelius et al. (1992).
Once the AMMI model had been selected, we in-vestigated the adaptability and phenotypic stability us-ing biplot graphs. Biplot graph interpretation is based on the variation of the additive main effects (genotype and
environment) and the multiplier effect of the G×E inter-action. The abscissa represents the main effects (average of varieties evaluated), and the ordinate the interaction among the axes (IPCA). In this case, the lower the IPCA value (absolute value) the lower the contribution of the G×E interaction and the greater the genotype stability. An ideal genotype is one with a high yield and IPCA values close to zero. An undesirable genotype is one with low stability, which is associated with low yields. The average predictions were estimated according to the AMMI model selected. All statistical analyses were per-formed using the AMMI procedure in R (R Development Core Team, version 3.0.1).
AMMI stability value (ASV)
The AMMI stability value was calculated as previ-ously described by Purchase et al. (2000):
,
where is the weight derived from dividing the
sum of IPCA1 squares by the sum of IPCA2 squares. The larger the absolute value of IPCA, the greater the adapt-ability of a specifi c variety for a certain environment. Conversely, lower ASV values indicate greater stability in different environments.
Sustainability Index (SuI)
The sustainability index was calculated as previ-ously described by Babarmanzoor et al. (2009):
,
where Y is the average performance of a specifi c vari-ety, sn the standard deviation and YM the value of the best genotype in any environment. The sustainability
Table 1 − Classifi cation of study environments for the agronomic evaluation of yellow passion fruit varieties in the State of Bahia, Brazil.
Environment City Geographic coordinate (Latitude/ Longitude)
Soil classifi cation
(FAO, 1994) Climate conditions Altitude (m) CPa Cabaçeiras do Paraguaçú 12º32' S / 39º11' W Orthic Ferralsols Semi-arid 210
DBa Dom Basílio 13°46' S / 41°47' W Acric Ferralsols Tropical climate with a dry season 462
Ibi Ibicoara 13°24' S / 41°16' W Xantic Ferralsols High-altitude tropical
climate 1027
LNS-RA Livramento de Nossa
Sen-hora – Rio Acima 13°38'S / 41°50' W Acric Ferralsols Semi-arid 500
LNS-Mo Livramento de Nossa Sen-hora – Monte Oliveira 13°38' S / 41°50' W Ferric Acrisols Semi-arid 500
MSo Marcionílio Souza 13°00' S / 40°31' W Acric Ferralsols Tropical climate with a dry season 299
index values were arbitrarily divided into three stability groups as follows: low (up to 35 %), medium (36 to 70 %) and high (71 to 100 %).
Stability index (StI)
The stability index from the non-parametric stabil-ity analysis by Rao et al. (2004) was calculated as fol-lows:
,
where is the average yield of the ith variety, .. y the overall mean, the variance in the ith stability variety (Shukla, 1972), and n the number of environments.
Yield stability index (YSI)
The yield stability index was calculated using the following formula: YSI = RASV + R , where RASV is the ranking of the AMMI stability valueand RP the ranking of yellow passion fruit yields in all environments.
Results and Discussion
Analysis of fruit yields in different environments The joint analysis of variance showed differences (p < 0.01) for environments (E), genotypes (G) and the G×E interaction (Table 2). The experimental coeffi cient of variation for the joint analysis was low (16%), indi-cating good experimental precision. A signifi cant effect of the G×E interaction demonstrates the differential performance of genotypes in different environments. Therefore, this change in the average yield of yellow pas-sion fruit varieties as a consequence of the environment justifi es the need for a more refi ned analysis to increase selection effi ciency and varietal recommendations.
An alternative strategy for reducing the G×E in-teraction involves a genotype selection with greater
sta-bility within a wide range of environments, which facili-tates the prediction of their behavior. Therefore, AMMI analysis is an important tool for increasing our knowl-edge of the factors involved in the G×E interaction.
AMMI analysis of the G×E interaction
The AMMI method is widely used in stability and adaptability analyses because it i) provides an initial di-agnosis of the model and is well-suited for data analysis with many environmental infl uences, ii) allows greater unfolding of the G×E interaction and summarizes the patterns and relationships between genotypes and en-vironments, and iii) improves the accuracy of trait es-timates (Gauch, 1988; Zobel et al., 1988; Crossa et al., 1990).
An AMMI analysis of yellow passion fruit yield in eight production environments in the State of Bahia showed that 61% of the sum of squares was explained by the environment, and 5% and 34% were attributable to the genotype effects and the G×E interaction, respec-tively (Table 2). The large environmental percentage for the sum of squares indicates the signifi cant differences between the averages of some environments, which caused most of the variation in the fruit yield of yellow passion fruit. Similar results were observed in peanuts, in which most of the variation (93 %) was attributable to environmental factors and the G×E interaction, demon-strating that selecting the best genotypes is not an easy task (Oliveira and Godoy, 2006).
The AMMI model retrieves the part of the sum of squares (SQG×E) that determines the G×E interaction, which is called the standard portion (the genotype and environment effect), and a residual part, which corre-sponds to unpredictable and uninterpretable responses from the model (Cornelius et al., 1996). Thus, the ge-netic variation can be explained by the different AMMI models. Based on the FR test, the IPCA4 was the last with non-signifi cant residue (p < 0.01) (Table 2), which pro-vides guidance as to the selection of the AMMI3 model
Table 2 − Analysis of variance for yellow passion fruit yield, including the G×E interaction partition according to the Additive Main effects and Multiplicative Interaction (AMMI) analysis.
Sources of variation DF TS MS % explained % accumulated DFRA MSRA
Blocks/environments 16 2379.60 148.70**
Environment (E) 7 23432.50 3347.50**
Genotypes (G) 11 2128.20 193.50**
G×E 77 12981.40 168.60** 77 168.59**
IPCA1 17 6507.58 382.80** 50.10 50.10 60 107.90**
IPCA2 15 2408.56 160.57** 18.60 68.70 45 90.34**
IPCA3 13 1633.38 125.64** 12.50 81.20 32 76.00**
IPCA4 11 1100.83 100.08ns 8.50 89.70 21 63.38ns
IPCA5 9 695.18 77.24ns 5.40 95.10 12 52.99ns
IPCA6 7 367.38 52.48ns 2.80 97.90 5 53.70ns
IPCA7 5 268.88 53.78ns 2.10 100.00 0 0.00
Mean error/r 176 5602.40 31.80
to explain the G×E interaction effect. In addition, 69% of the sum of squares of the interaction can be explained by the AMMI2 model, with 50% and 19% explained by IPCA1 and IPCA2, respectively. The values explained by these models were higher than those observed in other crops, such as sugar cane and peanuts (Oliveira and Go-doy, 2006; Silveira et al., 2013).
Stability and adaptability analysis
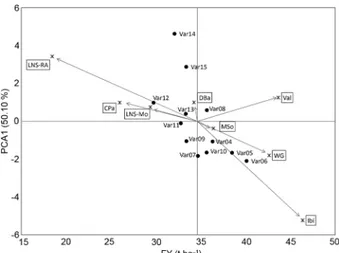
Biplot graphs of the AMMI1 (IPCA1 vs. additive effects from varieties and environment) and AMMI2 models (IPCA2 vs. IPCA1) are in Figures 1 and 2, respec-tively. The Livramento de Nossa Senhora - Rio Acima (LNS-RA), Cabaçeiras do Paraguaçu (CPa), Livramento de Nossa Senhora – Monte Oliveira (LNS-Mo) and Dom Basílio (DBa) environments produced the lowest yields of yellow passion fruit. Moreover, the environmental ef-fect scores were more scattered than the varietal efef-fect scores, indicating that variability due to the environment is greater than variability caused by varietal effects (Fig-ure 1).
According to Duarte and Vencovsky (1999), stabil-ity is evaluated in the y-axis (IPCA1) by AMMI1, whilst AMMI2 analysis revealed stable environments and gen-otypes located near the origin, with low scores for the two axes of the interaction (IPCA1 and IPCA2). Accord-ingly, varieties 08, 11 and 13 were the most stable, as indicated by values near the origin of the IPCA1 axis, which is indicative of a smaller contribution to the G×E interaction (Figure 1). However, varieties 11 and 13 had fruit yields lower than the overall mean and are, there-fore, not ideal. In contrast, varieties 14 and 15 were the most unstable, with fruit yields lower than the overall
mean. Similarly, varieties 05 and 06 were unstable, but presented high fruit yields. Varieties 04, 07, 09, 10 and 12 presented intermediate stability. Moreover, variety 06 presented not only high average fruit yield, but also high IPCA value, indicating adaptability specifi c to the Wenc-eslau Guimarães (WG) environment.
As regards the environment, we can highlight the smallest contribution to the interaction in the Marcioní-lio Souza (MSo) and LNS-Mo regions. Other environ-ments presented an intermediate (CPa and DBa) or high (LNS-RA, Valença - Val, WG and Ibicoara - Ibi) contribu-tion to the G×E interaccontribu-tion (Figure 1). Environmental stability is important for demonstrating the reliability of genotype ordering in a given environment in relation to the rating for the environments in question (Rocha et al., 2007). In the case of yellow passion fruit, average fruit yields were higher than the overall mean in only the Val, MSo, WG and Ibi environments, which accounted for 34.65 t ha−1. The main reason for the high fruit yield in these environments is likely related to the better avail-ability and distribution of rainfall in these regions or the use of irrigation systems, as was the case in Ibi and Mso during the initial establishment and fl owering phases.
Based on the AMMI2 analysis, varieties 11, 12 and 13 were found to be the most stable (Figure 2). How-ever, variety 08 was considered stable based on AMMI1 analysis, but was highly unstable according to AMMI2 analysis. Behavior inversions in relation to the classifi ca-tion of genotypes in AMMI1 and AMMI2 biplot were also observed in other crops, such as cowpea (Rocha et al., 2007). In the current situation, information from the AMMI2 biplot may be more accurate given that this model contains IPCA1 and IPCA2 information and,
Figure 2 − AMMI2 biplot showing the two main axes of interaction (IPCA2 vs. IPCA1) in 12 varieties of yellow passion fruit from eight environments in the State of Bahia, Brazil. CPa = Cabaçeiras do Paraguaçu, DBa = Dom Basílio, Ibi = Ibicoara, LNS-RA = Livramento de Nossa Senhora-Rio Acima, LNS-Mo = Livramento de Nossa Senhora – Monte Oliveira, MSo = Marcionílio Souza, Val = Valença, WG = Wenceslau Guimarães.
therefore, contains a greater pattern portion compared to the AMMI1 biplot, which considers only the IPCA1. Moreover, the classifi cation of variety 12 was changed from intermediate stability after AMMI1 analysis to high stability after AMMI2 analysis. Varieties 06, 07, 08, 14 and 15 appeared very unstable based on their signifi cant distance from the origin of the biplot graph.
Based on AMMI2 analysis, the DBa, Val and LNS-Mo environments were the main contributors to the phe-notypic stability of the varieties (Figure 2). Furthermore, the LNS-Mo and Val environments showed no signifi cant differences in fruit yield between the varieties (Table 3). In contrast, the Ibi, LNS-RA and WG environments made a signifi cant contribution to the G×E interaction, since they were positioned away from the origin of the AMMI2 biplot. In general, genotypes and environments in close proximity on the biplot graph have positive as-sociations, which certainly facilitate the creation of more similar agronomic performance zones. As an example,
variety 06 is found in the WG environment, and variety 12 is in the DBa environment. Other lower specifi c as-sociations can be observed, such as variety 13 in the CPa environment (Figure 2).
AMMI analysis does not provide a quantitative measure of stability. For this reason, Purchase et al. (2000) proposed an ASV measure to quantify and clas-sify genotypes according to their yield stability in that ASV is the distance of the varieties from point zero of the scatter diagram (IPCA1 vs. IPCA2). Although the IPCA1 score contributes more to the sum of squares for the G×E interaction, it must be weighted by the pro-portional difference between the scores of IPCA1 and IPCA2 in order to compensate for the relative contribu-tion of IPCA1 and IPCA2 to the total sum of squares of the interaction. Therefore, varieties 04, 08, 09, 11, 12 and 13 presented lower scores and therefore, were con-sidered to be more stable (Table 4). The ASV parameter has been used as an auxiliary criterion to defi ne more
Table 3 − Mean yellow passion fruit yield of select varieties evaluated in eight production environments in the State of Bahia, Brazil.
Variety Environments
1
CPa2 DBa Ibi LNS-RA LNS-Mo MSo Val WG
04 35.22 a 37.30 a 53.47 a 15.49b 20.80 a 39.46 a 42.91 a 46.02 b
05 26.10 b 40.86 a 57.47 a 16.64b 38.84 a 35.85 b 38.28 a 53.99 a
06 23.70 b 40.50 a 55.84 a 9.16b 33.26 a 47.02 a 52.29 a 59.27 a
07 30.62 a 29.57 b 63.96 a 12.62b 29.23 a 33.68 b 47.18 a 30.69 d
08 21.72 b 36.94 a 50.97 a 30.53a 31.09 a 28.05 b 45.95 a 40.35 c
09 16.39 b 33.09 a 51.72 a 14.07b 26.99 a 42.37 a 44.41a 38.28 c
10 25.35 b 31.25 b 55.67 a 15.73b 29.83 a 39.52 a 39.92 a 48.04 b
11 23.49 b 35.86 a 44.14 b 17.44b 29.34 a 33.54 b 34.68 a 43.79 b
12 18.01 b 22.73 b 35.03 c 18.70b 25.62 a 30.77 b 45.98 a 41.18 c
13 31.36 a 26.41 b 42.11 b 21.28b 26.35 a 36.46 b 38.65 a 44.11 b
14 22.41 b 39.18 a 22.96 d 34.69a 31.63 a 30.83 b 47.52 a 27.54 d
15 37.44 a 37.40 a 23.20 d 15.12b 29.73 a 39.63 a 46.16 a 38.44 c
1CPa = Cabaçeiras do Paraguaçu; DBa = Dom Basílio; Ibi = Ibicoara; LNS-RA = Livramento de Nossa Senhora-Rio Acima; LNS-Mo = Livramento de Nossa Senhora
– Monte Oliveira; MSo = Marcionílio Souza; Val = Valença; WG = Wenceslau Guimarães. Means followed by the same letter were not different (Scott-Knott test, p > 0.05). Underlined values in bold correspond to the varieties with the highest averages for a given environment. 2Measured in t ha−1.
Table 4 − First and second Interaction Principal Component Axis (IPCA), average yield (FY) of yellow passion fruit and other stability parameters: Additive Main effects and Multiplicative Interaction (AMMI) stability value (ASV), sustainability index (SuI), stability index (StI) and yield stability index (YSI).
Varieties IPCA1 IPCA2 FY ASV SuI (%) StI YSI
Var04 1.068 0.788 36.33b 2.992 69.97 59.39 8
Var05 1.663 0.107 38.50a 4.494 75.01 62.75 10
Var06 2.094 2.078 40.13a 6.028 76.98 65.23 11
Var07 1.830 -2.264 34.69c 5.437 62.20 56.38 15
Var08 -0.584 -2.670 35.70b 3.102 63.85 58.27 10
Var09 1.048 -0.514 33.41c 2.879 57.49 54.80 11
Var10 1.649 0.076 35.66b 4.456 57.38 58.69 12
Var11 0.105 0.221 32.79c 0.360 49.85 55.53 11
Var12 -0.982 0.041 29.75c 2.653 40.92 48.88 15
Var13 -0.392 0.565 33.34c 1.200 49.57 55.00 11
Var14 -4.623 -1.366 32.10c 12.56 42.43 52.07 23
stable genotypes in other crops such as wheat (Farshad-far et al., 2011) and rice (Das et al., 2010).
The most stable varieties according to the YSI were 04, 05 and 08 (Table 4). The YSI method incorpo-rates both yield and stability into a single index, reduc-ing the problem of usreduc-ing only yield stability as the sole criterion to select varieties, taking into account that the most stable genotypes do not always have the best yield performance (Oliveira and Godoy, 2006). Accordingly, the YSI parameter associated with genotype classifi ca-tion is based on the ASV parameter (which accounts for IPCA1 and IPCA2), and the ranking of varieties is based on fruit yield. This method has been successfully used in other crops, such as wheat (Farshadfar, 2008), in which the authors stated that this criterion agreed with the bi-plot analysis.
The sustainability index of each variety is present-ed in Table 4. Most yellow passion fruit varieties were classifi ed as having median sustainability (ranging from 40 to 70%), and varieties 05 and 06 showed high sus-tainability (75.01 and 76.98, respectively). The high SuI values coincided with high fruit yield from varieties 05 and 06. However, this index has not been adequate for discriminating stable genotypes with high grain yield in wheat (Mladenov et al., 2012). Similar results were also obtained for wheat by Farshadfar et al. (2011), with sus-tainability indices higher than 91 % reported for some genotypes.
Yellow passion fruit varieties were ranked on the basis of StI in decreasing order. The results showed that the StI from the 12 yellow passion fruit varieties were very similar, with varieties 05 and 06 presenting indices above 62.00 (Table 4). The StI overcomes some of the methodical disadvantages based on genotype ranking, which causes a bias in the selection of the most produc-tive genotypes (Bajpai and Prabhakaran, 2000). Based on this fi nding, the StI stability and fruit yield of the
geno-types are measured on the basis of individual perfor-mance relative to the average perforperfor-mance of the geno-types evaluated. This trend was observed in the current study, as varieties 05 and 06 were deemed more stable and also presented the highest fruit yields.
Environmental classifi cation
The main purpose of this stability analysis is to iden-tify yellow passion fruit varieties with wide geographic adaptation, high agronomic performance and high fruit yield (preferably above the overall mean of 34.65 t ha−1) in heterogeneousenvironments. Because it can be diffi -cult to identify a perfect variety, the identifi cation of vari-eties with specifi c adaptations can be extremely useful for more regionalized varietal recommendations.
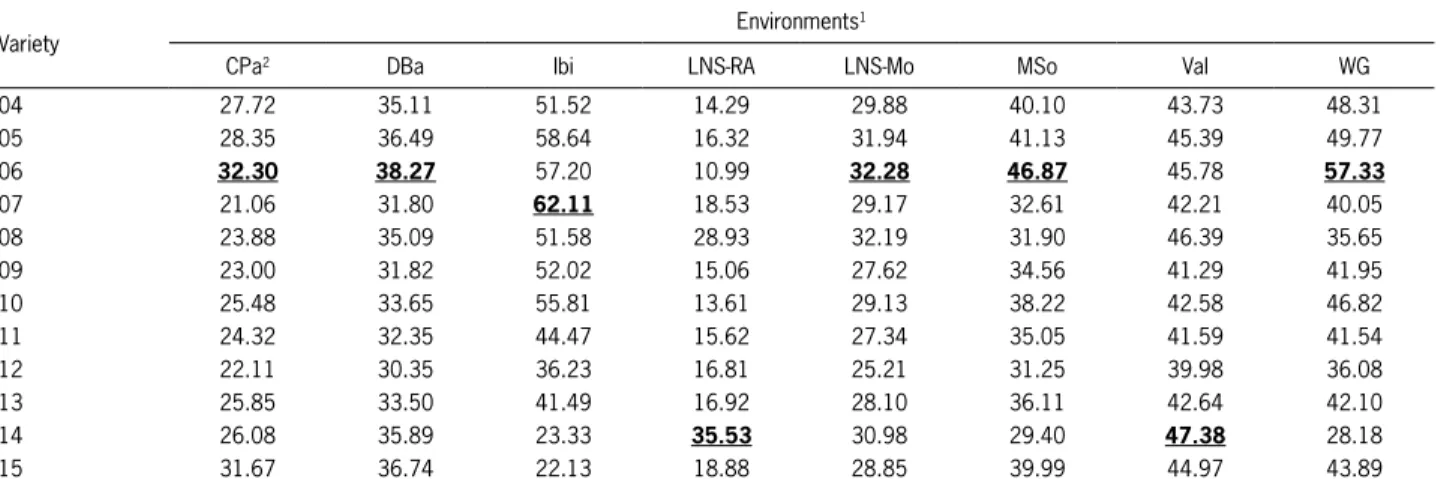
The classifi cation of environments based on high-er-performance genotypes (means for fruit yield) in each environment facilitated the identifi cation of fi ve mega environments (variety 05 in the DBa and LNS-Mo envi-ronments; variety 06 in the MSo, Val and WG environ-ments; variety 07 in the Ibi environment; variety 14 in the LNS-RA environment; and variety 15 in the CPa en-vironment) (Table 3). In contrast, this same classifi cation based on the AMMI2 model (predicted means for fruit yield) allowed for the identifi cation of only three mega environments (Table 5). The fi rst included the CPa, DBa, LNS-Mo, MSo and WG environments, with variety 06 having the highest fruit yield. The second mega environ-ment was Ibi, in which variety 07 had the best perfor-mance. Lastly, the third mega environment consisted of LNS-Ra and WG, with variety 14 as the most productive (Table 5). The superiority of mega environments formed from the mean fruit yield can be attributed to the por-tion of noise incorporated into estimates of raw data (Sil-veira et al., 2013). Such noise is usually reduced during AMMI2 analysis, ultimately ensuring fewer mistakes in cultivar recommendations.
Table 5 – The fi rst two axes of the Additive Main effects and Multiplicative Interaction (AMMI2) model predictions for yellow passion fruit variety yields.
Variety Environments
1
CPa2 DBa Ibi LNS-RA LNS-Mo MSo Val WG
04 27.72 35.11 51.52 14.29 29.88 40.10 43.73 48.31
05 28.35 36.49 58.64 16.32 31.94 41.13 45.39 49.77
06 32.30 38.27 57.20 10.99 32.28 46.87 45.78 57.33
07 21.06 31.80 62.11 18.53 29.17 32.61 42.21 40.05
08 23.88 35.09 51.58 28.93 32.19 31.90 46.39 35.65
09 23.00 31.82 52.02 15.06 27.62 34.56 41.29 41.95
10 25.48 33.65 55.81 13.61 29.13 38.22 42.58 46.82
11 24.32 32.35 44.47 15.62 27.34 35.05 41.59 41.54
12 22.11 30.35 36.23 16.81 25.21 31.25 39.98 36.08
13 25.85 33.50 41.49 16.92 28.10 36.11 42.64 42.10
14 26.08 35.89 23.33 35.53 30.98 29.40 47.38 28.18
15 31.67 36.74 22.13 18.88 28.85 39.99 44.97 43.89
1CPa = Cabaçeiras do Paraguaçu, DBa = Dom Basílio, Ibi = Ibicoara, LNS-RA = Livramento de Nossa Senhora-Rio Acima, LNS-Mo = Livramento de Nossa Senhora –
Conclusions
Because of the greater phenotypic stability the DBa, Val and LNS-Mo environments can be used during the initial stages of selecting new yellow passion fruit varieties.
A graphical interpretation of the AMMI analysis and YSI index incorporating the ASV and the yield ca-pacity of the different varieties in a single non-paramet-ric index were useful for discriminating genotypes with superior and stable fruit yield.
Although the use of different methods to estimate the stability and adaptability of select yellow passion fruit varieties has led to controversial results, varieties 04 and 05 were generally the most stable when consider-ing the average of the eight environments based on dif-ferent methods, in addition to their high yield potential. When selecting yellow passion fruit varieties that are more productive in certain environments variety 06 presented high adaptability to the MSo, Val and WG en-vironments, leading to an improvement of passion fruit productivity in specifi c regions.
Acknowledgments
To Bahia State Foundation for Research Support (Fapesb) and National Counsil for Scientifi c and Tech-nological Development (CNPq), for their fi nancial assis-tance and scholarship support.
References
Babarmanzoor, A.; Tariq, M.S.; Ghulam, A.; Muhammad, A.
2009. Genotype × environment interaction for seed yield
in Kabuli Chickpea (Cicer arietinum L.) genotypes developed
through mutation breeding. Pakistan Journal of Botany 41: 1883-1890.
Bajpai, P.K.; Prabhakaran T. 2000. A new procedure of simultaneous selection for high yielding and stable crop genotypes. The Indian Journal of Genetics and Plant Breeding 60: 141-146.
Cornelius, P.L.; Crossa, J.; Seyedsadr, M.S. 1996. Statistical tests and estimators of multiplicative models for genotype-by-environment interaction. p. 199-234. In: Kang, M.S.; Gauch, H.G., eds. Genotype-by-environment interaction. CRC Press, Boca Raton, FL, USA.
Cornelius, P.L.; Seyedsadr, M.; Crossa, J. 1992. Using the shifted multiplicative model to search for “separability” in crop cultivar trials. Theoretical and Applied Genetics 84: 161-172. Crossa, J.; Gauch, H.G.; Zobel, R.W. 1990. Additive main effect
and multiplicative interaction analysis of two international maize cultivar trials. Crop Science 30: 493-500.
Crossa, J. 1990. Statistical analysis of multilocation trials. Advances in Agronomy 44: 55-85.
Das, S.; Misra, R.C.; Patnaik, M.C.; Das, S.R. 2010. G×E interaction, adaptability and yield stability of mid-early rice genotypes. The Indian Journal of Agricultural Research 44: 104-111.
Duarte, J.B.; Vencovsky, R. 1999. Genotype × environment
interaction: an introduction to AMMI analysis = Interação
genótipos × ambientes: uma introdução à análise AMMI. Sociedade Brasileira de Genética, Ribeirão Preto, SP, Brazil (in Portuguese).
FAO. Soil map of the world. Revised legend with corrections. Rome: FAO; UNESCO; Wageningen: ISRIC, 1994. 140p. (World Resources Report, 60)
Farshadfar, E. 2008. Incorporation of AMMI stability value and grain yield in a single non-parametric index (GSI) in bread wheat. Pakistan Journal of Biological Science 11: 1791-1796. Farshadfar, E.; Mahmodi, N.; Yaghotipoor, A. 2011. AMMI
stability value and simultaneous estimation of yield and yield stability in bread wheat (Triticum aestivum L.). Australasian Journal of Crop Science 5: 1837-1844.
Gauch, H.G.; Zobel, R.W. 1996. AMMI analysis of yield trials. p. 85-122. In: Kang, M.S.; Gauch, H.G., eds. Genotype-by-environment interaction. CRC Press, Boca Raton, FL, USA. Gauch, H.G. 1988. Model selection and validation for yield trials
with interaction. Biometrics 44: 705-715.
Holhs, T. 1995. Analysis of genotype environment interactions. South African Journal of Science 91: 121-124.
Lin, C.S.; Binns, M.R.; Lefkovitch, L.P. 1986. Stability analysis: where do we stand? Crop Science 26: 894-900.
Mladenov, V.; Banjac, B.; Miloševic, M. 2012. Evaluation of yield and seed requirements stability of bread wheat (Triticum aestivum L.) via AMMI model. Turkish Journal of Field Crops 17: 203-207.
Oliveira, E.J.; Godoy, I.J. 2006. Pod yield stability analysis of runner peanut lines using AMMI. Crop Breeding and Applied Biotechnology 6: 311-317.
Purchase, J.L.; Hatting, H.; Vandeventer, C.S. 2000. Genotype × environment interaction of winter wheat (Triticum aestivum
L.) in South Africa. II. Stability analysis of yield performance. South African Journal of Plant and Soil 17: 101-107.
Rao, M.; Lakshmikantha, R.G.; Kulkarni, R.S.; Lalitha, R.S.S.; Ramesh, S. 2004. Stability analysis of sunfl ower hybrids through non-parametric model. Helia 27: 59-66.
Rocha, M.M.; Freire Filho, F.R.; Ribeiro, V.Q.; Carvalho, H.W.L.; Belarmino Filho, J.; Raposo, J.A.A.; Alcântara, J.P.; Ramos, S.R.R.; Machado, C.F. 2007. Yield adaptability and stability of semi-erect cowpea genotypes in the Brazil Northeast Region. Pesquisa Agropecuária Brasileira 42: 1283-1289 (in Portuguese, with abstract in English).
Shukla, G.K. 1972. Some statistical aspects of partitioning genotype-environmental components of variability. Heredity 29: 237-245.
Silveira, L.C.I.; Kist, V.; Paula, T.O.M.; Barbosa, M.H.P.; Peternelli, L.A.; Daros, E. 2013. AMMI analysis to evaluate the adaptability and phenotypic stability of sugarcane genotypes. Scientia Agricola 70: 27-32.