Automated grading of left ventricular
segmental wall motion by an artificial
neural network using color kinesis images
Divisão de Cardiologia, Departamento de Clínica Médica,
Faculdade de Medicina de Ribeirão Preto, Universidade de São Paulo, Ribeirão Preto, SP, Brasil
L.O. Murta Jr., E.E.S. Ruiz, A. Pazin-Filho, A. Schmidt, O.C. Almeida-Filho, M.V. Simões, J.A. Marin-Neto and B.C. Maciel
Abstract
The present study describes an auxiliary tool in the diagnosis of left ventricular (LV) segmental wall motion (WM) abnormalities based on color-coded echocardiographic WM images. An artificial neural net-work (ANN) was developed and validated for grading LV segmental WM using data from color kinesis (CK) images, a technique devel-oped to display the timing and magnitude of global and regional WM in real time. We evaluated 21 normal subjects and 20 patients with LVWM abnormalities revealed by two-dimensional echocardiogra-phy. CK images were obtained in two sets of viewing planes. A method was developed to analyze CK images, providing quantitation of fractional area change in each of the 16 LV segments. Two experienced observers analyzed LVWM from two-dimensional im-ages and scored them as: 1) normal, 2) mild hypokinesia, 3) moderate hypokinesia, 4) severe hypokinesia, 5) akinesia, and 6) dyskinesia. Based on expert analysis of 10 normal subjects and 10 patients, we traineda multilayer perceptron ANN using a back-propagation algo-rithm to provide automated grading of LVWM, and this ANN was then tested in the remaining subjects. Excellent concordance between expert and ANN analysis was shown by ROC curve analysis, with measured area under the curve of 0.975. An excellent correlation was also obtained for global LV segmental WM index by expert and ANN analysis (R2 = 0.99). In conclusion, ANN showed high accuracy for automated semi-quantitative grading of WM based on CK images. This technique can be an important aid, improving diagnostic accu-racy and reducing inter-observer variability in scoring segmental LVWM.
Correspondence
B.C. Maciel Divisão de Cardiologia Departamento de Clínica Médica FMRP, USP
14048-900 Ribeirão Preto, SP Brasil
Fax: +55-16-633-0869 E-mail:[email protected] Publication supported by FAPESP.
Received February 28, 2005 Accepted October 6, 2005
Key words
•Artificial neural network •Color kinesis images •Left ventricular function
Introduction
One of the techniques most commonly used to quantify left ventricular systolic func-tion in patients is based on visual analysis of myocardial thickening and wall motion by an experienced and trained observer. This
a wide variability in grading left ventricular wall motion has been documented even among experienced observers (1-3). There-fore, it would be desirable to develop meth-ods for improving the agreement between observers during wall motion analysis.
Artificial neural network (ANN) appli-cations in clinical medicine, and specifically in Cardiology, have increased in the last few years (4-9). This tool has the ability to recog-nize and classify complex patterns of bio-logical information by learning from ex-amples, to identify relations in input data, and to provide automated interpretation of clinical or diagnostic information.
Acoustic quantification (10,11) is an au-tomated edge detection method incorporated into a commercially available ultrasound sys-tem which provides real-time, objective and reproducible estimation of ventricular area and volume (10-16). Color kinesis is a new technique (17) based on acoustic quantifica-tion, developed to display on-line timing and extension of endocardial motion by cre-ating a color map of regional wall motion. Despite its potential for clinical application, there are no previous studies analyzing the diagnostic potential of color kinesis images for grading left ventricular systolic function by using an ANN tool.
The objectives of the present investiga-tion were: 1) to develop a computerized method for quantifying the relative exten-sion of segmental systolic endocardial mo-tion as documented by color kinesis, and 2) to develop and validate an ANN for grading left ventricular segmental wall motion using data from color kinesis images obtained for normal subjects and patients with left ven-tricular dysfunction.
Subjects and Methods
Subjects
Color kinesis images were obtained for 21 normal subjects (8 women and 13 men)
aged 23 to 61 years (mean: 30 years), who were completely asymptomatic and who pre-sented a normal two-dimensional echocar-diogram, and for 20 patients (4 women and 16 men) aged 24 to 70 years (mean: 53 years) who had segmental or diffuse left ventricular dysfunction as documented by two-dimensional echocardiography. Patient inclusion criteria were: 1) adequate image quality (two-dimensional and endocardium tracking by acoustic quantification), 2) sinus rhythm, and 3) presence of wall motion ab-normalities exclusively related to ischemic or myocardial disease. All subjects who were included in this investigation provided writ-ten informed consent to participate. The pro-tocol was approved by the Ethics Committee of the Hospital das Clínicas de Ribeirão Preto.
Equipment and data acquisition
The investigation was performed using a commercially available ultrasound system (Sonos 5500, Philips, Andover, MA, USA) which included the acoustic quantification and color kinesis software packages. Images were obtained with subjects in left lateral decubitus, using a 2- to 4-MHz transducer. After a complete conventional two-dimen-sional echocardiographic study, the acoustic quantification software was activated and adjusted to obtain adequate tracking of en-docardial borders. Color kinesis images were then obtained and recorded on a magnetic optical disk.
of the endocardial border during the cardiac cycle is tracked and represented by different color hues triggered byend-diastole and dis-played at 33-ms intervals. At end-systole, the colors added during systole frame by frame result in a color overlay consisting of each 33-ms display which express the tim-ing and magnitude of endocardial excursion throughout systole.
Color kinesis images were obtained in two sets: 1) apical views (longitudinal, 2 and 4 chambers); 2) parasternal short axis views (at the mitral valve, papillary muscle and apical levels). For each imaging plane, two systolic images were obtained, stored on a magnetic optical disk and downloaded into a personal computer where all calculations and processing were performed. The first of these image planes is parallel to the long axis of the left ventricle, while the other one is perpendicular to this axis.
Based on these two sets of images, it was possible to define 16 segments of the left ventricle as standardized by the American Society of Echocardiography (18) for each imaging plane.
Image segmentation and segmental analysis of endocardial motion
Color-coded images were divided into segments using a custom software. In a first step, a binary image was extracted from the original image, where colored pixels were assigned as true, or a value of 1, while gray scale pixels were assigned as false, or a value of 0. Therefore, areas containing the color hues in the image were separate from the black and white background. Most of the image processing performed was based on Boolean morphologic operations on these binary images (18).
The centroid of left ventricular diastolic cavity, representing the average coordinates for all points composing this cavity, was mathematically calculated as previously re-ported (17). This centroid can be described
by:
where s is the area of the left ventricular chamber at end systole, and x1 and x2 are the two-dimensional space coordinates.
In the short axis plane processing, the ventricular segmentation was started by con-necting the centroid point to a manually identified point representing the junction between the right ventricular posterior wall endocardium and the interventricular sep-tum. From this line, the left ventricle was automatically divided into six 60º segments for basal and medium regions and four 90º segments for the apical region (Figure 1).
For the long axis images, a distal point represented by a color pixel located at a greater distance from the centroid was iden-tified. Two other points were then manually marked on the image, identifying the exter-nal limits of the mitral valve ring. These two
points were important to exclude the color overlay reflecting the mitral valve excursion from the calculations of left ventricular sys-tolic function. Ventricular segmentation con-sidered the distal point located in the apical region and the two points in the mitral valve ring. All of these points were connected to the centroid and the ventricular chamber was divided into 6 segments with equivalent angles.
The fractional area change was then cal-culated for each segment as follows:
where Ad is the total area of the segment at
end diastole (corresponding to the total pixel count, including all color pixels and those identified as blood) and As is the total area of
the segment at end systole (corresponding to the color pixel area).
Development, architecture and training of the artificial neural network
One of the main problems in the applica-tion of ANN is the adequate choice of input parameters. In the present study, to obtain an automated semi-quantitative classification of left ventricular wall motion, we chose the fractional area change of color kinesis im-ages representing segmental wall motion. Based on left ventricular segmentation, as shown in Figure 1, we have, therefore, 32 nodes in the input layer to feed the neural network.
A multi-layer perceptron neural network was developed and trained in order to pro-vide an automated tool for analysis of re-gional systolic function using color kinesis images. Network development and training was executed using a specific tool for neural network programming in the MatLab™
soft-ware environment.
A 3-layer fully connected perceptron (19) network was created, with the first layer neurons having a sigmoid transfer function
and the second and third layers using semi-lineal functions. The input layer has 32 nodes, one for each ventricular segment on both planes, and the output layer has 16 nodes denoting corresponding wall motion scores. The neurons were initialized with random values for weights and alias, and trained using the back-propagation (20) algorithm. We used a descending gradient with a mo-mentum model for learning.
The best training response for the net was with the momentum factor of 0.8. The de-fined error goal was 5.0 x 10⁻⁵, so that the
training stopped at this total error. Another stopping criterion was fixed for the mini-mum gradient and below this gradient the algorithm is halted. The learning rate set for the back-propagation algorithm was 0.25. Therefore, the weights were adjusted by nor-malized error and this learning rate product. To adequately grade left ventricular wall motion, the training pairs (X, d) correspond to fractional area change, obtained from color kinesis images, as an input variable and the discrete information defining left ventricu-lar wall motion as normal or abnormal, cor-responding to the desired answers obtained from expert grading of wall motion. Semi-quantitative expert classification of segmen-tal wall motion was performed by two expe-rienced observers. They analyzed left ven-tricular wall motion from two-dimensional images for normal subjects and patients us-ing the followus-ing scores: 1) normal, 2) mild hypokinesia, 3) moderate hypokinesia, 4) severe hypokinesia, 5) akinesia, and 6) dys-kinesia. When a discordant analysis between the two observers occurred, the wall motion score was defined by consensus. Using this approach it is possible to train the associa-tive memory of the neural network based on the specialist’s knowledge.
testing group. Both groups included equal numbers of normal individuals and patients presenting different degrees of ventricular dysfunction. The training group was used to train the neural network and the testing group was then used to evaluate the diagnostic accuracy of this tool.
Statistical analysis
The sensitivity and specificity of the ANN tool compared to the physician’s grading of left ventricular wall motion were calculated using standard equations. The performance of the neural network was also evaluated by receiver operating characteristic (ROC) curves and linear regression analysis.
Results
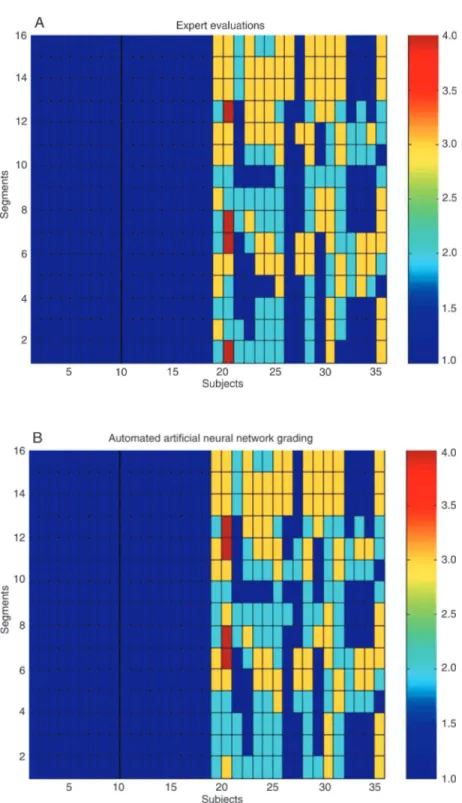
After training, the accuracy of the ANN in identifying and grading left ventricular wall motion abnormalities was determined in a group of normal subjects and of patients presenting left ventricular systolic dysfunc-tion. Figure 2A and B shows a color presen-tation of left ventricular wall motion scores ranging from 1 to 4 for each of the 16 seg-ments evaluated by the expert physicians (Figure 2A) and by the ANN (Figure 2B). The different subjects evaluated, including normal volunteers and patients with ventric-ular dysfunction, are represented on the x-axis.
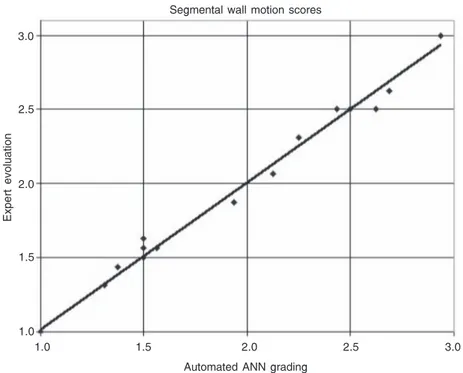
By visual analysis it is possible to ob-serve a high degree of concordance between expert and automated ANN classification of wall motion. This agreement can also be appreciated in Figure 3, which shows the correlation between mean left ventricular wall motion scores for all 16 ventricular segments, for each individual studied, ob-tained by expert analysis and by ANN clas-sification. A linear relationship with a coef-ficient of determination of 0.9959 was docu-mented, confirming high agreement between the two evaluations.
The efficiency of the trained network for classifying the testing group was evaluated by a ROC curve, considering only two cat-egories for the different classifications: nega-tive or normal wall motion, i.e., a score of 1, and positive or some degree of wall motion abnormality (a score of 2 or higher). The ability of ANN for automated identification of ventricular wall motion abnormality can be appreciated in Figure 4, which shows the ROC curve obtained under the specified con-ditions for the evaluation of the test group. The area under the curve was of 0.975, which indicates a high performance of ANN for the detection of wall motion abnormality with high levels of specificity (0.987), without compromising ANN sensitivity (0.985). These results show an excellent ANN accu-racy for providing diagnostic classification.
Discussion
Identification and grading of left ventric-ular segmental wall motion abnormalities are a fundamental part of clinical evaluation of patients presenting coronary artery dis-ease. Usually, this evaluation is subjective and highly dependent on the observer’s ex-perience, and the results obtained are semi-quantitative. Even among experienced ob-servers, a wide variability in grading left ventricular wall motion has been documented (1-3). Therefore, a computerized tool which could assist physicians in the diagnosis and classification of wall motion abnormalities would be quite useful. ANN have been pre-viously used to interpret different types of images (8,21) but, to the best of our knowl-edge, this is the first study using this deci-sion support technique to evaluate ventricu-lar function based on echocardiography.
In the present study, we have shown that an ANN, fed forward using segmental quan-titation of wall motion obtained from color kinesis images and previously trained using a database with expert physician grading of wall motion, was able to automatically
iden-Figure 4. Receiver operating caracteristic curve of the artificial neural network used in the left ventricular wall motion classification. The curve shows true-positive rate versus false-positive rate. The area under curve is equal to 0.975 showing a high accuracy for the neural network evaluation.
Figure 3. Simple linear regression analysis for the mean score of left ventricular wall motion as obtained by expert evaluation and by automated artificial neural network (ANN) classifi-cation.
1.00
0.95
0.90
0.85
0.80
0.75
0.70
0.65
0.60
0.55
0.50
True-positive rate
0 0.5 0.10 0.15 0.20 0.25 0.30 0.35 0.40 0.45 0.50
False-positive rate Receiver operating caracteristic curve 3.0
2.5
2.0
1.5
1.0
1.0 1.5 2.0 2.5 3.0
Automated ANN grading Segmental wall motion scores
References
1. Hoffmann R, Lethen H, Marwick T et al. (1996). Analysis of interinsti-tutional observer agreement in interpretation of dobutamine stress
echocardiograms. Journal of the American College of Cardiology,
27: 330-336.
2. Hoffmann R, Lethen H, Marwick T et al. (1998). Standardized guide-lines for the interpretation of dobutamine echocardiography reduce
interinstitutional variance in interpretation. American Journal of
Car-diology, 82: 1520-1524.
3. Zamorano J, Sanchez V, Moreno R et al. (2002). Contrast agents provide a faster learning curve in dipyridamole stress
echocardiog-raphy. International Journal of Cardiovascular Imaging, 18:
415-419.
4. Cathers I (1995). Neural network assisted cardiac auscultation.
Artificial Intelligence in Medicine, 7: 53-66.
5. Itchhaporia D, Snow PB, Almassy RJ et al. (1996). Artificial neural
networks: current status in cardiovascular medicine. Journal of the
American College of Cardiology, 28: 515-521.
6. Heden B, Ohlsson M, Rittner R et al. (1996). Agreement between artificial neural networks and experienced electrocardiographer on
electrocardiographic diagnosis of healed myocardial infarction.
Jour-nal of the American College of Cardiology, 28: 1012-1016.
7. Heden B, Ohlin H, Rittner R et al.(1997). Acute myocardial
infarc-tion detected in the 12-lead ECG by artificial neural networks.
Circu-lation, 96: 1798-1802.
8. Lindahl D, Toft J, Hesse B et al. (2000). Scandinavian test of artificial neural network for classification of myocardial perfusion images.
Clinical Physiology, 20: 253-261.
9. DeGroff CG, Bhatikar S, Hertzberg J et al. (2001). Artificial neural
network-based method of screening heart murmurs in children.
Cir-culation, 103: 2711-2716.
10. Perez JE, Waggoner AD, Barzilai MR et al. (1992). On-line assess-ment of ventricular function by automatic boundary detection and
ultrasonic backscatter imaging. Journal of the American College of
Cardiology, 19: 313-320.
11. Perez JE, Klein SC, Prater DM et al. (1992). Automated on-line quantification of left ventricular dimensions and function by
echocar-diography with backscatter imaging and lateral gain compensation.
American Journal of Cardiology, 70: 1200-1205.
12. Marcus RH, Bednarz J, Coulden R et al. (1993). Evaluation of ultrasonic backscatter system for automated real-time endocardial
boundary by ultrafast computerized tomography. Journal of the
American College of Cardiology, 22: 839-847.
13. Gorcsan III J, Lazar JM, Schulman DS et al. (1993). Comparison of left ventricular function by echocardiographic automated border
de-tection and by radionuclide ejection fraction. American Journal of
Cardiology, 72: 810-815.
14. Gorcsan III J, Morita S, Mandarino WA et al. (1993) Two dimen-sional echocardiographic automated border detection accurately
reflects changes in left ventricular volume. Journal of the American
Society of Echocardiography, 6: 482-489.
15. Chenzbraun A, Pinto FJ, Popylisen S et al. (1993). Comparison of acoustic quantification and Doppler echocardiography in
assess-ment of left ventricular variables. British Heart Journal, 70: 482-489.
16. Morrissey RL, Siu SC, Guerrero JL et al. (1994) Automated assess-ment of left ventricular volume and function by echocardiography:
validation of automated border detection. Journal of the American
Society of Echocardiography, 7: 107-115.
17. Lang RM, Vignon P, Weinert L et al. (1996). Echocardiographic quantification of regional left ventricular wall motion with color kine-sis. Circulation, 93: 1877-1885.
18. Prater D (1997). The Fundamentals of Acoustic Quantification and
Color Kinesis Technology. Echocardiography and Cardio-vascular Function: Tools for the Next Decade, © Kluwer Academic Publish-ers, USA, ISBN 0-7923-9884-X, 1-9.
19. Minsky M & Papert S (1969). Perceptrons. MIT Press, Cambridge,
MA, USA.
20. Rumelhart DE, Hinton GE & Williams RJ (1986). Learning
represen-tations by back-propagation of errors. Nature, 323: 533-536.
21. Tourassi GD, Floyd CE, Sostman HD et al. (1993). Acute pulmonary
embolism: artificial neural network approach for diagnosis.
Radiol-ogy, 189: 555-558.
tify and grade left ventricular wall motion with high degrees of sensitivity and specific-ity. The high performance of this ANN for automated grading of left ventricular wall motion indicates that the use of neural net-works for decision aid in the interpretation of left ventricular function, as evaluated by echocardiography, is feasible and accurate. This tool can represent an important support for training physicians in echocardiography and can also be an important aid to improve
diagnostic accuracy and to reduce inter-ob-server variability in scoring segmental left ventricular wall motion.