Comparison of anaerobic threshold
determined by visual and mathematical
methods in healthy women
1Departamento de Ginecologia e Obstetrícia, 2Divisão de Cardiologia,
Departamento de Clínica Médica, Hospital das Clínicas,
Faculdade de Medicina de Ribeirão Preto, Universidade de São Paulo, Ribeirão Preto, SP, Brasil
3Núcleo de Pesquisa em Exercício Físico, Laboratório de Fisioterapia Cardiovascular,
Departamento de Fisioterapia, Universidade Federal de São Carlos, São Carlos, SP, Brasil
4Laboratório de Pesquisa em Fisioterapia Cardiovascular e de Provas Funcionais,
Faculdade de Ciências da Saúde, Universidade Metodista de Piracicaba, Piracicaba, SP, Brasil
M.N. Higa1,
E. Silva3,4,
V.F.C. Neves3,
A.M. Catai3,
L. Gallo Jr.2
and M.F. Silva de Sá1
Abstract
Several methods are used to estimate anaerobic threshold (AT) during exercise. The aim of the present study was to compare AT obtained by a graphic visual method for the estimate of ventilatory and metabolic variables (gold standard), to a bi-segmental linear regression math-ematical model of Hinkley’s algorithm applied to heart rate (HR) and carbon dioxide output (V
.
CO2) data. Thirteen young (24 ± 2.63 years old) and 16 postmenopausal (57 ± 4.79 years old) healthy and seden-tary women were submitted to a continuous ergospirometric incre-mental test on an electromagnetic braking cycloergometer with 10 to 20 W/min increases until physical exhaustion. The ventilatory vari-ables were recorded breath-to-breath and HR was obtained beat-to-beat over real time. Data were analyzed by the nonparametric Fried-man test and SpearFried-man correlation test with the level of significance set at 5%. Power output (W), HR (bpm), oxygen uptake (V.
O2; mL kg-1 min-1), V.
O2 (mL/min), V.
CO2 (mL/min), and minute ventilation (V.
E; L/min) data observed at the AT level were similar for both methods and groups studied (P > 0.05). The V.
O2 (mL kg-1 min-1) data showed significant correlation (P < 0.05) between the gold standard method and the mathematical model when applied to HR (rs = 0.75) and V.
CO2 (rs = 0.78) data for the subjects as a whole (N = 29). The proposed mathematical method for the detection of changes in re-sponse patterns of V.
CO2 and HR was adequate and promising for AT detection in young and middle-aged women, representing a semi-automatic, non-invasive and objective AT measurement.Correspondence
E. Silva
Laboratório de Pesquisa em Fisioterapia Cardiovascular e Provas Funcionais
Faculdade de Ciências da Saúde Universidade Metodista de Piracicaba Rodovia do Açúcar, km 156 13400-911 Piracicaba, SP Brasil
Fax: +55-19-3124-1558 E-mail: [email protected] Research supported by CAPES, CNPq (No. 140684/2003-4) and FAPESP (No. 01/07427-2).
Received April 28, 2006 Accepted January 12, 2007
Key words
Introduction
The level of intensity of physical exer-cise, when energy production by aerobic metabolism is supplemented by anaerobic metabolism, is characterized as anaerobic threshold (AT) (1,2). This physiological de-limitation provides important information about the major physiological systems of the organism involved in the performance of physical activity and constitutes a most im-portant determinant of an individual’s func-tional aerobic capacity (1-3).
Several methods have been employed for AT determination. The interest in the identification of the critical intensity work-load above which lactate accumulation oc-curs has a long history (4,5). Invasive meth-ods require repeated blood lactate concen-tration measurements during physical exer-cise (6,7) while non-invasive methods are based on the analysis of changes in the re-sponse patterns of ventilatory and metabolic variables, such as V-slope (1,5) and the graphic visual method (8,9). Some studies (8,9) have used the graphic visual method for the estimate of the disproportionate in-crease in ventilatory and metabolic variables, during the incremental dynamic exercise, as a gold standard for the quantification of AT. Additionally, other investigators have identi-fied AT by analysis of heart rate (HR) (3,10-13) and of its variability (14), as well as by surface electromyography analysis (15-17).
Interest in the determination of AT has increased because of the inclusion of quali-tative and systematic research in health stud-ies. Some investigators have proposed the use of mathematical and statistical models as a means to characterize responses of bio-logical systems of the organism during physi-cal exercise (8-10,18,19).
The recent technological advances in equipment for the determination of AT and the use of mathematical and statistical algo-rithms have served to facilitate, automate and/or semi-automate this procedure. Thus,
mathematical and statistical algorithms have become tools destined to represent the dy-namic behavior of biological variables of interest, such as the physiological change patterns of the metabolic and ventilatory variables observed when AT is reached.
The search for ever more perfected tech-niques for AT determination has great im-portance, since this parameter has been ex-tensively used for the evaluation of aerobic capacity at submaximal levels of physical exercise and for the prescription of indi-vidual physical training for patient rehabili-tation.
In view of these considerations, the pur-pose of the present study was to compare the AT determined by the graphic visual method for the estimate of ventilatory and metabolic variables, considered to be the gold stand-ard, to the Hinkley (20) bi-segmental linear regression mathematical model (MMH), in healthy women.
Material and Methods
Subjects
Thirteen young (24 ± 2.63 years of age) and 16 postmenopausal (57 ± 4.79 years of age) women took part in the study. The young volunteers selected presented regular menstrual cycles and had not been using anticonceptionals for at least 6 months. The postmenopausal state was defined by the absence of a spontaneous menstrual cycle for at least 1 year, and serum
follicular-stimulating hormone levels above 30 mIU/
mL. None of the postmenopausal women were using hormone therapy.
and concentration of thyroid-stimulating hormone). None of the volunteers had respi-ratory, metabolic or cardiovascular diseases. Smokers and users of any kind of medica-tion were excluded from the study. The oxy-gen uptake data (V
.
O2) obtained at peak of the ergospirometric test were used to better characterize the subjects and to obtain the aerobic classification. According to the American Heart Association (21), all volun-teers studied had a “very low level” of aero-bic capacity, characterizing their sedentary life style.The volunteers were instructed about the objectives and experimental procedures of the study, its experimental protocol and its non-invasive character. After agreeing to participate, all volunteers gave written in-formed consent. The Ethics Committee of the University Hospital, Medical School of Ribeirão Preto, University of São Paulo, and the Ethics Committee of the Federal Univer-sity of São Carlos, SP, Brazil, approved the study.
Experimental procedure
The experimental procedures were per-formed in a climatically controlled labora-tory where temperature and relative air hu-midity were kept at around 23ºC and 60%, respectively. Volunteers familiarized them-selves with the laboratory environment and the experimental protocol that they would undergo. On the day of the test they were questioned concerning their health condi-tion, if they had had a good night’s sleep and if they had followed the instructions given on the day before, such as no ingestion of alcoholic drinks or of stimulants (coffee, tea, soft drinks), and had done no extenuating physical activity.
The experimental protocol was always applied at the same time of day (morning) taking into consideration the circadian influ-ences on the responses of the variables stud-ied. The volunteers were studied during the
follicular phase of the menstrual cycle in order to avoid the influence of hormonal fluctuation on the cardiorespiratory variables measured.
Before the measurements the volunteers rested for 15 min in the supine position, and their arterial blood pressure and HR were measured to determine whether their basal condition was satisfactory for the experi-ment.
Experimental protocol
The experiment consisted of a continu-ous physical exercise test of the ramp type (CT-R), performed on a cycloergometer with electromagnetic braking (Quinton Corival 400, Seattle, WA, USA), at a bench height regulated to permit knee flexing of 5 to 10 degrees. The volunteers were instructed not to perform an isometric contraction while holding onto the handlebar of the bicycle and to maintain the pedaling rate at 60 rpm. The CT-R consisted of 1 min pre-testing in the sitting resting position on the cycloer-gometer followed by a 4-min warm-up pe-riod at 4 W and workload increases of 10 to 20 W/min, until physical exhaustion. Work-load increases were determined for each vol-unteer according to the formula proposed by Wasserman et al. (2).
During the test, the volunteers were moni-tored on the CM5 lead. ECG and HR were obtained beat-to-beat from a one-channel heart monitor (TC 500, ECAFIX, São Paulo, SP, Brazil) and processed with an analog-to-digital converter Lab PC + (National Instru-ments, Co., Austin, TX, USA), which acts as an interface between the heart monitor and a microcomputer (Pentium III 500 MHz). The ECG signal was recorded in real time after analog-to-digital conversion at a sampling rate of 500 Hz, and the R-R intervals (ms) and HR (bpm) were calculated on a beat-to-beat basis using specific software (22).
Ventilatory and metabolic variables, such as V
.
O2, carbon dioxide output (V.
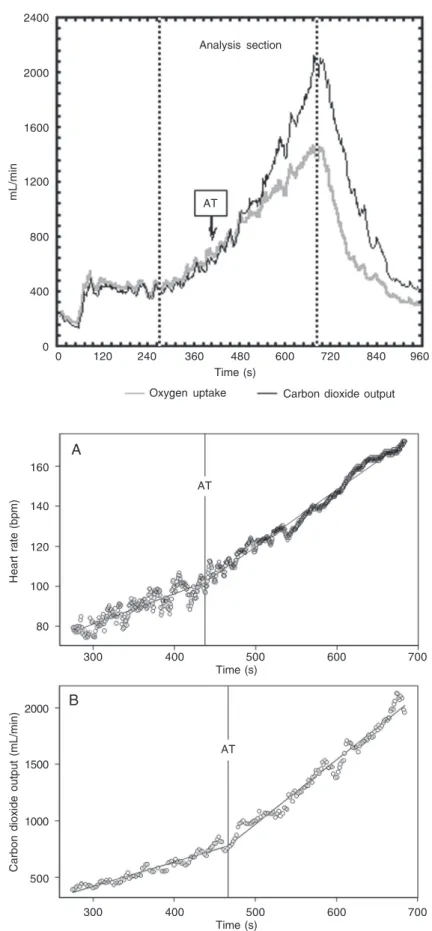
Figure 1. Oxygen uptake and carbon dioxide output responses during the continuous physical exercise dy-namic test of the ramp type by one of the volunteers studied. The arrow indicates the time (s) of the dispro-portionate increase in carbon dioxide output relative to oxygen uptake in the anaerobic threshold (AT) determi-nation.
Figure 2. Illustration of the break point determined by the mathematical linear bi-segmental model applied to heart rate (A) and carbon dioxide output (B) data, ob-tained during a continuous physical exercise test of the ramp type by one volunteer whose data are presented in Figure 1. AT = anaerobic threshold.
mL/min
2400
120
Time (s)
Oxygen uptake Carbon dioxide output
240 360 480 600 720 840 960
0 2000
1600
1200
800
400
0
AT
Analysis section
AT
AT 160
140
120
100
80
Heart rate (bpm)
300 400 500 600 700
Time (s)
300 400 500 600 700
Time (s) 2000
1500
1000
500
Carbon dioxide output (mL/min)
A
minute ventilation (V
.
E), were obtained breath-to-breath during the CT-R by means of a system measuring expired gases (CPX/ D, Medical Graphics, St. Paul, MN, USA) which was calibrated before each test. These variables were subsequently processed and calculated as moving means after every eight respiratory cycles for better kinetic observa-tion of the responses during the exercise.Anaerobic threshold determination
Two methods were employed for AT determination at CT-R: 1) graphic visual analysis of the responses of ventilatory and metabolic variables was performed by three observers with proven experience in the ap-plication of the procedures used for this purpose. The criterion for AT quantification was graphic observation at the time of a disproportionate V
.
CO2 increase in relation to the V.
O2 linear increase on the ergospirom-eter monitor (Figure 1). This method was based on the V-slope method described by Wasserman and McIlroy (5) which is con-sidered to be a gold standard method. The AT value was considered as the mean of the data obtained from the analysis by three observers. 2) The mathematical model of bi-segmental linear regression was implementedusing Hinkley’s algorithm applied to HR
(MMH-HR) and V
.
CO2 (MMH-V.
CO2) data. This permits analysis of the V
.
CO2 and HR data series by the maximum similarity meth-od that identifies the moment when a change occurs in the response pattern of V.
CO2 and HR data collected during CT-R performance, and detects the intersection point of two phases adjustment of data sets (Figure 2).The section selected for subsequent AT determination was identical for both meth-ods. It was set from the beginning of the responses of ventilatory and metabolic vari-ables to power output increments to the res-piratory compensation point (RCP) or up to the end of exercise when the volunteer did not present the RCP.
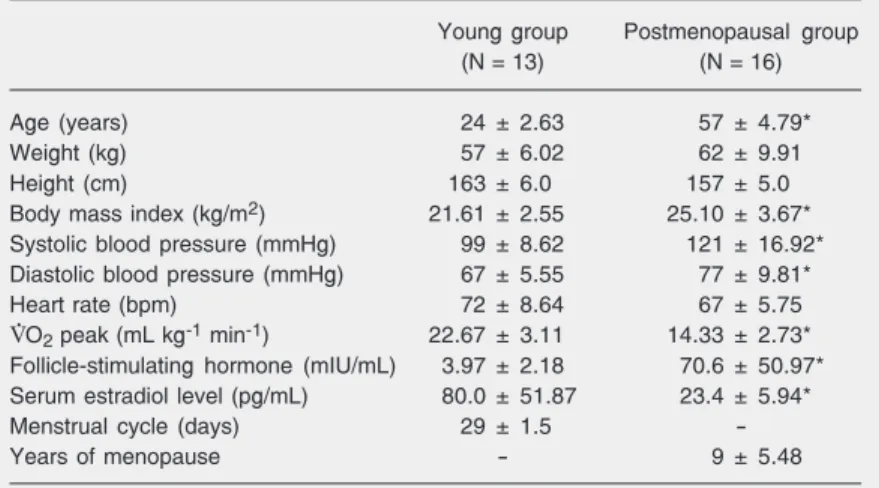
Table 1. Age and anthropometric and clinical characteristics of the subjects studied.
Young group Postmenopausal group
(N = 13) (N = 16)
Age (years) 24 ± 2.63 57 ± 4.79*
Weight (kg) 57 ± 6.02 62 ± 9.91
Height (cm) 163 ± 6.0 157 ± 5.0
Body mass index (kg/m2) 21.61 ± 2.55 25.10 ± 3.67*
Systolic blood pressure (mmHg) 99 ± 8.62 121 ± 16.92*
Diastolic blood pressure (mmHg) 67 ± 5.55 77 ± 9.81*
Heart rate (bpm) 72 ± 8.64 67 ± 5.75
V.O2 peak (mL kg-1 min-1) 22.67 ± 3.11 14.33 ± 2.73* Follicle-stimulating hormone (mIU/mL) 3.97 ± 2.18 70.6 ± 50.97*
Serum estradiol level (pg/mL) 80.0 ± 51.87 23.4 ± 5.94*
Menstrual cycle (days) 29 ± 1.5
-Years of menopause - 9 ± 5.48
Data are reported as means ± SD. V.O2 = oxygen uptake. *P < 0.05 compared to the young group (unpaired t-test). Statistical analysis
The power output (W), HR (bpm), V
.
O2 (mL kg-1 min-1), V.
O2 (mL/min), V
.
CO2 (mL/ min), and V
.
E (L/min) at AT determined by the two methods used did not present normal distribution upon application of the Kolmo-gorov-Smirnov test. Therefore, the non-para-metric Friedman repeated measurements, Dunn’s post-hoc and Spearman correlation tests were used, with the level of signifi-cance set at 5%.Results
No significant differences in weight, height and HR at rest were observed be-tween groups. The subjects of the young group had lower body mass index, blood pressure and a higher V
.
O2 peak than middle-aged group (P < 0.05; Table 1).Power output, HR, V
.
O2, V.
CO2, and V
.
E data, at the AT level, did not differ signifi-cantly (P > 0.05) between the graphic visual,MMH-HR and MMH-V
.
CO2 methods, forboth young and postmenopausal groups (Table 2).
segmental linear regression model (20) was used to identify the moment at which these changes occur.
The principle of the proposed mathemati-cal model is based on the fitting of two straight lines by maximum similarity of data sets analyzed. The first straight line adjusted by the algorithm represents the variable be-havior at the beginning of physical effort up to the AT. The second straight line corre-sponds to the change in variable response pattern, which is characterized by an in-crease in its rate of variation until RCP or physical exhaustion. Thus, the break point of the two straight lines was considered to be the moment when AT occurs (Figure 2).
The mathematical model used in the pres-ent investigation allowed the determination of the break point in the dynamic behavior pattern of V
.
CO2 and HR data that occurs during physical exercise, as well as its inter-actions with the level of physical effort.The aging physiologic process is marked with several changes that influence indi-vidual aerobic capacity (23,24), as well as the magnitude of the cardiorespiratory re-sponse to exercise. Due to this process, our objective was to evaluate whether these al-terations could affect the accuracy of the proposed mathematical model for women in any age group.
Mathematical model-HR
Oxygen uptake (mL kg
-1 min -1)
20
18
16
14
12
10
8
6
rs = 0.75 P < 0.05
rs = 0.78 P < 0.05
Mathematical model
-17
15
11
9
7
5 13
7.5 8.5 9.5 10.5 11.5 12.5 13.5 14.5
Oxygen uptake (mL kg-1 min-1) Graphic visual analysis
7.5 8.5 9.5 10.5 11.5 12.5 13.5 14.5
Oxygen uptake (mL kg-1 min-1) Graphic visual analysis
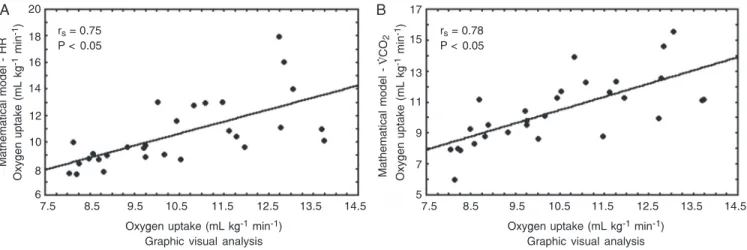
Figure 3. Correlation of the oxygen uptake data obtained by the graphic visual method with the mathematical model applied to heart rate (HR, in A) and carbon dioxide output (V.CO2, in B) for the subjects as a whole (Spearman correlation test).
Table 2. Cardiorespiratory parameters at the anaerobic threshold determined by a graphic visual method (VM) and by the mathematical model of Hinkley’s bi-segmental linear regression applied to heart rate HR) and carbon dioxide output
(MMH-V.CO2) data for the young and postmenopausal groups.
Group VM MMH-HR MMH-V.CO2
Young (N = 13)
Power output (W) 51 41 44
Heart rate (bpm) 115 110 113
V.O2 (mL kg-1 min-1) 11.76 10.46 11.18
V.O2 (mL/min) 661 591 628
V.CO2 (mL/min) 640 550 576
V.E (L/min) 18.9 16.8 17.8
Postmenopausal (N = 16)
Power output (W) 33 37 37
Heart rate (bpm) 103 108 104
V.O2 (mL kg-1 min-1) 9.10 9.36 9.29
V.O2 (mL/min) 584 628 605
V.CO2 (mL/min) 579 617 581
V.E (L/min) 18.3 20.6 19.4
Data are reported as medians. V.O2 = oxygen uptake; V.CO2 = carbon dioxide output;
V.E = minute ventilation.
P > 0.05 (Friedman repeated measurements and post hoc Dunn test).
standard method and the MMH applied to HR (rs = 0.75) and V
.
CO2 (rs = 0.78) data for the subjects as a whole (N = 29; Figure 3).
Discussion
Changes in cardiorespiratory response pattern during dynamic exercise are medi-ated by muscle metabolic activity (2). Hinkley’s mathematical algorithm of the
bi-A B
V
. CO
2
Mathematical model - HR
Oxygen uptake (mL kg
-1 min -1)
Oxygen uptake (mL kg
The comparison analysis of AT values determined by visual and mathematical meth-ods showed a good fit in detection of the break point in response pattern of V
.
CO2 and HR in relation to time, for both young and postmenopausal groups, because the power output, HR, V.
O2, V.
CO2, andV
.
E values ob-tained at AT determined by visual method were similar to the mathematical model.
For analysis of the correlation between the methods used, the two groups of volun-teers were studied as a whole. The analysis of V
.
O2 data (mL kg-1 min-1) showed a statis-tically significant correlation between the gold standard method and the bi-segmental linear regression mathematical model when applied to the HR (rs = 0.75) and V.
CO2 (rs = 0.78) data.
Thus, our findings showed that the math-ematical model was adequate for AT deter-mination in sedentary healthy women. Other studies from our laboratory found that the ventilatory AT (gold standard method) was very close to the AT determined by the autoregressive integrated moving average model applied to middle-aged healthy men (10).
Studies that compare the analysis of ven-tilation and metabolic variables by trying to determine the index of these variables that best corresponds to AT estimated by the blood lactate method are available in the literature (6,7,16,25-27). Other studies have identified AT using non-invasive methods
by analysis of cardiorespiratory variables, developing mathematical models applied to V
.
CO2, such as multi-segmental linear re-gression (18) and linear and linear-quadratic bi-segmental regressions (8).Conconi et al. (3) presented a pioneering proposal to verify the relationship between running speed and loss of HR linearity in runners for AT determination. Nevertheless, this method was not able to determine the AT, but it permitted the quantification of RCP. After that, other investigators con-ducted research based on Conconi’s study in order to improve the analytical methodolo-gies, using the third-order curvilinear re-gression method (19) and mathematical mo-del of linear adjustment of HR data (12,13). The mathematical model used in the pres-ent study showed to be a promising tool for AT determination, since it constitutes a non-invasive, objective and semi-automatic meth-od. Furthermore, it decreases the variations of human acuity evoked by graphic visual analysis, optimizing the process for the de-termination of this physiological parameter. The results of this study showed that the mathematical linear regression bi-segmen-tal model can be used for AT identification based on V
.
CO2 data as well as on HR re-sponse. This method permits AT determina-tion in clinics and consulting rooms by anal-ysis of HR, which is a simple and easily obtained variable, permitting an optimiza-tion of this process.References
1. Beaver WL, Wasserman K, Whipp BJ. A new method for detecting anaerobic threshold by gas exchange. J Appl Physiol 1986; 60: 2020-2027.
2. Wasserman K, Hansen JE, Sue D, Whipp BJ, Casaburi R. Prin-ciples of exercise testing and interpretation. 4th edn. Philadelphia: Williams & Wilkins; 1999.
3. Conconi F, Ferrari M, Ziglio PG, Droghetti P, Codeca L. Determina-tion of the anaerobic threshold by a noninvasive field test in runners. J Appl Physiol 1982; 52: 869-873.
4. Owles WH. Alterations in the lactic acid content of the blood as a
result of light exercise, and associated changes in the CO2 -combin-ing power of the blood and in the alveolar CO2 pressure. J Physiol 1930; 69: 214-237.
5. Wasserman K, McIlroy MB. Detecting the threshold of anaerobic metabolism in cardiac patients during exercise. Am J Cardiol 1964; 14: 844-852.
gas exchange indices for estimating the anaerobic threshold. J Sport Sci Med 2005; 4: 29-36.
8. Crescêncio JC, Martins LE, Murta LO Jr, Antloga CM, Kozuki RT, Santos MD, et al. Measurement of anaerobic threshold during dy-namic exercise in healthy subjects: Comparison among visual anal-ysis and mathematical models. Comput Cardiol 2003; 30: 801-804. 9. Soler AM, Folledo M, Martins LE, Lima-Filho EC, Gallo JL. Anaero-bic threshold estimation by statistical modelling. Braz J Med Biol Res 1989; 22: 795-797.
10. Maraes VR, Silva E, Catai AM, Novais LD, Moura MA, Oliveira L, et al. Identification of anaerobic threshold using heart rate response during dynamic exercise. Braz J Med Biol Res 2005; 38: 731-735. 11. Ribeiro JP, Fielding RA, Hughes V, Black A, Bochese MA, Knuttgen
HG. Heart rate break point may coincide with the anaerobic and not the aerobic threshold. Int J Sports Med 1985; 6: 220-224.
12. Hofmann P, Bunc V, Leitner H, Pokan R, Gaisl G. Heart rate thresh-old related to lactate turn point and steady-state exercise on a cycle ergometer. Eur J Appl Physiol Occup Physiol 1994; 69: 132-139. 13. Bunc V, Hofmann P, Leitner H, Gaisl G. Verification of the heart rate
threshold. Eur J Appl Physiol Occup Physiol 1995; 70: 263-269. 14. Silva FM, Silva Filho AC, Murta LO Jr, Lavrador MA, Marães VR,
Moura MA, et al. Identification of anaerobic threshold during dynam-ic exercise in healthy men using Kolmogorov-Sinai Entropy. Comput Cardiol 2005; 32: 731-734.
15. Viitasalo JT, Luhtanen P, Rahkila P, Rusko H. Electromyographic activity related to aerobic and anaerobic threshold in ergometer bicycling. Acta Physiol Scand 1985; 124: 287-293.
16. Mateika JH, Duffin J. Coincidental changes in ventilation and elec-tromyographic activity during consecutive incremental exercise tests. Eur J Appl Physiol Occup Physiol 1994; 68: 54-61.
17. Glass C, Knowlton RG, Sanjabi PB, Sullivan JJ. The effect of exercise induced glycogen depletion on the lactate, ventilatory and electromyo-graphic thresholds. J Sports Med Phys Fitness 1997; 37: 32-40.
18. Orr GM, Green HJ, Hughson RL, Bennetett GW. A computer linear regression model to determine ventilatory anaerobic threshold. J Appl Physiol 1982; 52: 1349-1352.
19. Kara M, Gokbel H, Bediz C, Ergene N, Ucok K, Uysal H. Determina-tion of the heart rate deflecDetermina-tion point by the Dmax method. J Sports Med Phys Fitness 1996; 36: 31-34.
20. Hinkley DV. Inference about the intersection in two-phase regres-sion. Biometrika 1969; 56: 495-504.
21. American Heart Association. Exercise testing and training of appar-ently health individuals. A handbook for physicians. Dallas: Ameri-can Heart Association; 1972.
22. Silva E, Catai AM, Trevelin LC, Guimarães JO, Silva LP Jr, Silva LMP, et al. Design of a computerized system to evaluate the cardiac function during dynamic exercise. Phys Med Biol 1994; 39: 409 (Abstract).
23. Schiller BC, Casas YG, Desouza CA, Seals DR. Maximal aerobic capacity across age in healthy Hispanic and Caucasian women. J Appl Physiol 2001; 91: 1048-1054.
24. Weise SD, Grandjean PW, Rohack JJ, Womack JW, Crouse SF. Acute changes in blood lipids and enzymes in postmenopausal women after exercise. J Appl Physiol 2005; 99: 609-615.
25. Wasserman K, Whipp BJ, Koyl SN, Beaver WL. Anaerobic threshold and respiratory gas exchange during exercise. J Appl Physiol 1973; 35: 236-243.
26. Caiozzo VJ, Davis JA, Ellis JF, Azus JL, Vandagriff R, Prietto CA, et al. A comparison of gas exchange indices used to detect the an-aerobic threshold. J Appl Physiol 1982; 53: 1184-1189.