INTRAPOPULATION FIXATION INDEX DYNAMICS IN
FINITE POPULATIONS WITH VARIABLE OUTCROSSING RATES
Alexandre Siqueira Guedes Coelho1; Roland Vencovsky2*
1
Depto. de Genética - USP/ESALQ, C.P. 83 - 13400-970 - Piracicaba, SP - Brasil. 2
CAPES scholar.
*Corresponding author <rvencovs@esalq.usp.br>
ABSTRACT: The intrapopulation fixation index ( f ) is inversely related to the outcrossing rate (t). Results obtained from data on molecular markers of natural populations have shown that these values are highly variable, even when measured in the same group of individuals. It is thus suggested that factors besides those described in Wright’s genetic equilibrium must be operating. Using simulated data sets this study shows that the finite size condition of a population is sufficient to spread the estimated f values along a range at equilibrium, as opposed to keeping them at the theoretical equilibrium point. The variation in outcrossing rates can amplify this range considerably. Correlation between estimated f values obtained from different loci in this condition showed to be negatively related to the outcrossing rates, and positively related to the variance of these rates along generations. The finite size of populations associated to small fluctuations in t
mean values over time may explain the usually reported high variation among estimated f values of different loci.
Key words: population genetics, inbreeding, computer simulation
DINÂMICA DO ÍNDICE DE FIXAÇÃO INTRAPOPULACIONAL EM
POPULAÇÕES FINITAS COM TAXAS VARIÁVEIS DE
FECUNDAÇÃO CRUZADA
RESUMO: O fato de que os valores do índice de fixação intrapopulacional ( f ) e os das taxas de fecundação cruzada (t) mantém uma estreita relação entre si é amplamente conhecido. Resultados das análises de marcadores moleculares em populações naturais têm demonstrado uma elevada variação destes valores para locos diferentes avaliados em uma mesma população, sugerindo que outros fatores, além daqueles descritos no modelo de equilíbrio genético de Wright devem estar operando. Pelo uso de simulações, demonstra-se neste trabalho que a condição finita de uma população é suficiente para que os valores estimados de f passem a se estabilizar ao longo de um intervalo de variação e não mais em um único ponto. Demonstra-se ainda que variações nas taxas de fecundação cruzada ao longo das gerações amplificam substancialmente a magnitude deste intervalo. A correlação entre os valores estimados de f obtidos de locos diferentes nestas condições mostrou-se dependente dos valores das taxas de fecundação cruzada e da magnitude da variância destas taxas entre gerações, podendo ser nula sob condições de panmixia e taxas constantes. A condição finita das populações associada a pequenas flutuações na taxa média de fecundação cruzada de diferentes gerações, condições tipicamente encontradas na natureza, podem explicar as discrepâncias entre os valores estimados de f de locos diferentes, comumente reportadas na literatura. Há possibilidade de que a magnitude da variância entre os valores estimados de f de diferentes locos forneça uma estimativa do número efetivo de indivíduos reprodutivamente ativos em uma dada população.
Palavras-chave: genética de populações, endogamia, simulação computacional
INTRODUCTION
In very large populations, reproducing by panmixis, in the absence of selection, migration and mu-tation, the allele and genotype frequencies are kept in equilibrium, and do not change along generations, keep-ing a relation described by (Crow & Kimura, 1970):
= =
v u uv
u uu
p p P
p P
2
2
in which: pu is the frequency of allele u; Puu is the fre-quency of the homozygous genotype for allele u; Puv is the frequency of heterozygous genotype for the u and v
alleles. These relations are known as the Hardy-Weinberg law and were postulated independently by G. H. Hardy and W. Weinberg in 1908.
panmixis. Relationships among allele and genotype fre-quencies in this case are altered and are modified to:
− = − + = ) 1 ( 2 ) 1 ( 2 f p p P f p p p P v u uv u u u uu
in which f is the intrapopulation fixation index (Wright, 1951; 1965). These relations are known as the Wright equi-librium relations and assume great importance in the genetic characterization of natural populations, since they provide not only an indicator parameter of the degree of structure of the genetic variability at the individual level, but also a method to obtain outcrossing rate estimates in natural con-ditions, given a single generation data set (Fyfe & Bailey, 1951). This is possible because of the fact that under Wright’s equilibrium conditions the f and t values keep a relation that may be expressed by (Bennet & Binet, 1956):
t t f + − = 1 1
The extensive use of this knowledge, however, was delayed until the development of genotype evalua-tion techniques at the molecular level, carried out along the last years. The development of molecular marker tech-niques along the last 30 years, and notably during the last 20 years, resulted in an actual revolution in the capacity of genotype evaluation under natural conditions. These techniques allowed the use of a much broader variety of species in genetic studies in contrast to the use of a few model species in the past.
Papers reporting the genetic characterization of natural populations are now abundant, many of which providing highly variable estimates for the intrapopula-tion fixaintrapopula-tion index obtained from informaintrapopula-tion on differ-ent loci. In this respect, one must recognize that varia-tion among different populavaria-tions/species reflect different population structures and reproductive strategies that evolved under different ecological pressures (Loveless & Hamrick, 1984). On the other hand, variation in the same population along generations or over different loci, must reflect different aspects of its dynamic, being then a con-sequence of the demographic stochastic process and ge-netic drift (Gillespie, 1998).
The present paper evaluates, through computer simulation, the effects resulting from the finite condition of populations and those resulting from variation in the outcrossing rates, along generations and among individu-als of a given generation, over the estimated values of the intrapopulation fixation index. Information herein pro-duced might be valuable for the development of meth-ods that would allow a better characterization of the dy-namics of the genetic properties of populations, and of their implications in the recognition of better conserva-tion and management strategies.
METHODOLOGY
In a way to allow the simulation and evaluation of a diverse set of conditions, a computer program (available from the authors) based on the Delphi/Pas-cal language was developed. Computer simulations were carried out using the following algorithm: 1. attribute to each of the L lociof the N individuals a given geno-type; 2. identify an individual at random (i); 3. attribute to the outcrossing rate a given value (t); 4. generate a random number from a [0, 1] uniform distribution (x); 5. if x<t, obtain a second random individual (j), if not, take j=i; 6. for each of the L loci, take one allele at random from i and combine it with a randomly taken allele from j; 7. repeat 2 to 6 steps N times, providing the N individuals that will constitute the next tion; 8. repeat step 7 for the number of desired genera-tions.
Initial genotypes were obtained from expected genotype frequencies under Hardy-Weinberg equilib-rium, considering two equally frequent alleles per locus. Data were obtained after 20 generations, when Wright’s equilibrium conditions prevail. The effects of the fol-lowing factors were evaluated: a) population size; b) variation in the generation mean outcrossing rate; c) variation among the outcrossing rates of different indi-viduals from a given generation.
The effects of the variation of the outcrossing rates, both among individuals from the same generation and among different generations, were evaluated admit-ting that the outcrossing rate is a Beta distributed ran-dom variable (t), restricted to the [0, 1] interval, display-ing a Beta density function given by:
1 1 ) 1 ( ) ( ) ( ) ( ) ( − − − Γ Γ + Γ
= α β
β α
β α
φ t t t
in wich: Γ(⋅)is the gamma function and α and β are dis-tribution parameters, being α>0 and β>0.
Mean and variance of t are then given, respec-tively, by: β α α + = t ) 1 ( ) ( ) (
2 + +
+ = β α β α αβ t Var
correspond-ing density functions would represent a behavior hardly found in the nature, in which the most likely val-ues of t would be the extreme ones, simultaneously. For each simulated case, the α and β values were obtained from the mean and variance of t values using the rela-tions:
t t Var
t t
− − =
) (
] 1 [
2
α
β
=
α
−
α
t
Simulated values for the Beta distribution were generated following a procedure adapted from Dagpunar (1988).
Considering the magnitude of the evaluated popu-lations, the intrapopulation fixation index values were estimated using the traditional expression:
h H h f ~
~ ~
ˆ = −
in which: h~ is the expected heterozygosity under Hardy-Weinberg equilibrium obtained directly from sample ob-served allele frequencies and H~ is the sample observed heterozygosity.
RESULTS AND DISCUSSION
Considering the dynamics of the fixation index under the different simulated conditions, the estimated values of f (
f
ˆ
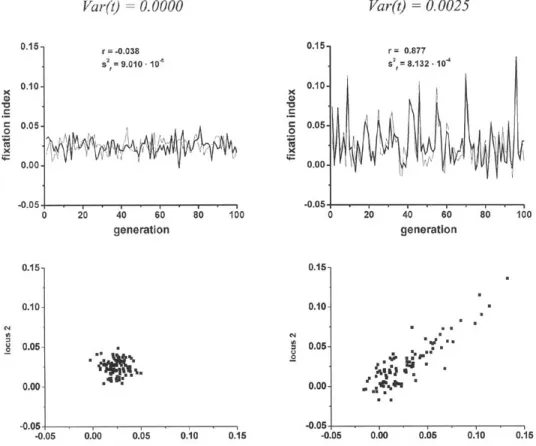
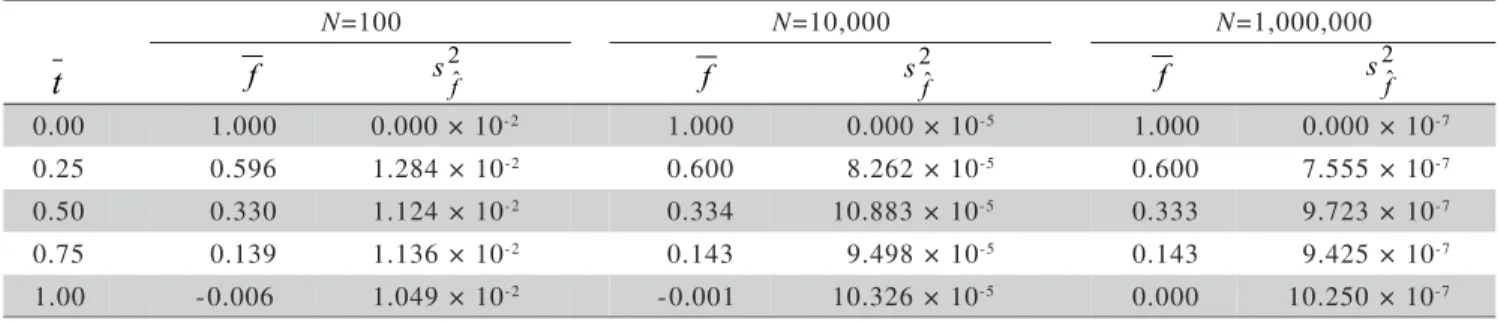
) reach the equilibrium condition rather quickey, this condition being represented in certain cases by an interval of variation and not anymore by a single value (Figures 2, 3 and 4). Thef
ˆ
values obtained showed an increasing magnitude of variation for decreas-ing population sizes, exception bedecreas-ing made to the simu-lation carried out with t=0.00. Variation in mean outcross-ing rates along different generations also noticeably in-fluenced the dynamic off
ˆ
values obtained in simulations. The magnitude of variation off
ˆ
showed to be positively associated to variation in t values. On the other hand, situ-ations in which the outcrossing rates were variable only among individuals of the same generation, the mean val-ues kept constant along generations and with a popula-tion size of 1,000,000 individuals, did not result in a de-tectable variation off
ˆ
values along generations.Variation of outcrossing rates (t) along genera-tions resulted in a stronger effect on the behavior of
f
ˆ
values than that derived from variation of t among dif-ferent individuals (Tables 1, 2 and 3). The weaker
ence of the variation of outcrossing rates among individu-als from the same generation over the dynamic of
f
ˆ
val-ues along generations should, however, be considered carefully. Once the effect of the variation of mean out-crossing rates along generations over the behavior off
ˆ
values is recognized, one should consider that for small population sizes, variation of t values at individual level might considerably contribute to the increment in t value oscillation, and in this case, it would result in an indirect effect on the variance of
f
ˆ
values.The detected variation in
f
ˆ
values does not in-clude that derived from statistical sampling: resulted from the fact that only a portion of the actual population was evaluated. In this sense, even in situations in which the evaluation of every individual of a given population is possible, an oscillation in thef
ˆ
values from different loci along generations must be expected, resulting from the instability of the outcrossing rates and from the events of genetic sampling of gametes.Figure 5 shows the observed probability distribu-tions for the intrapopulation fixation index values
obtained along generations in populations of 10,000 individuals, with different outcrossing rates. These distributions, obtained with constant outcrossing rates among individuals and generations, exhibit strong simi-larity with Beta probability density functions defined for the interval (0, N), with means equal to the simulated
t values and variances given by the same expression of sampling variance of tˆ, reported by Vencovsky (1994): ) ˆ ( ) 1 ( 4 ) ˆ (
4Var f
f t Var + = with ) 1 ( 2 ) 2 )( 1 ( ) 2 1 ( ) 1 ( ) ˆ ( 2 u u p Np f f f N f f f Var − − − + − − =
The probability density function of interest, ex-pressed in terms of f is given by:
Table 2 - Mean ( f ) and variance (s2fˆ) of estimated values for the intrapopulation fixation index along 500 generations in populations with varying mean outcrossing rates along generations (N=1,000,000).
f s2fˆ f
2 ˆ
f
s f 2ˆ
f s
t
) t ( r aV =0.000025 Var(t)=0.0025 Var(t)=0.025
5 0 .
0 0.904 29.864×10⁻⁶ 0.889 32.314×10⁻⁴ -
-0 5 .
0 0.333 12.773×10⁻⁶ 0.334 11.726×10⁻⁴ 0.336 12.773×10⁻²
5 9 .
0 0.026 7.492×10⁻⁶ 0.024 5.724×10⁻⁴ -
-Table 3 - Mean (f ) and variance (s2ˆf ) of estimated values for the intrapopulation fixation index along 500 generations in populations with varying outcrossing rates among individuals (N=1,000,000).
) t ( r a
V =0.000025 Var(t)=0.0025 Var(t)=0.025
5 0 .
0 0.905 2.035×10⁻⁷ 0.905 2.295×10⁻⁷ -
-0 5 .
0 0.333 9.387×10⁻⁷ 0.333 9.839×10⁻⁷ 0.333 9.663×10⁻⁷
5 9 .
0 0.026 9.849×10⁻⁷ 0.026 8.999×10⁻⁷ -
-f s2fˆ f
2 ˆ
f
s f 2ˆ
f s
t
N=100 N=10,000 N=1,000,000
0 0 .
0 1.000 0.000×10⁻² 1.000 0.000×10⁻⁵ 1.000 0.000×10⁻⁷
5 2 .
0 0.596 1.284×10⁻² 0.600 8.262×10⁻⁵ 0.600 7.555×10⁻⁷
0 5 .
0 0.330 1.124×10⁻² 0.334 10.883×10⁻⁵ 0.333 9.723×10⁻⁷
5 7 .
0 0.139 1.136×10⁻² 0.143 9.498×10⁻⁵ 0.143 9.425×10⁻⁷
0 0 .
1 -0.006 1.049×10⁻² -0.001 10.326×10⁻⁵ 0.000 10.250 ×10⁻⁷
Table 1 - Mean (f ) and variance (s2fˆ) of estimated values for the intrapopulation fixation index along 500 generations in finite populations with varying sizes (N) and different values for the outcrossing rates
f s2fˆ f
2 ˆ
f
s f 2ˆ
f s
Figure 2 - Intrapopulation fixation index in populations of different sizes, with different outcrossing rates, along 520 generations. 2 1 1 ˆ 1 ˆ 1 1 ˆ 1 ˆ 1 ) ˆ 1 ( 2 ) ( ) ( ) ( ) ˆ ( f N N f f f f f + − Γ Γ + Γ = + − − + − − + − β α β α β α β α φ with parameters: α + − − ⋅ − + − = + − f f f Var N f f N f f 1 1 ) ˆ ( 4 ) 1 ( ) 1 ( 1 1 1 2 2 α α β − − + = f f N 1 ) 1 (
The usefulness of the (0, N) interval derives from the fact that the
f
ˆ
values are allowed to be negative, im-plying in tˆ values that may be larger than 1.0 (apparent outcrossing rate).val-Figure 3 - Intrapopulation fixation index in populations exhibiting variation in outcrossing rates along generations, with mean given by t and variance Var(t), along 520 generations (N=1,000,000).
ues may be described using a Beta probability density function, defined by parameters that are function of the population size, of the f value correspondent to the ac-tual outcrossing rate, and of the allele frequencies.
Figure 6 shows the observed probability distribu-tions for the
f
ˆ
values obtained from 10,000 loci evalu-ated in a single generation, in populations of 1,000 indi-viduals, with different outcrossing rates. The figure also shows the probability density functions defined in a simi-lar manner to that used to describe the behavior off
ˆ
val-ues in different generations. The fact that the dynamic be-havior off
ˆ
values in both cases, a given locus along generations and different loci in a given generation, pre-sented a similar pattern suggests that data from loci in a single generation might provide information on the single locus dynamics along generations. Although data from different generations are rare in the literature, informa-tion from different loci is not and could thus provide an estimate of the effective number of individuals reproduc-tively active in a given population (N).Figure 7 shows the predicted and observed val-ues for the variance of
f
ˆ
among loci in different situa-tions. In practical terms, the variance off
ˆ
values being considered does not include the effects resulting from sta-tistical sampling, and would be better interpreted as a variance component off
ˆ
values associated to different loci, than as a mean square of the sample estimated val-ues forf
ˆ
.Estimates of the correlation coefficient between
f
ˆ
values obtained from two different loci along gen-erations are represented in Figure 8. The magnitude of the correlation betweenf
ˆ
values in different loci along generations decreases with the increase in the outcross-ing rate, reachoutcross-ing values close to zero under panmixis. Variation in the mean outcrossing rate along generations results in a detectable positive effect over this correla-tion (Figure 9). In a simulacorrela-tion of a populacorrela-tion with 10,000 individuals, with a constant outcrossing rate of 0.95, the correlation off
ˆ
values of different loci along generations were close to zero. Inclusion of variance in mean outcrossing rates along generations increased the variance off
ˆ
values 9 fold, at the same time that it in-creased the correlation off
ˆ
from different loci to ap-proximately 0.88. Although the correlation betweenf
ˆ
values estimated for different loci increases with the variance of outcrossing rates along generations the het-erogeneity among
f
ˆ
values from different loci in a given generation does not change, since it results from the genetic sampling resulting from the finite condition of populations.From a practical point of view, the finite condi-tion of populacondi-tions might result in a pronounced varia-tion in the intrapopulavaria-tion fixavaria-tion index values esti-mated from different loci in a given generation. Small populations, with dozens of individuals, and variation in outcrossing rates are conditions ubiquitous in nature Figure 5 - Probability distributions of intrapopulation fixation index values in populations of 10,000 individuals, with different outcrossing rates, along 10,000 generations. Corresponding Beta probability density functions are also shown (dotted lines).
t = 1.00
t = 0.50
t = 0.75
and the resulting effect of these factors might be con-tributing to the high level of variation of
f
ˆ
values among loci evaluated in the same population, commonly reported in the literature.As a final comment, the difficulty in performing a good characterization of intrapopulation fixation index values by the use of point estimates should be stressed. The dynamic behavior of this parameter at equilibrium would certainly be better characterized by a probabilis-tic approach in which probabilities of occurrence of different
f
ˆ
values could be evaluated. Without any loss of information, an approach of such a nature would al-low not only to evaluate thef
ˆ
mean value, but also its instability, that seems to be ubiquitous in natural condi-tions.Figure 8 - Observed correlation coefficient values among fˆ values from different locialong 1,000 generations of populations with different values for the mean and variance of the outcrossing rates along generations (N=10,000).
Figure 7 - Predicted and observed values for the variance of intrapopulation fixation index values [Var(fˆ )]among loci, evaluated in a single generation of populations with different outcrossing rate values (t), allele frequencies (p) and population sizes (N). Values obtained from 10,000 loci.
p = 0.50 t = 0.75
Figure 6 - Probability distributions of intrapopulation fixation index values from 10,000 loci in a population of 1,000 individuals, with different values of outcrossing rates. Corresponding Beta probability density functions are also shown (dotted lines). t = 1.00
t = 0.50
t = 0.75
Figure 9 - Intrapopulation fixation index dynamics in two loci in two populations of the same size (N=10,000), same outcrossing rate (tˆ=0.95) but different values for the variance of t along generations.
CONCLUSIONS
The estimated values of the intrapopulation fixa-tion index exhibit a dynamic behavior under equilibrium, that is strongly influenced by population size and varia-tion in mean outcrossing rates along generavaria-tions. The in-stability of
f
ˆ
values from different loci evaluated in the same population, commonly reported in the literature, might be explained by the finite condition of natural populations.REFERENCES
BENNET, J.H.; BINET, F.E. Association between Mendelian factors with mixed selfing and random mating. Heredity, v.10, p.51-55, 1956. CROW, J.F.; KIMURA, M. An introduction to population genetics theory.
New York: Harper & Row, 1970. 591p.
DAGPUNAR, J. Principles of random variate generation. Oxford: Clarendon Press, 1988. 248p.
FYFE, J.L.; BAILEY, N.T.J. Plant breeding studies in leguminous forage crops: I. Natural cross-breeding in winter beans. Journal of Agricultural Science, v.41, p.371-378, 1951.
GILLESPIE, J.H. Population genetics: a concise guide. Baltimore: Johns Hopkins University Press, 1998. 184p.
LOVELESS, M.D.; HAMRICK, J.L. Ecological determinants of genetic structure in plant populations. Annual Review of Ecology and Systematics, v.15, p.65-95, 1984.
VENCOVSKY, R. Variance of an estimate of outcrossing rate. Brazilian Journal of Genetics, v.17, p.349-351, 1994.
WRIGHT, S. Systems of mating. Genetics, v.6, p.111-178, 1921. WRIGHT, S. Coefficients of inbreeding and relationship. American
Naturalist, v.56, p.330-338, 1922.
WRIGHT, S. The genetical structure of populations. Annals of Eugenics, v.15, p.323-354, 1951.
WRIGHT, S. The interpretation of population structure by F-statistics with special regard to systems of mating. Evolution, v.19, p.395-420, 1965.
![Figure 1 - Simulated probability distributions for different values attributed to the mean ( t ) and to the variance [Var(t)] of the outcrossing rates.](https://thumb-eu.123doks.com/thumbv2/123dok_br/15859328.662397/3.918.154.788.557.1067/figure-simulated-probability-distributions-different-attributed-variance-outcrossing.webp)


![Figure 7 - Predicted and observed values for the variance of intrapopulation fixation index values [Var( f ˆ )] among loci, evaluated in a single generation of populations with different outcrossing rate values (t), allele frequencies (p) and population s](https://thumb-eu.123doks.com/thumbv2/123dok_br/15859328.662397/8.918.195.714.511.728/predicted-intrapopulation-evaluated-generation-populations-outcrossing-frequencies-population.webp)