INTRODUCTION
Modern studies of the classification of the honey-bees of Africa stem from the work of Kerr and Portugal-Araújo (1958). They recognised five subspecies, the most widely spread of which was A. m. scutellata (then called A. m. adansonii) and its various ecotypes (Kerr, 1992). De-tails of the nomenclatural history are reviewed by Ruttner (1988) and Daly (1991). Further analyses of the bees fall-ing under the A. m. scutellata umbrella of distribution were provided by Smith (1961) and in a series of studies summarised by Ruttner (1988). Recently the large mor-phometric databases on the honeybees of Africa that had been separately assembled in Germany and South Africa were amalgamated into a single unit of considerable depth and breadth and the apifauna of the whole continent mor-phometrically re-analysed (Hepburn and Radloff, 1998).
In general terms the results of Hepburn and Radloff (1998) supported many of the interpretations of Ruttner (1988), but some not unexpected refinements were made. One was the fact that all of the bees classified as A. m. scutellata on the basis of multivariate morphometric analy-ses by Ruttner (1988) resolved into two distinct morpho-clusters in the analysis of Hepburn and Radloff (1998). The honeybees of southern Ethiopia and northern Kenya formed one A. m. scutellata-like morphocluster that dif-fered from the morphocluster to the south, in Zimbabwe and South Africa (whence the Neotropical introductions originated). These morphoclusters were simply designated as “scutellata 1” and “scutellata 2” pending the acquisi-tion of addiacquisi-tional data.
This A. m. scutellata problem is interesting for sev-eral different reasons. Firstly, the geographic distribution of the Ruttner A. m. scutellata was more or less rectan-gular, extending the length of the eastern highlands of Africa from South Africa to Ethiopia (hence the name “highland bee”). In the Hepburn-Radloff analysis this rect-angle was somewhat crimped or narrow-waisted where A. m. adansonii pushed eastwards from Zambia and A. m. litorea westwards from Mozambique. Secondly, in both the Ruttner (1988) and Hepburn and Radloff (1998) stud-ies there was an extreme paucity of material then avail-able from northwestern Mozambique, western Zimbabwe, eastern Botswana and southern Kenya. Tanzania, Malawi and Lesotho were simply dataless gaps. Thirdly, until now there was not sufficient information on the original mother populations of the bees subsequently introduced into the Neotropics, from which reasonable inference might have been made.
It has recently been established for the African api-fauna that morphocluster formation resulting from mul-tivariate analyses can be very sensitive to sample dis-tance intervals as well as to levels of statistical confi-dence employed to make interpretations (Radloff and Hepburn, 1998). Very recently a considerable amount of new material has been obtained from Botswana, Zim-babwe, Malawi, Lesotho and Tanzania. Here we report the results of fresh analyses of a considerably (30%) enhanced database to re-examine the honeybee popula-tions of the A. m. scutellata group, their various charac-teristics, biogeographical relationships and areas of hybridisation with neighbouring populations of other
sub-Population structure and morphometric variance of the
Apis mellifera
scutellata
group of honeybees in Africa
Sarah Radloff1 and Randall Hepburn2
Abstract
The honeybee populations of Africa classified as Apis mellifera scutellata Lepeletier were analysed morphometrically using
multivari-ate statistical techniques. The collection consisted of nearly 15,000 worker honeybees from 825 individual colonies at 193 localities in east Africa, extending from South Africa to Ethiopia. Factor analysis established one primary cluster, designated as A. m. scutellata.
Morphocluster formation and inclusivity (correct classification) are highly sensitive to sampling distance intervals. Within the A. m. scutellata region are larger bees associated with high altitudes of mountain systems which are traditionally classified as A. m. monticola
Smith, but it is evident that these bees do not form a uniform group. Variance characteristics of the morphometric measurements show domains of significantly different local populations. These high variance populations mostly occur at transitional edges of major climatic and vegetational zones, and sometimes with more localised discontinuities in temperature. It is also now evident that those A. m. scutellata introduced nearly fifty years ago into the Neotropics were a particularly homogenous sample, which exhibited all the traits
expected in a founder effect or bottleneck population.
Departments of 1Statistics, and 2Zoology and Entomology, Rhodes University, Grahamstown, 6140, South Africa.
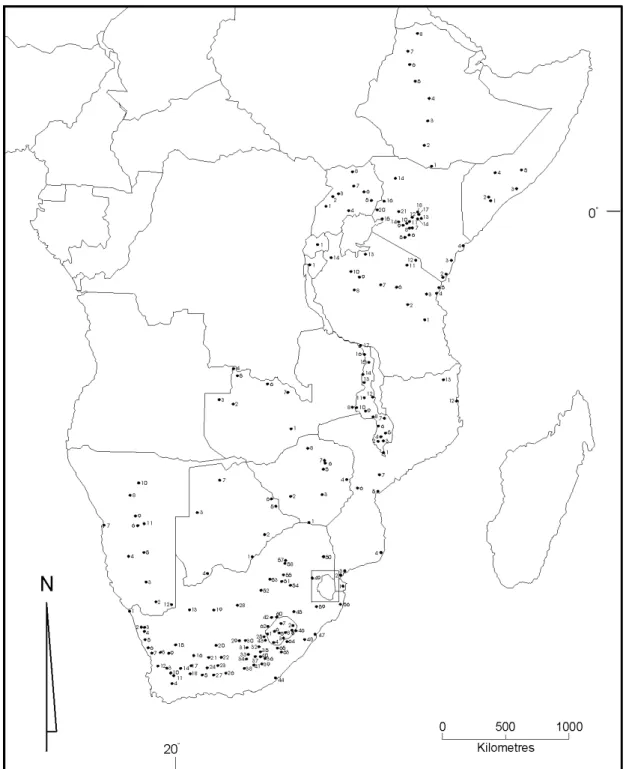
Figure 1 - Map of eastern Africa indicating the localities at which worker honeybees were collected for analysis in our study. Note that for each country the numbering system for localities always begins with “1” to avoid overlapping. Map numbers for each country correspond to the geographical and biological information in Table I.
species. The geographical area investigated was the whole of Ruttner’s original A. m. scutellata rectangle, extending from South Africa to Ethiopia (Figure 1). Also, to the extent possible, Palaeotropical A. m. scutellata were compared with recent Neotropical (but non-mor-phometric) data to estimate the extent of bottlenecking (expression of a founder effect of the original introduc-tions) in the latter region.
MATERIAL AND METHODS
this material was recently published (Hepburn and Radloff, 1998). In the interim, important new collections of honey-bee workers were obtained from Botswana, Lesotho, Malawi, Tanzania and Zimbabwe, that increased the original database by 30%. This material has been measured, inserted into the database and a fresh multivariate morphometric analysis of the honeybees of the eastern side of Africa made.
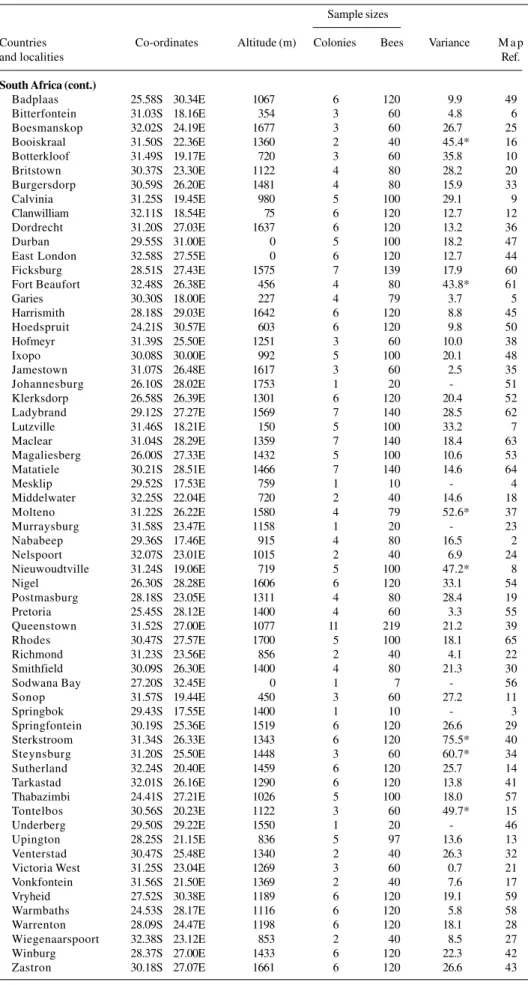
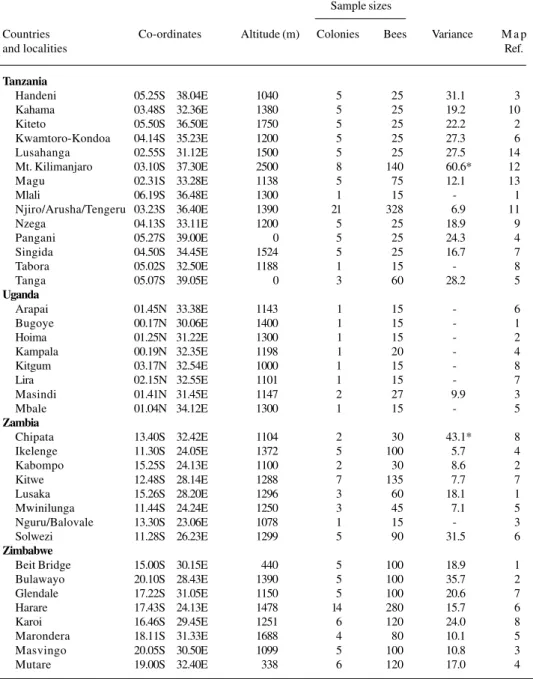
All of the worker bees used in the study were sampled from the colonies of small-scale, fixed-site beekeepers at 193 localities, extending the length of eastern Africa from South Africa to Ethiopia (Table I). While “captive”
colo-nies were often sampled it must be understood that the bees are simply attracted to empty hives from the wild population. Bees in Africa are very rarely transported and bee breeding is virtually non-existent. Thus, the samples used in the analysis constitute authentic subsamples of the wild population whence they came. Morphometric measurements were usually taken on 20 worker bees per colony from a variable number of colonies per locality, total colonies sampled being 825 individual colonies. A total of 14,973 individual worker honeybees was mea-sured morphometrically (Table I).
Continued on next page Table I - Distribution of the localities, co-ordinates, altitudes, sample sizes and intercolonial
variances of worker honeybees analysed morphometrically. Sample sizes
Countries Co-ordinates Altitude (m) Colonies Bees Variance M a p
and localities Ref.
Botswana
Francistown 21.11S 27.32E 900 4 80 13.7 5
Gaborone 24.45S 25.55E 1000 5 100 6.2 1
Ghanzi 21.39S 21.39E 1137 1 20 - 3
Irdbridge 19.15S 23.30E 945 1 8 - 7
Mahalapye 23.05S 26.51E 1000 5 100 16.5 2
Tsabong 26.28S 21.35E 1034 1 20 - 4
Tutume 20.26S 27.02E 1100 4 80 23.2 6
Burundi
Bujumbura 03.22S 29.19E 800 6 120 74.3* 1
Ethiopia
Addis Ababa 09.03N 38.42E 2842 9 180 22.6 4
Adi Arkay 13.35N 37.57E 950 5 100 36.8 8
Agere Maryam 05.13N 38.20E 2000 5 100 18.5 2
Bahir Dar 11.33N 37.25E 2400 5 100 12.7 6
Debre Markos 10.19N 37.41E 2000 5 99 13.3 5
Gonder 12.39N 37.29E 2121 6 120 22.1 7
Mega 04.02N 31.19E 2100 5 98 18.9 1
Shashemene 07.13N 38.33E 1800 6 119 18.1 3
Kenya
Aberdare 00.35S 36.38E 2666 1 20 - 9
Chepkitale 00.58N 34.33E 2986 1 10 - 16
Chiokariga 00.17S 37.55E 762 3 45 41.4* 8
Chuka 00.20S 37.38E 1401 1 15 - 7
Gatimbi 00.01N 37.39E 1584 2 30 37.0 17
Kaaga 00.04N 37.39E 1600 3 45 3.2 18
Kerio Valley 02.24N 36.21E 450 1 20 - 19
Kimbo/Meru 00.06N 37.29E 2437 12 177 28.9 10
Kimititi 00.34N 34.34E 1534 6 90 28.0 20
Kiria 00.12S 37.39E 1371 1 15 - 13
Lake Baringo 00.38N 36.03E 980 1 12 - 21
Lamu 02.15S 40.50E 0 1 20 - 4
Malindi 03.14S 40.05E 0 1 20 - 3
Meru (township) 00.04N 37.39E 1554 4 65 42.2* 11
Mombasa 04.04S 39.40E 0 1 20 - 2
Mt. Elgon 01.07N 34.31E 4320 8 125 28.2 15
Mt. Kenya 00.32S 37.28E 1320 5 77 38.6* 14
Nairobi 01.17S 36.50E 1576 3 56 27.9 6
Nakuru 00.16S 36.04E 1860 1 20 - 14
Nanyuki 00.05S 37.10E 2220 2 40 44.0* 12
Ngong Hills 01.24S 36.38E 2460 13 195 20.4 5
Shimba Hill 04.12S 39.28E 448 1 13 - 1
Soudu Kisumu 00.08S 34.47E 1151 1 20 - 15
Table I - Continued
Sample sizes
Countries Co-ordinates Altitude (m) Colonies Bees Variance M a p
and localities Ref.
Lesotho
Ha Lejone 29.10S 28.27E 1479 2 40 24.4 7
Mafeteng 29.48S 27.13E 1616 7 140 24.5 1
Marakabei 29.32S 28.08E 1977 7 140 35.9 6
Mokhotlong 29.35S 29.17E 2133 6 120 30.5 2
Quachasnek 30.06S 20.40E 1878 7 140 14.6 3
Quiteng 30.25S 27.42E 1578 7 140 12.1 4
Sani Top 29.33S 29.13E 2496 1 20 - 9
Semonkong 29.50S 28.05E 2200 7 140 33.0 8
Thaba-Tseka 29.31S 28.35E 2286 3 60 23.4 5
Malawi
Blantyre 15.46S 35.00E 1000 1 15 - 4
Chikwawa 16.02S 34.54E 100 6 120 25.4 2
Chilinda 10.36S 33.48E 2600 26 420 45.6* 16
Chitipa 09.41S 33.19E 1300 6 120 31.2 17
Dedza 14.20S 34.24E 1600 6 120 17.3 8
Kasungu 13.04S 33.29E 1070 7 135 16.4 11
Lilongwe 13.58S 33.49E 1067 1 15 - 9
Mangochi 14.30S 35.15E 450 6 120 7.0 7
Mbalachanda 11.21S 33.22E 1336 6 120 21.3 14
Mchinji 13.48S 32.53E 1200 6 120 17.2 10
Mzimba 11.55S 33.39E 1330 6 120 10.1 13
Nkhotakota 12.55S 34.19E 500 6 120 39.2* 12
Nsanje 16.47S 35.15E 70 6 120 20.2 1
Ntcheu 14.49S 34.38E 1100 6 120 25.6 6
Rumphi 10.59S 33.50E 1050 6 120 27.3 15
Thyolo 16.04S 35.09E 900 6 120 28.3 3
Zomba 15.22S 35.22E 950 6 120 18.7 5
Mozambique
Beira 19.49S 34.52E 0 3 60 6.2 5
Inhaminga 18.24S 35.00E 327 1 11 - 7
Manhica 25.23S 32.49E 61 1 13 - 3
Marrocuene 26.15S 32.40E 10 1 12 - 2
Maxixe 23.51S 35.21E 76 1 18 - 4
Mueda 11.40S 39.31E 439 1 20 - 9
Pemba 13.00S 40.29E 0 1 16 - 8
Salamanga 26.29S 32.40E 45 1 12 - 1
Sussendenga 20.35S 33.09E 585 1 8 - 6
Namibia
Ariamsvlei 28.08S 19.05E 774 4 80 31.8 12
Karasburg 28.00S 18.43E 1013 5 89 23.6 2
Katima Molilo 17.27S 24.10E 946 1 15 - 1
Keetmanshoop 26.36S 18.08E 1773 4 80 14.0 3
Maltahöhe 24.50S 17.00E 1340 1 18 - 4
Mariental 24.36S 17.59E 1180 4 80 23.8 5
Okahandja 21.59S 16.58E 1439 4 80 17.6 9
Otavi 19.39S 17.20E 1414 2 30 6.9 10
Otjiwarongo 20.29S 16.36E 1565 6 110 46.6* 8
Seeis 22.29S 17.39E 1610 1 3 - 11
Swakopmund 22.40S 14.34E 0 4 80 25.9 7
Windhoek 22.43S 17.06E 1779 5 100 17.3 6
Rwanda
Kigali 01.56S 30.04E 1400 4 65 16.3 1
Somalia
Afgoi 02.07N 45.02E 86 1 20 - 3
Baidoa 03.04N 43.48E 485 3 60 15.4 4
Buale 01.14N 42.36E 63 4 80 51.3* 1
Bulo Burti 03.50N 45.33E 158 2 40 23.9 5
Dugiuma 01.20N 42.34E 63 2 40 9.8 2
South Africa
Aberdeen 32.29S 24.03E 732 3 44 9.9 26
Alexander Bay 28.40S 16.30E 0 6 120 29.9 1
Aliwal North 30.45S 26.45E 1317 6 120 40.6* 31
Table I - Continued
Continued on next page South Africa (cont.)
Badplaas 25.58S 30.34E 1067 6 120 9.9 49
Bitterfontein 31.03S 18.16E 354 3 60 4.8 6
Boesmanskop 32.02S 24.19E 1677 3 60 26.7 25
Booiskraal 31.50S 22.36E 1360 2 40 45.4* 16
Botterkloof 31.49S 19.17E 720 3 60 35.8 10
Britstown 30.37S 23.30E 1122 4 80 28.2 20
Burgersdorp 30.59S 26.20E 1481 4 80 15.9 33
Calvinia 31.25S 19.45E 980 5 100 29.1 9
Clanwilliam 32.11S 18.54E 75 6 120 12.7 12
Dordrecht 31.20S 27.03E 1637 6 120 13.2 36
Durban 29.55S 31.00E 0 5 100 18.2 47
East London 32.58S 27.55E 0 6 120 12.7 44
Ficksburg 28.51S 27.43E 1575 7 139 17.9 60
Fort Beaufort 32.48S 26.38E 456 4 80 43.8* 61
Garies 30.30S 18.00E 227 4 79 3.7 5
Harrismith 28.18S 29.03E 1642 6 120 8.8 45
Hoedspruit 24.21S 30.57E 603 6 120 9.8 50
Hofmeyr 31.39S 25.50E 1251 3 60 10.0 38
Ixopo 30.08S 30.00E 992 5 100 20.1 48
Jamestown 31.07S 26.48E 1617 3 60 2.5 35
Johannesburg 26.10S 28.02E 1753 1 20 - 51
Klerksdorp 26.58S 26.39E 1301 6 120 20.4 52
Ladybrand 29.12S 27.27E 1569 7 140 28.5 62
Lutzville 31.46S 18.21E 150 5 100 33.2 7
Maclear 31.04S 28.29E 1359 7 140 18.4 63
Magaliesberg 26.00S 27.33E 1432 5 100 10.6 53
Matatiele 30.21S 28.51E 1466 7 140 14.6 64
Mesklip 29.52S 17.53E 759 1 10 - 4
Middelwater 32.25S 22.04E 720 2 40 14.6 18
Molteno 31.22S 26.22E 1580 4 79 52.6* 37
Murraysburg 31.58S 23.47E 1158 1 20 - 23
Nababeep 29.36S 17.46E 915 4 80 16.5 2
Nelspoort 32.07S 23.01E 1015 2 40 6.9 24
Nieuwoudtville 31.24S 19.06E 719 5 100 47.2* 8
Nigel 26.30S 28.28E 1606 6 120 33.1 54
Postmasburg 28.18S 23.05E 1311 4 80 28.4 19
Pretoria 25.45S 28.12E 1400 4 60 3.3 55
Queenstown 31.52S 27.00E 1077 11 219 21.2 39
Rhodes 30.47S 27.57E 1700 5 100 18.1 65
Richmond 31.23S 23.56E 856 2 40 4.1 22
Smithfield 30.09S 26.30E 1400 4 80 21.3 30
Sodwana Bay 27.20S 32.45E 0 1 7 - 56
Sonop 31.57S 19.44E 450 3 60 27.2 11
Springbok 29.43S 17.55E 1400 1 10 - 3
Springfontein 30.19S 25.36E 1519 6 120 26.6 29
Sterkstroom 31.34S 26.33E 1343 6 120 75.5* 40
Steynsburg 31.20S 25.50E 1448 3 60 60.7* 34
Sutherland 32.24S 20.40E 1459 6 120 25.7 14
Tarkastad 32.01S 26.16E 1290 6 120 13.8 41
Thabazimbi 24.41S 27.21E 1026 5 100 18.0 57
Tontelbos 30.56S 20.23E 1122 3 60 49.7* 15
Underberg 29.50S 29.22E 1550 1 20 - 46
Upington 28.25S 21.15E 836 5 97 13.6 13
Venterstad 30.47S 25.48E 1340 2 40 26.3 32
Victoria West 31.25S 23.04E 1269 3 60 0.7 21
Vonkfontein 31.56S 21.50E 1369 2 40 7.6 17
Vryheid 27.52S 30.38E 1189 6 120 19.1 59
Warmbaths 24.53S 28.17E 1116 6 120 5.8 58
Warrenton 28.09S 24.47E 1198 6 120 18.1 28
Wiegenaarspoort 32.38S 23.12E 853 2 40 8.5 27
Winburg 28.37S 27.00E 1433 6 120 22.3 42
Zastron 30.18S 27.07E 1661 6 120 26.6 43
Sample sizes
Countries Co-ordinates Altitude (m) Colonies Bees Variance M a p
The same nine characters used in previous studies of honeybees in Africa were measured (Crewe et al., 1994; Radloff, 1996; Hepburn and Radloff, 1998). Their Ruttner (1988) numbers are given in parentheses as follows: length of cover hair on tergite 5 (1), width of wax plate on stern-ite 3 (11), transverse length of wax plate on sternstern-ite 3 (13), pigmentation of scutellum (35), pigmentation of scutellar plate (36), pigmentation of tergite 2 (32), wing angle B4 (22), wing angle N23 (30) and wing angle O26 (31).
Multivariate statistical analysis of the colony mean data included factor analysis and linear discriminant analysis. The latter procedure may provide an overly op-timistic estimate of the probability of correct
classifi-cation. A jackknife procedure was therefore carried out that classified each colony into a group with the highest a posteriori probability, according to the discrimina-tion funcdiscrimina-tions computed from all the data except the colony being classified (Lachenbruch and Mickey, 1968). Wilk’s lambda test was used to compare multi-variate population means between groups. The tion of the statistic was approximated by the F distribu-tion (Mardia et al., 1979). Levene’s F-statistic for test-ing the equality of the variances between groups was also used in the analysis. For the morphometric analyses, colony means, standard deviations and covariances of the morphometric characters were analysed.
Tanzania
Handeni 05.25S 38.04E 1040 5 25 31.1 3
Kahama 03.48S 32.36E 1380 5 25 19.2 10
Kiteto 05.50S 36.50E 1750 5 25 22.2 2
Kwamtoro-Kondoa 04.14S 35.23E 1200 5 25 27.3 6
Lusahanga 02.55S 31.12E 1500 5 25 27.5 14
Mt. Kilimanjaro 03.10S 37.30E 2500 8 140 60.6* 12
Magu 02.31S 33.28E 1138 5 75 12.1 13
Mlali 06.19S 36.48E 1300 1 15 - 1
Njiro/Arusha/Tengeru 03.23S 36.40E 1390 21 328 6.9 11
Nzega 04.13S 33.11E 1200 5 25 18.9 9
Pangani 05.27S 39.00E 0 5 25 24.3 4
Singida 04.50S 34.45E 1524 5 25 16.7 7
Tabora 05.02S 32.50E 1188 1 15 - 8
Tanga 05.07S 39.05E 0 3 60 28.2 5
Uganda
Arapai 01.45N 33.38E 1143 1 15 - 6
Bugoye 00.17N 30.06E 1400 1 15 - 1
Hoima 01.25N 31.22E 1300 1 15 - 2
Kampala 00.19N 32.35E 1198 1 20 - 4
Kitgum 03.17N 32.54E 1000 1 15 - 8
Lira 02.15N 32.55E 1101 1 15 - 7
Masindi 01.41N 31.45E 1147 2 27 9.9 3
Mbale 01.04N 34.12E 1300 1 15 - 5
Zambia
Chipata 13.40S 32.42E 1104 2 30 43.1* 8
Ikelenge 11.30S 24.05E 1372 5 100 5.7 4
Kabompo 15.25S 24.13E 1100 2 30 8.6 2
Kitwe 12.48S 28.14E 1288 7 135 7.7 7
Lusaka 15.26S 28.20E 1296 3 60 18.1 1
Mwinilunga 11.44S 24.24E 1250 3 45 7.1 5
Nguru/Balovale 13.30S 23.06E 1078 1 15 - 3
Solwezi 11.28S 26.23E 1299 5 90 31.5 6
Zimbabwe
Beit Bridge 15.00S 30.15E 440 5 100 18.9 1
Bulawayo 20.10S 28.43E 1390 5 100 35.7 2
Glendale 17.22S 31.05E 1150 5 100 20.6 7
Harare 17.43S 24.13E 1478 14 280 15.7 6
Karoi 16.46S 29.45E 1251 6 120 24.0 8
Marondera 18.11S 31.33E 1688 4 80 10.1 5
Masvingo 20.05S 30.50E 1099 5 100 10.8 3
Mutare 19.00S 32.40E 338 6 120 17.0 4
Sample sizes
Countries Co-ordinates Altitude (m) Colonies Bees Variance M a p
and localities Ref.
RESULTS
Mesolevel analysis
In a factor analysis of the morphometric characters of worker honeybees from 825 colonies with a mean sam-pling distance resolution of 210 km, three factors with eigenvalues greater than one were isolated: factor 1, pig-mentation of the scutellum (35) and abdominal tergite 2 (32); factor 2, width and length of wax plate on sternite 3 (11) and (13), factor 3, angles of wing venation N23 (30) and O26 (31). These factors accounted for 58.8% of the variance in the data. The factor loadings for each charac-ter had absolute values greacharac-ter than 0.65. The graph of the factor scores from factors 1 and 2 showed one main morphocluster with colonies from Ethiopia scattered to the left of the main cluster (Figure 2). This result con-firms that the honeybees of Ethiopia have darker pigmen-tation than those from the A. m. scutellata subspecies (Radloff and Hepburn, 1997).
A stepwise discriminant analysis using the colony means of the morphometric characters confirmed the separation of the colonies from Ethiopia from the main cluster. The linear discriminant functions obtained using the most discrimina-tory characters classified 90.2% (four misclassified) of the colonies from Ethiopia correctly with a posteriori probabili-ties 0.69 ≤ P ≤ 0.98 for six colonies and P = 1.0 for the re-maining colonies and 96.2% (27 misclassified) of the colo-nies correctly from the rest of the data set. A jackknife procedure gave the same classification results except that one more colony from the main group was misclassified into the group from Ethiopia. A significant difference was found between the means of the two groups (Λ = 0.52 with 7,1,752 d.f., F = 93.97 with 7,746 d.f., P < 0.0001). The variances of the factor 1 scores and factor 2 scores were used to test for the homogeneity of the colony variance at each locality. A significant difference was found between the intercolonial variances over all the localities (Levene’s test, F = 2.54 with 184,551 d.f., P < 0.0001). Those localities with significantly higher variances are indicated in Table I.
Figure 2 - The graph of the factor scores from factors 1 and 2 shows a large morphocluster to the right of the figure that represents Apis mellifera scutellata
bees, and the small cluster to the left represents the honeybees of Ethiopia.
Distance effects
The length of the transect may obscure small biomet-ric groups if the between-group variation is considerably larger than the within-group variation (Table II). When the colonies from Ethiopia alone were analysed, three morphoclusters were isolated, namely A. m. jemenitica, A. m. bandasii and A. m. scutellata (Radloff and Hepburn, 1997). Also when the colonies from Kenya, Uganda, Tan-zania, Rwanda, Burundi, Malawi, Zambia and northern Mozambique were analysed, three morphoclusters were delineated, namely A. m. scutellata, A. m. monticola (black) from the high altitudes of Kenya and Tanzania and A. m. monticola (yellow) from the high altitudes of the Nyika Plateau, Malawi (Hepburn and Radloff, 1998).
Because the honeybees at higher altitudes in other African mountains (e.g. Mt. Kilimanjaro, Mt. Kenya) dif-fer from lower surrounding populations in both size and pigmentation (Ruttner, 1988), these traits were specifically examined for the honeybees of the Nyika Plateau in Malawi. In this case, there was a significant correlation between size (1) and altitude, that is, bees become increasingly larger with increasing altitude (r = 0.59, P < 0.0001). There was also a significant correlation between pigmentation (35) and altitude; with increasing altitude the bees became lighter in colour (r = 0.44, P < 0.0001).
Finally, statistical comparisons of high-altitude bees from the Nyika Plateau with others from Mt. Kilimanjaro (Tanzania), Mt. Kenya (Kenya) and the Drakensberg moun-tains revealed all of these bees to be larger in size than
their lower-altitude counterparts (F = 10.75 with 4,297 d.f., P < 0.0001); however, the honeybees of the Drakensberg and Nyika Plateau are significantly lighter in colour than the more northerly mountain bees (F = 109.00 with 3,82 d.f., P < 0.0001).
Variance characteristics
The intercolonial variance values of the populations sampled are listed in Table I. Only 19 of the 193 localities (about 10%) exhibited statistically significant elevated val-ues of variance. It is of interest to consider the sources of the high variance domains. The intercolonial variance is derived from mean values of whole colonies (between colonies) for each locality (Table I) but it is not immedi-ately obvious what different components give rise to the variance. A plot of those high variance colonies on an intracolonial (within colonies) basis shows that high vari-ance values arise in two different ways. Of 19 high intercolonially variant colonies, 10/19 exhibited a range of variances that statistically yield high variance, but there was no single colony in the locality set which exhibited significantly high within-colony variance (Table III). Thus, for these colonies the localised population was highly het-erogeneous. The remaining 9/19 colonies yielded high in-tercolonial variances because particular individual colonies were themselves highly variant. In fact all nine of this sec-ond group of localities were correlated with hybrid zones based on morphocluster analysis and were indicative of hybridisation. Thus there are two separate origins for high
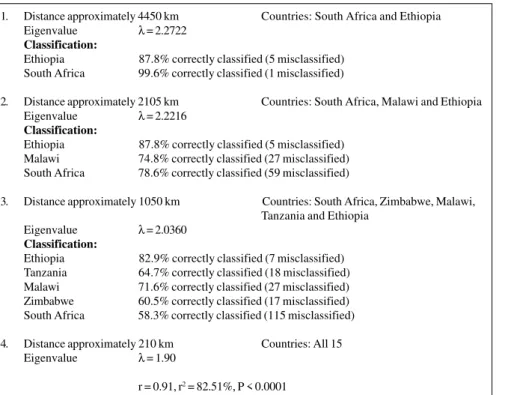
Table II - The effects of sampling distance intervals on morphocluster inclusiveness. 1. Distance approximately 4450 km Countries: South Africa and Ethiopia
Eigenvalue λ = 2.2722
Classification:
Ethiopia 87.8% correctly classified (5 misclassified) South Africa 99.6% correctly classified (1 misclassified)
2. Distance approximately 2105 km Countries: South Africa, Malawi and Ethiopia Eigenvalue λ = 2.2216
Classification:
Ethiopia 87.8% correctly classified (5 misclassified) Malawi 74.8% correctly classified (27 misclassified) South Africa 78.6% correctly classified (59 misclassified)
3. Distance approximately 1050 km Countries: South Africa, Zimbabwe, Malawi, Tanzania and Ethiopia
Eigenvalue λ = 2.0360
Classification:
Ethiopia 82.9% correctly classified (7 misclassified) Tanzania 64.7% correctly classified (18 misclassified) Malawi 71.6% correctly classified (27 misclassified) Zimbabwe 60.5% correctly classified (17 misclassified) South Africa 58.3% correctly classified (115 misclassified) 4. Distance approximately 210 km Countries: All 15
Eigenvalue λ = 1.90
intercolonial variance: those colonies in which the bees are themselves heterogeneous (intracolonial variance) and other colonies where the within-colony variance is not sig-nificantly high but collectively the colonies of bees of the locality are significantly more variant than others from neighbouring localities. Thus, of the 193 colonies of hon-eybees analysed in this way nearly 90% of them are fairly homogeneous as morphocluster entities.
The geographical distributions of these high inter-colonial variances demonstrate distinct patterns. For ex-ample, all of the localities marked with an asterisk in Table I in Burundi, Kenya, Tanzania and Malawi are associated with mountain systems for which the “A. m. monticola-like” bees occur in an archipelago surrounded by the mor-phometrically more uniform and distinct A. m. scutellata. In the case of South Africa, similarly marked variances (except two unexplained cases) all came from the natural hybrid zone between A. m. capensis and A. m. scutellata in mountainous countryside. Those colonies of Zambia and Namibia with high variances are in hybrid zones be-tween A. m. scutellata and A. m. adansonii. Too little in-formation is available on the bees of Somalia (Buale) to even venture comment at this stage.
Those colonies exhibiting statistically high levels of
intercolonial variance between localities could also be re-lated to geophysical parameters. Figure 3 depicts regions of high variance against altitudinal relief in the A. m. scutellata area. It is evident that the majority of high vari-ance localities are associated with areas of greatest rate of altitudinal change throughout eastern Africa. Altitude of course reflects modification of climatic systems and consequential to this are changes in vegetation structure of differing biomes and to the bees themselves (Hepburn et al., 1998).
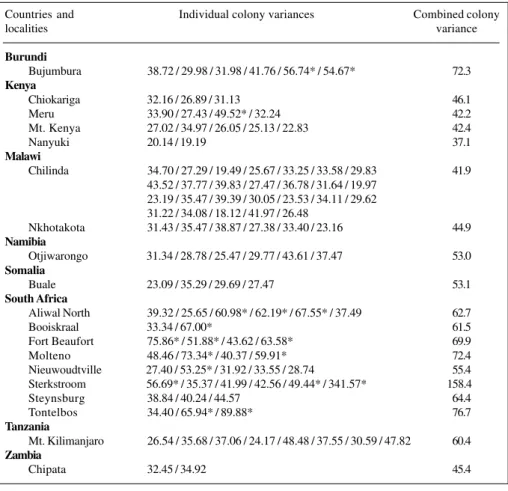
Figure 4 depicts the high variance localities of A. m. scutellata in eastern Africa on a map of the major cli-matic zones of the continent. Here it becomes strikingly evident that high variance is typically associated with re-gions of climatic transition in most instances. Those high variance localities not in such transitional zones are none-theless associated with more localised discontinuities in climate for which there are significant differences in heat and/or cold intensity regimes. Figure 5 depicts the high variance localities against the major vegetation zones of eastern Africa and again it can be seen that the local popu-lations of these bees are associated with edge effects, which are transitional regions between the major biomes. In a final biogeographical composite the regions of Table III - Intracolonial variances of worker honeybees at localities with high intercolonial variances.
Countries and Individual colony variances Combined colony
localities variance
Burundi
Bujumbura 38.72 / 29.98 / 31.98 / 41.76 / 56.74* / 54.67* 72.3
Kenya
Chiokariga 32.16 / 26.89 / 31.13 46.1
Meru 33.90 / 27.43 / 49.52* / 32.24 42.2
Mt. Kenya 27.02 / 34.97 / 26.05 / 25.13 / 22.83 42.4
Nanyuki 20.14 / 19.19 37.1
Malawi
Chilinda 34.70 / 27.29 / 19.49 / 25.67 / 33.25 / 33.58 / 29.83 41.9 43.52 / 37.77 / 39.83 / 27.47 / 36.78 / 31.64 / 19.97
23.19 / 35.47 / 39.39 / 30.05 / 23.53 / 34.11 / 29.62 31.22 / 34.08 / 18.12 / 41.97 / 26.48
Nkhotakota 31.43 / 35.47 / 38.87 / 27.38 / 33.40 / 23.16 44.9
Namibia
Otjiwarongo 31.34 / 28.78 / 25.47 / 29.77 / 43.61 / 37.47 53.0
Somalia
Buale 23.09 / 35.29 / 29.69 / 27.47 53.1
South Africa
Aliwal North 39.32 / 25.65 / 60.98* / 62.19* / 67.55* / 37.49 62.7
Booiskraal 33.34 / 67.00* 61.5
Fort Beaufort 75.86* / 51.88* / 43.62 / 63.58* 69.9
Molteno 48.46 / 73.34* / 40.37 / 59.91* 72.4
Nieuwoudtville 27.40 / 53.25* / 31.92 / 33.55 / 28.74 55.4 Sterkstroom 56.69* / 35.37 / 41.99 / 42.56 / 49.44* / 341.57* 158.4
Steynsburg 38.84 / 40.24 / 44.57 64.4
Tontelbos 34.40 / 65.94* / 89.88* 76.7
Tanzania
Mt. Kilimanjaro 26.54 / 35.68 / 37.06 / 24.17 / 48.48 / 37.55 / 30.59 / 47.82 60.4
Zambia
Chipata 32.45 / 34.92 45.4
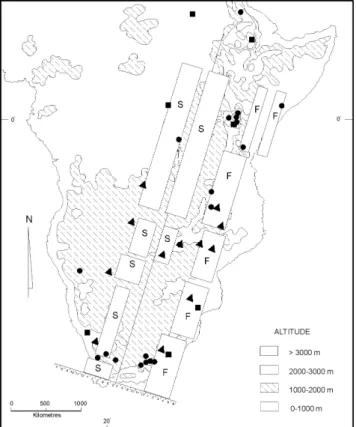
Figure 3 - Relief map of eastern Africa indicating areas (circles) of signifi-cantly high values of morphometric variance within the Apis mellifera scutellata populations. (Map modified from van Chi-Bonnardel, 1973). Tri-angles denote localised regions of high temperature changes, squares denote low temperature discontinuities. Principal reproductive swarming (S) and major flowering (F) periods of the relevant bee flora are indicated to the left and right of the vertical line, respectively. Horizontal scale units are months of the year beginning on both sides of the vertical line with July (month 7) and running through June (month 6) because July is mid-winter and the end of the annual colony cycles. The map is diagrammatic for swarming and flowering as they change with latitude.
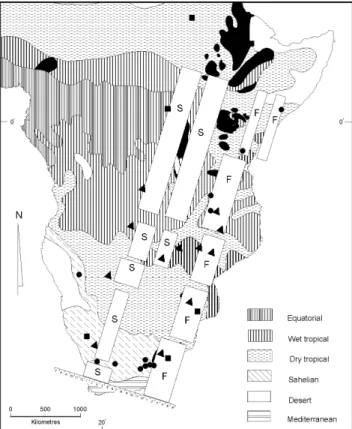
Figure 4 - Map of the regions of high morphometric variance in relation to the major climatic zones of east Africa. Symbols as in Figure 3. (Map modi-fied from van Chi-Bonnardel, 1973).
high variance for the A. m. scutellata populations are illus-trated in terms of localised discontinuities of climate (rapid changes in hot or cold in a small region) and also in rela-tion to the principal swarming seasons and the principal flow-ering periods for the relevant major honeybee flora of east-ern Africa. The scale at the bottom of the map represents months of the year for swarming (left side of vertical line) and for flowering (right side of vertical line) and both are expressed as months of the year beginning with July and end-ing with June (months 7 to 6) because July is the winter end of the annual cycle. The drawing is diagrammatic for an imagi-nary vertical line running north-south through the region so that swarming and flowering are averaged for the eastern part of the continent. Each must be read as running horizontally across the vertical line for any particular latitude in eastern Africa. Seen in this way the honeybee populations of south-ern Africa (8 high variance regions) enjoy more or less equal-ity of flowering periods but a narrower window of reproduc-tive swarming. However, note that swarming and seasonal flowering are geographically related to localised climatic discontinuities which result in ecological instability at the edges. This should in turn lead to selective pressure for a high turnover in gene flow and partially explain the high levels of variance associated with such regions.
DISCUSSION
fac-tor scores (Figure 2) confirm that the honey bees of Ethio-pia are morphometrically distinguishable from all of the other more southerly bees, all of which have been previ-ously defined as A. m. scutellata. Secondly, detailed and localised analyses of the mountain populations of the honeybees of eastern Africa show that they can indeed be differentiated, to a greater or lesser extent, from the A. m. scutellata that surround the mountain archipelago bees. However, it is now evident that the mountain populations themselves can in fact be further differentiated into dif-ferent groups. Because of the lack of precision in the tra-ditional usage of terms such as “subspecies” or “ecotype” we simply note what morphoclusters can be formed and do not assign names to them.
The results of Table II show that the greater the dis-tance between countries, the greater the extent of variation in morphometric characters. As a corollary, the greater the distance between countries, the higher the probability of “correctly” assigning colonies to specific morphoclusters. This conforms exactly with conclusions reached in studies on the effects of sampling distance and variable confidence limits (Radloff and Hepburn, 1998): the greater the distance between samples, the more distinct the morphoclusters.
The significance of the sampling distance interval is clearly demonstrated in analyses of localised regions. For
example, the discriminant analysis of the morphometric characters of the honeybees of eastern Africa unequivo-cally established the occurrence of two distinct morpho-clusters. One morphocluster comprises honeybees living at high altitudes (± 2500 m) on the Nyika Plateau (Malawi) while a second morphocluster comprised all of the bees at altitudes below ± 1600 m throughout Malawi from the bor-ders of Tanzania to Mozambique. Following the system of classification of Ruttner (1988) the lower altitude bees are A. m. scutellata Lepeletier and the high ones A. m. monticola Smith.
The mountain bees of Nyika bear close morphologi-cal similarities to those of other mountains such as Mt. Kenya, Mt. Meru and Mt. Elgon to the north and to others of the more southerly Drakensberg (Hepburn and Radloff, 1998; Radloff and Hepburn, 1998). The Nyika bees are sig-nificantly larger in size than those of lower altitude. How-ever, pigmentation presents some interesting problems. With increasing altitude the southern mountain bees (Nyika and Drakensberg) become more yellow in overall colouration while in the northern mountain bees the trend is to darker colouration with increasing altitude. It is pos-sible that the high mountain bees do in fact constitute a unique subspecies A. m. monticola distinct from A. m. scutellata at lower altitudes as proposed by Ruttner (1988) and Meixner et al. (1989). However, final resolution of this problem will require a critical DNA analysis.
Morphometric variance among colonies of a natu-ral honeybee population can be attributed to two proxi-mate causes. Because queen honeybees are polyandrous (Adams et al., 1977; Neumann et al., 1999, 2000), hon-eybee colonies may consist of several to many patrilines. The effect is that regions of high variance of either or both high intracolonial variance among workers as well as intercolonial variance may occur. However, variance must be seen in the broader context of frequency distri-butions of character states.
The genetics of metric character states such as can be derived from morphometrics of honeybee centres around the analysis of the frequency distribution patterns of variation for it is in terms of variation that primary popu-lation genetic questions can be formulated (Wright, 1969, 1978; Falconer and Mackay, 1997). The basic premise un-derlying the analysis of variation is that it can be partitioned into components of differing probable cause. The relative magnitude of these components determine the genetic prop-erties or structure of populations and the extent of this variation is expressed in terms of variance.
A final comment on the A. m. scutellata that were introduced into the Neotropics can now be made. Kerr (1992) clearly stated where all of this original honeybee livestock originated, principally the Transvaal region of South Africa. It can be noted in the present set of results that the A. m. scutellata bees of that area are extremely homoge-neous and display low variance values, and are uniformly aggressive and virulently invasive. Thus, it can be concluded Figure 5 - Map of regions of high morphometric variance in relation to the
from the analysis of the mother African material alone that those A. m. scutellata that spread through the Neotropics did so on the basis of a founder effect. This conclusion is absolutely compatible with the identical conclusion reached on mitochondrial studies of A. m. scutellata in the Neotropics (Smith et al., 1999; Del Lama, 1999).
ACKNOWLEDGMENTS
We thank Dr P. Neumann for reviewing the manuscript.
RESUMO
Populações africanas de abelhas comuns classificadas como
Apis mellifera scutellata Lepeletier foram analisadas
morfome-tricamente usando-se técnicas estatísticas multivariadas. A população consistia de aproximadamente 15.000 abelhas operárias provenientes de 825 colônias individuais de 193 localidades do leste da África, estendendo-se da África do Sul até a Etiópia. A análise de fatores estabeleceu um agrupamento primário designado A. m. scutellata.
A formação de agrupamento morfológico e a inclusividade (clas-sificação correta) são altamente sensíveis aos intervalos de distância da amostragem. Dentro da região de A. m. scutellata há abelhas
maiores associadas às altas altitudes montanhosas, que são tradicionalmente classificadas como A. m. monticola Smith, mas é
evidente que estas abelhas não formam um grupo uniforme. As características de variação das medidas morfométricas mostram domínios de populações locais significantemente diferentes. Estas populações altamente variáveis ocorrem em sua maioria em margens de transição de zonas climáticas e de vegetação, e algumas vezes com alterações mais localizadas de temperatura. Agora também é evidente que as A. m.scutellata introduzidas há aproximadamente
50 anos na região neotropical constituíam uma amostra particularmente homogênea que exibia todos os caracteres esperados em uma população com efeito fundador ou “gargalo”.
REFERENCES
Adams, J., Rothmann, E.D., Kerr, W.E. and Paulino, Z.L. (1977). Estima-tion of the number of sex alleles and queen matings from diploid male frequencies in a population of Apis mellifera. Genetics86: 583-596.
Crewe, R.M., Hepburn, H.R. and Moritz, R.F.A. (1994). Morphometric analysis of 2 southern African races of honeybees. Apidologie25:
61-70.
Daly, H.V. (1991). Systematics and identification of Africanized honey bees. In: The “African” Honey Bee (Spivak, M., Fletcher, D.J.C. and Breed, M.D., eds.). Westview Press, Boulder, pp. 13-44.
Del Lama, M.A. (1999). Population genetics of the Africanized honeybees from South America. In: Proceedings of the XIII International Con-gress of IUSSI, Adelaide, p. 133.
Falconer, D.S. and Mackay, T.F.C. (1997). Introduction to Quantitative Genetics. Longman, Essex.
Hepburn, H.R. and Radloff, S.E. (1998). Honeybees of Africa. Spinger Verlag, Berlin.
Hepburn, H.R., Radloff, S.E., Brown, R.E., Youthed, C. and Illgner, P. (1998). Production of aerodynamic power in mountain honeybees (Apis mellifera). Naturwissenschaften85: 389-390.
Kerr, W.E. (1992). Abejas Africanas su introduccion y expansion en el continente Americano. Subespecies y ecotipos Africanos. Ind. Apic. 13: 12-21.
Kerr, W.E. and Portugal-Araújo, V. De (1958). Raças de abelhas da Africa.
Garcia de Orta6: 53-59.
Lachenbruch, P. and Mickey, R.M. (1968). Estimation of error rates in discriminant analysis. Technometrics10: 1-11.
Mardia, K.V., Kent, J.T. and Bibby, J.M. (1979). Multivariate Analysis. Academic Press, London.
Meixner, M., Ruttner, F., Koeniger, N. and Koeniger, G. (1989). The moun-tain bees of the Kilimanjaro region and their relation to neighbouring bee populations. Apidologie20: 165-174.
Neumann, P., Moritz, R.F.A. and Van Praagh, J. (1999). Queen mating-frequency in different types of honeybee mating apiaries. J. Apic. Res. 38: 11-18.
Neumann, P., Moritz, R.F.A., Radloff, S.E. and Kryger, P. (2000). Heritability for polyandry in the honeybee (Apis mellifera L.). Heredity (in press).
Radloff, S.E. (1996). Multivariate analysis of selected honeybee popula-tions in Africa. PhD thesis, Rhodes University, Grahamstown.
Radloff, S.E. and Hepburn, H.R. (1997). Multivariate analysis of honey-bees, Apis mellifera Linnaeus (Hymenoptera: Apidae) of the Horn of Africa. Afr. Entomol.5: 57-64.
Radloff, S.E. and Hepburn, H.R. (1998). The matter of sampling distance and confidence levels in the subspecific classification of honeybees,
Apis mellifera L. Apidologie29: 491-501.
Ruttner, F. (1988). Biogeography and Taxonomy of Honeybees. Springer
Verlag, Berlin.
Smith, F.G. (1961). The races of honeybees in Africa. Bee World42: 255-260.
Smith, D.R., Palmer, M.S., Orive, M.E. and Taylor, O.R. (1999). Modeling founder effects in Neotropical African honey bees. In: Proceedings of the XIII International Congress of IUSSI, Adelaide, p. 449. van Chi-Bonnardel, R. (1973). The Atlas of Africa. Jeune Afrique, Paris.
Wright, S. (1969). Evolution and Genetics of Populations. Vol. 2. The Theory of Gene Frequencies. University of Chicago Press, Illinois. Wright, S. (1978). Evolution and Genetics of Populations. Vol. 4. Vari-ability Within and Among Natural Populations. University of Chi-cago Press, Illinois.