ERIC VICTOR DE OLIVEIRA FERREIRA
INDICADORES FISIOLÓGICOS DO STATUS DE NITROGÊNIO EM PLANTAS DE EUCALIPTO
Tese apresentada à Universidade Federal de Viçosa, como parte das exigências do Programa de Pós-Graduação em Solos e Nutrição de Plantas, para obtenção do título de Doctor
Scientiae.
VIÇOSA
ERIC VICTOR DE OLIVEIRA FERREIRA
INDICADORES FISIOLÓGICOS DO STATUS DE NITROGÊNIO EM PLANTAS DE EUCALIPTO
Tese apresentada à Universidade Federal de Viçosa, como parte das exigências do Programa de Pós-Graduação em Solos e Nutrição de Plantas, para obtenção do título de Doctor
Scientiae.
Aprovada: 28 de março de 2013.
Prof. José Leonardo Moraes Gonçalves Prof. Wagner Luiz Araújo
Prof. Leonardus Vergutz Prof. Liovando Marciano da Costa
ii
À memória de meus “pais-avós”, Gumercino e Rosalina, por todos os valores e
ensinamentos de vida a mim repassados.
Dedico
À minha mãe Vicentina de Paula, pelo incentivo e apoio constantes à minha formação.
iii
AGRADECIMENTOS
Em primeiro lugar, a Deus pela vida e por não me deixar desitir nunca dos meus objetivos frente aos obstáculos, dando-me sempre saúde e força para seguir em frente.
À Universidade Federal de Viçosa e ao Programa de Solos e Nutrição de Plantas-UFV, pela oportunidade de realização do curso.
Ao CNPq, à CAPES e ao NUTREE, pelo suporte financeiro. À empresa florestal V&M Tubes por ceder as áreas para o estudo e o auxílio nas coletas das amostras.
Ao meu orientador professor Roberto Ferreira de Novais pelos ensinamentos transmitidos, dedicação, apoio constante ao trabalho e pela prontidão em atender.
Aos estagiários (as) Bruna, Flávia, Greice, Laiany e Tadeu, pelo incondicional auxílio na condução dos experimentos, coletas e análises laboratoriais.
Aos professores coorientadores Nairam Félix de Barros e Ivo Ribeiro da Silva pelas colaborações para o desenvolvimento do trabalho.
Aos professores Fábio DaMatta, Marcelo Loureiro e Wagner Araújo (Fisiologia Vegetal), Cleberson Ribeiro e José Cambraia (Biologia) e Sebastião Tavares (Bioagro) por cederem seus laboratórios para análises e pelas sugestões ao trabalho.
Às bancas de qualificação (Ecila e os profs. Júlio, Mattiello e Nairam) e de defesa da tese (profs. José Leonardo, Leonardus, Liovando e Wagner), pelas críticas e sugestões de melhoria ao trabalho.
A todos os colegas do PPG em Solos e Nutrição de Plantas-UFV, em especial os dos laboratórios de Solos Florestais e Isótopos Estáveis (LIE), os quais muito me ajudaram. Agradeço pela boa convivência e todo o apoio.
A todos os funcionários do Departamento de Solos-UFV, desde professores, técnicos de laboratório, secretárias e faxineiras, sempre muito prestativos.
À Duke University, em nome do prof. Robert Jackson e toda a sua equipe, pela oportunidade de participação no programa de doutorado sanduíche do CNPq (SWE).
À minha esposa Carolina, pela companhia, amor e compreensão nos muitos momentos em que me ausentei em função do trabalho.
À toda minha família, em especial, à minha filha Laura, pelo amor, e ao meu irmão Raphael, pelo companherismo. À minha prima Carol, pelo apoio e incentivo na realização do curso pré-vestibular, decisivo ao meu ingresso ao meio acadêmico.
iv
BIOGRAFIA
ERIC VICTOR DE OLIVEIRA FERREIRA, filho de Wilson Rodrigues Ferreira e Vicentina de Paula, nasceu em São Paulo-SP, em 15 de junho de 1980.
Em abril de 2002 ingressou no curso de Agronomia da Universidade Federal de Lavras (UFLA), onde realizou pesquisas de inciação científica, sob a orientação da professora Janice Guedes de Carvalho; graduando-se em fevereiro de 2007.
Em março do mesmo ano iniciou o curso de mestrado no Programa de Pós-graduação em Ciência do Solo da Universidade Federal do Rio Grande do Sul (UFRGS), sendo orientado pelo prof. Ibanor Anghinoni, obtendo seu título em fevereiro de 2009.
Neste mesmo mês do referido ano, ingressou no curso de doutorado do Programa de Pós-graduação em Solos e Nutrição de Plantas da Universidade Federal de Viçosa (UFV), sob a orientação do prof. Roberto Ferreira de Novais, concluindo-o em março de 2013.
Em 2012 participou do programa de doutorado sanduíche pelo CNPq (SWE) na Duke University, North Carolina-EUA, junto ao laboratório do prof. Robert Jackson.
v
CONTEÚDO
Página
RESUMO ... vi
ABSTRACT ... viii
GENERAL INTRODUCTION ... 1
LITERATURE CITED ... 3
CHAPTER 1 – Is total nitrogen leaf concentration a good indicator of the status of this nutrient for eucalyptus clones? ... 4
Abstract. ... 4
Introduction ... 4
Material and Methods ... 6
Results and Discussion ... 12
Conclusions ... 23
Literature Cited ... 24
CHAPTER 2 – Differential behavior of young eucalyptus clones in relation to nitrogen supply ... 28
Abstract. ... 28
Introduction ... 28
Material and Methods ... 30
Results and Discussion ... 32
Conclusions ... 42
Literature Cited ... 42
CAPÍTULO 3 – Redutase do nitrato e glutamina sintetase como indicadoras do status de nitrogênio em clones de eucalipto ... 48
Resumo ... 48
Introdução ... 48
Material e Métodos ... 50
Resultados e Discussão ... 54
Conclusões ... 64
Literatura Citada ... 64
vi
RESUMO
FERREIRA, Eric Victor de Oliveira, D.Sc., Universidade Federal de Viçosa, março de 2013. Indicadores fisiológicos do status de nitrogênio em plantas de eucalipto. Orientador: Roberto Ferreira de Novais. Co-orientadores: Ivo Ribeiro da Silva e Nairam Félix de Barros.
vii
viii
ABSTRACT
FERREIRA, Eric Victor de Oliveira, D.Sc., Universidade Federal de Viçosa, March, 2013. Physiological indicators of nitrogen status in eucalyptus plants. Adviser: Roberto Ferreira de Novais. Co-advisers: Ivo Ribeiro da Silva and Nairam Félix de Barros.
ix
1
GENERAL INTRODUCTION
The worldwide use of N fertilizer in agriculture has increased to about 80 million t year-1, with an important role in keeping food production in pace with population growth (Olfs et al., 2005). However, the doubling of worldwide food agricultural production over the past four decades has been associated with a 7-fold increase in the use of N fertilizers, with consequent impact on the diversity and functioning of ecosystems (Hirel et al., 2007).
Although N is a nutrient required in large amounts by plants (Cantarella, 2007), the effects of its application on eucalyptus’ dry matter production are divergent (Jesus et al., 2012). The response of eucalyptus to N, when it occurs, it is between 10 and 20 % of increase in dry matter, but it seems to decrease or even disappear with cultivation time. According to Gonçalves (2013)1, in the initial phase, in which growth is faster, the N demand is greater, so biogeochemical cycling would not be enough to supply the demand of this nutrient by eucalyptus and so it would respond to N fertilization. By contrast, in a subsequent phase (older plants) N demand decreases and biogeochemical cycling of N also increases (more leaves fall from the trees with greater amount of litter on the soil surface), and thus the cycling would supply the requirement of the eucalyptus and would happen no response to N.
As a result, forestry companies have used little or no N fertilization on their sites. Though, high export rates, low fertilization rates, and the depletion of this nutrient in the soil, indicate that intensively managed forests respond to N fertilization after several cultivation cycles (Pulito, 2009). The N content exported in the stem (wood plus bark) of seven year old eucalyptus is 150 kg ha-1 of N, for a yield of 50 m3 ha-1 year-1 (data estimated by NutriCalc 2001). Leite et al. (2010) found a deficit (mean of five regions) of 345 kg ha-1 of N during three cycles of cultivation of eucalyptus in the Vale do Rio Doce region, Minas Gerais State, which can result in significant reduction on N levels in the soil and an unsustainable practice in the long term.
Thus, questions as whether or not eucalyptus responds to N and why of this fact, are relevant. The N from the mineralization of soil organic matter (SOM) would be enough to attend the demand of eucalyptus species, as suggested (Pulito, 2009)? This author says that the mean demand of this species (20 to 50 kg ha-1 year-1) is satisfied by
1
2
N from mineralization of SOM (30 to 40 kg ha-1 year-1). Another hypothesis that has also been recently raised would be a possible involvement of microorganisms (diazotrophic bacteria, for example) performing the fixation of atmospheric N2 to supply the N deficit in the eucalyptus sites.
The complexity of the reactions of N in soil hampers the diagnosis of its availability for plants based solely on soil analysis, contrary to what occurs successfully for other nutrients (Cantarella, 2007). Thus, leaf analysis arises as an alternate method for assessing N status of plants. While Nutree ® does not recommend or recommend only 20 kg ha-1 in topdressing for each 1 g kg-1 less than 17 g kg-1 of total N in leaf analysis performed in eucalyptus up to two year old, some private companies’ professionals have recommended from 100 to 150 kg ha-1 of N, very discrepant condition. The Diagnosis and Recommendation Integrated System (DRIS) for N in eucalyptus has shown values equal or greater than zero, thus it does not recommended fertilization with this nutrient. But, on the other hand, imagines also that N deficiency problems can be no detected in standard routine analysis (leaf total N concentration).
Although leaf analyses of the total N concentration are routine, reports suggest that its use with the proposal of nutritional diagnosis has some limitations (Chapin et al., 1982; Perdomo et al., 2007; Rubio-Covarrubias et al., 2009). For example, leaf total N can be insensitive to seasonal demand of this nutrient by plants and show limited response to high N supply for trees. Thus, evaluation of the concentrations of N-NH4+ and N-NO3-, leaf N/P, chlorophyll and enzyme activities, in addition to SPAD (Soil Plant Analysis Development) readings, have been proposed as alternative indicators of N to diagnose nutritional status of plants and, thus, contribute to manage of its fertilization.
In contrast with conifers from temperate regions, little is known about the processes of N storage and remobilization in eucalyptus (Wendler et al., 1995), as well as fragmented knowledge of the biochemical and molecular mechanisms that control uptake, assimilation and recycling of N (Mickelson et al., 2003). Therefore, in view of the insensitivity of leaf total N, we aimed to investigate the concentrations of N-NH4+ and N-NO3-, leaf N/P, chlorophyll and the enzymatic activities of nitrate reductase (NR) and glutamine synthetase (GS), as well as SPAD readings, as possible indicators of the N status in eucalyptus plants.
3
LITERATURE CITED
CANTARELLA, H. Nitrogênio. In: NOVAIS, R.F.; ALVAREZ V, V.H.; BARROS, N.F.; FONTES, R.L.F.; CANTARUTTI, R.B. & NEVES, J.C.L., eds. Fertilidade do solo. Viçosa, SBCS, 2007. p.375-470.
CHAPIN, S.F.; FOLLET, J.M. & O’CONNOR, K.F. Growth, phosphate absorption, and phosphorus chemical fractions in two Chionochloa species. J. Ecol., 70:305-321, 1982.
HIREL, B.; LE GOUIS, J.; NEY, B. & GALLAIS, A. The challenge of improving nitrogen use efficiency in crop plants: towards a more central role for genetic variability and quantitative genetics within integrated approaches. J. Exp. Bot., 58:2369-2387, 2007.
JESUS, G.L.; BARROS, N.F.; SILVA, I.R.; NEVES, J.C.L.; HENRIQUES, E.P.; LIMA, V.C.; FERNANDES, L.V. & SOARES, E.M.B. Doses e fontes de nitrogênio na produtividade do eucalipto e nas frações da matéria orgânica em solo da região do cerrado de Minas Gerais. R. Bras. Ci. Solo, 36:201-214, 2012.
LEITE, F.P.; SILVA, I.R.; NOVAIS, R.F.; BARROS, N.F. & NEVES, J.C.L. Alterations of soil chemical properties by eucalyptus cultivation in five regions in the Rio Doce Valley. R. Bras. Ci. Solo, 34:821-831, 2010.
MICKELSON, S.; SEE, D.; MEYER, F.D.; GARNER, J.P.; FOSTER, C.R. & BLAKE, T.K.; FISHER, A.N. Mapping QTL associated with nitrogen storage and remobilization in barley (Hordeum vulgare L.) leaves. J. Exp. Bot., 54: 801-812, 2003.
OLFS, H.W.; BLANKENAU, K.; BRENTRUP, F.; JASPER, J.; LINK, A. & LAMMEL, J. Soil-and plant-based nitrogen-fertilizer recommendations in arable farming. J. Plant Nutr. Soil Sci., 168:414-431, 2005.
PERDOMO, C.; DURÁN, J. & LLOVET, P. Soil and plant indices for predicting eucalypt response to nitrogen in Uruguay. Soil Sci. Soc. Am. J., 71:1708-1718, 2007.
PULITO, A.P. Resposta à fertilização nitrogenada e estoque de nitrogênio biodisponível em solos usados para plantações de Eucalyptus. Piracicaba, Escola Superior de Agricultura Luiz de Queiroz, 2009. 58p. (Dissertação de Mestrado)
RUBIO-COVARRUBIAS, O.A.; BROWN, P.H.; WEINBAUM, S.A.; JOHNSON, R.S. & CABRERA, R.I. Evaluating foliar nitrogen compounds as indicators of nitrogen status in Prunus persica trees. Sci. Hortic., 120:27-33, 2009.
WENDLER, R.; CARVALHO, P.O.; PEREIRA, J.S. & MILLARD, P. Role of nitrogen remobilization from old leaves for new leaf growth of Eucalyptus globulus seedlings. Tree Physiol., 15: 679-683, 1995.
4
CHAPTER 1 – Is total nitrogen leaf concentration a good indicator of the
status of this nutrient for eucalyptus clones?
Abstract- Total N leaf concentration has been widely used for verification of possible
plant deficiencies of this nutrient in routine analysis. However, reports have shown some limitations of its use with respect to plant nutritional diagnosis. Hence, the aim this work was to evaluate the total N concentration and compare it with other alternative indicators of the N status in eucalyptus clones, under different conditions of N supply. For this purpose, two experiments were conducted, one in the greenhouse and another in the field. The greenhouse experiment was a 2 x 6 factorial in a randomized complete block design consisting of two eucalyptus clones (VM-01 and I-144) and six doses of N (0, 0.74, 2.93, 4.39, 5.85 and 8.00 mmol L-1 of NH4NO3) in nutrient solution. The field experiment was a 2 x 2 x 2 x 3 factorial in a randomized complete design, with two seasons (dry and rainy), two regions (Pompeu and João Pinheiro, Minas Gerais State, Brazil), two clones (VM-01 and I-144), and three positions of leaf sampling in the crown (base, middle and apex). We evaluated the concentrations of total N, N-NH4+ and N-NO3-; chlorophyll; leaf N/P and SPAD (Soil Plant Analysis Development) readings (only in greenhouse). The concentrations of N-NH4+ (root) and N-NO3- (root and leaf) showed potential for predicting eucalyptus N requirements in greenhouse, however, these mobile N forms (mainly N-NO3-) did not represent well the soil N levels in the field. It was observed similar responses for leaf N/P, chlorophyll and SPAD readings to N application in greenhouse (quadratic and square root models), and the N/P and chlorophyll did not reflect the real differences in soil N status in the field. The total N leaf concentration is not good indicator of N status, because it did not have highest correlation coefficient in greenhouse. Nevertheless, of all indicators evaluated, it better represented the variations in soils N status for eucalyptus clones under field conditions.
Keywords: ammonium, chlorophyll, leaf N/P, nitrate, SPAD.
INTRODUCTION
5
is regarded as reasonably reliable method of assessing N status of crops because it avoids many of the problems associated with soil N tests. The use of plant analysis is based on the idea that the plant itself is the best indicator for N supply from soil during its growth period (Olfs et al., 2005).
Assessments made directly on the plants, which integrate all soil and environmental factors, are auxiliary to the recommendation of N fertilization, as the concentration of nitrate (N-NO3-) in leaves or petioles of various cultures (Cantarella, 2007), the total N leaf concentration in perennial crops (Raij et al., 1997), in addition to readings of chlorophyll by SPAD- Soil Plant Analysis Development (Cantarella, 2007). Olfs et al. (2005) point out the total N concentration or the ratio of this with its critical level, the plant-sap or petiole N-NO3- and the chlorophyll concentration of leaves as plant indicators most commonly used as base for N fertilizer recommendation. However, in routine analysis of most laboratories the total N concentration has been used (Rubio-Covarrubias et al., 2009), being this tool the most widely used for verification of possible deficiencies of this nutrient (Araújo, 2007).
On the other hand, the use of total N leaf concentration, with the purpose of nutritional diagnosis, presents some limitations. Reports have shown a limited response of leaf total N to high N supply in woody crops (Alva et al., 1998). It has been observed that total N concentrations increase rapidly in response to N fertilization when plants are N deficient, but once N demand for growth is satisfied, it increases only slightly or not at all, becoming difficult to diagnose areas with excessive applications of N fertilizers (Rubio-Covarrubias et al., 2009). It was recognized in onion under greenhouse conditions that there is a period from the beginning of maximum leaf growth to the following 30 days in which total N concentration is stabilized (Alcántar et al., 2002). In
Eucalyptus globulus and E. grandis, leaf total N did not differ between responsive and
non-responsive sites (Perdomo et al., 2007). Also, leaf total N can be insensitive to seasonal adjustment of nutrient use (Chapin et al., 1982).
6
2009). These authors comment also that mobile N forms as N-NO3- and N-NH4+ and chlorophyll have shown advantages over total N in many crops.
Maier & Chvyl (2003) report that when decisions on crop nutrient requirements are based on plant analysis data, relationships among nutrients within the plant should be considered to ensure correct interpretation, for example, the synergism between N and P in potato. Thus, the leaf N/P has been extensively used to guide the fertilization with these nutrients in eucalyptus in Australia and New Zealand (Judd et al., 1996; Knight & Nicholas, 1996; Perdomo et al., 2007). And finally, as a nondestructive and alternative indirect evaluation method of plant N status in real-time, Madeira et al. (2009) suggest SPAD (Soil Plant Analysis Development) to monitor N concentration in
E. globulus (up to two year old). The N concentration is related to chlorophyll
concentration in leaves (Alcántar et al., 2002). However, the relationship between chlorophyll concentrations and SPAD values is not always linear (Fontes, 2011).
Nutrition differences have been found among eucalyptus species (Santana et al., 2002), as observed to N (Pinto et al., 2011), and also among different positions of leaves in the tree crown (Turnbull et al., 2007). This last fact is due to differences in light availability in the tree crown and the relationship between N concentration and irradiance (Le Roux et al., 1999), that is, N is preferentially allocated to foliage in areas of higher irradiance (Givnish, 1988). However, relationships between N distribution and
light gradients are inconsistent (Turnbull et al., 2007). Additionally, N is a mobile
nutrient in plants (Marschner, 2012). Therefore, it is important to assess these differences among species as well as among crown positions of eucalyptus trees.
Despite many attempts, there is no consensus regarding the standardization of a better N indicator in plants. This lack of consensus demonstrates a clear need for research on plant N status. Therefore, the objectives of this study were to evaluate alternative indicators of N status (N-NH4+, N-NO3-, N/P and chlorophyll), in addition to its total concentration and SPAD readings in eucalyptus clones under different conditions of N supply in greenhouse and in field.
MATERIAL AND METHODS
7
validate the variables under study, since they reflect the real condition of the eucalyptus management. The sites were chosen due to their contrasting soil physical and chemical properties (Table 1).
Table 1. Soil physical and chemical properties1 of the experimental sites on beginning
of the evaluations (Sept./11)
Layer Po2 JP3 Po JP Po JP Po JP Po JP
pH SOM4 P K Clay
---cm--- ---H2O--- ---dag kg-1--- ---mg dm-3--- ---%---
0-10 5.17 5.15 3.53 1.89 2.83 6.21 44 16 75 17
10-20 4.90 4.86 2.66 1.40 4.05 13.61 36 14 74 17 20-40 4.64 4.73 2.07 1.11 15.76 8.57 31 10 74 16
40-60 4.73 4.74 1.70 0.78 3.98 2.28 19 6 73 18
60-100 4.80 4.50 1.29 0.52 1.12 1.17 10 2 75 21
Mean 4.85 4.79 2.25 1.14 5.55 6.37 28 10 74 18
Ca2+ Mg2+ Al3+ H+Al CEC5
---cm--- ---cmolc dm-3--- 0-10 1.44 0.45 0.35 0.35 0.59 0.41 6.65 4.56 2.49 1.25 10-20 0.75 0.17 0.21 0.18 0.95 0.57 6.65 4.38 2.00 0.95 20-40 0.30 0.13 0.10 0.13 1.17 0.54 6.32 3.78 1.65 0.83 40-60 0.23 0.05 0.08 0.09 0.91 0.53 5.41 3.21 1.26 0.68 60-100 0.12 0.01 0.06 0.05 0.65 0.48 4.68 2.80 0.85 0.55 Mean 0.57 0.16 0.16 0.16 0.85 0.51 5.94 3.74 1.65 0.85 1
Mean values of samples collected in line and interline. 2Pompeu (Po) and 3João Pinheiro (JP)
regions.4Soil organic matter (SOM) = organic C x 1.724 - Walkley-Black. pH in water- 1:2.5 ratio. P and
K (Mehlich 1). Clay determination according to Ruiz (2005). Ca2+, Mg2+ and Al3+(KCl 1 mol L-1). H + Al
(calcium acetate 0.5 mol L-1). 5Cation exchange capacity (CEC)= Ca2++ Mg2++ K + Al3+.
Greenhouse experiment
This trial was carried out at Federal University of Viçosa, Viçosa (20° 45’ S, 42°
52’ W), MG, Brazil, for three months (from July to September 2011). The experiment was a 2 x 6 factorial in a randomized complete block design with five replications, consisting of two eucalyptus clones (VM-01 and I-144) and six doses of N (0, 0.74, 2.93, 4.39, 5.85 and 8.00 mmol L-1 of NH4NO3) in nutrient solution. The clones have different nutritional efficiencies in relation to N (Pinto et al., 2011); VM-01 (Eucalyptus
urophylla vs E. camaldulenses) is considered N demanding in contrast to clone I-144
8
permanent aeration, with pH 5.5 ± 0.05 (Locatelli et al., 1984), and it was changed weekly using deionized water. In the first thirty days of the experiment, the plants were grown in collective plastic trays (11 L) and the nutrient solution concentration was gradually increased week by week (25, 50, 75 and 100 % of the original concentration). Later, two homogeneous plants were selected regarding the height and vigor, and then these plants were transplanted to individual pots (6 L) representing an experimental unit. The plants were approximately 50 days old at the beginning of the experiment and they were originated from tube seedlings.
At the end of the experiment were taken readings of chlorophyll with SPAD (Soil Plant Analysis Development; SPAD-502 model) in the two youngest fully expanded leaves of each plant, taking the average of six consecutive measurements, from 8 to 10 am. To evaluate the chlorophyll concentrations, two discs (0.78 cm2 each) were collected on the same leaves evaluated with the SPAD from each plant. Finally, after sixty days in nutrient solution with the treatments, the plants were harvested and oven dried (60 °C/72 h) to determine the dry matter, and they were then ground (Wiley mill) for chemical assessments.
Field experiment
The sites were located in the southeast of Brazil, Minas Gerais State, and the areas and species descriptions as well as some agronomic practices adopted are presented in table 2. This experiment was a 2 x 2 x 2 x 3 factorial scheme in a
randomized complete design with five replications, with two evaluation times
(September/2011 and February/2012), two regions (Pompeu and João Pinheiro municipalities), two eucalyptus clones (VM-01 and I-144), and three positions of leaf sampling in the crown (base, middle and apex). The evaluation times in September and February represented the dry and rainy seasons respectively, and the samplings were performed at the end of each season (Table 2; Figure 1). The regions Pompeu and João Pinheiro have clay and sandy soils, respectively (Table 1). Each plot consisted of five
eucalyptus rows with six plants each row, with 262.5 m2 in both regions, according to
the spacing of sites (Table 2). In addition to the fertilizations with N-P-K (Table 2), the
9
The trunk circumference measured at 1.3 m (breast height) from the ground of all trees (30) located within the evaluation plot was recorded and then averaged. Later, five representative trees were chosen within this range in each plot to measure the height (h) so as to estimate the trunk solid volume [ , dbh= diameter at breast height; Figures 1a and b]. Of these five trees, four were used as reference for soil sampling and another tree (fifth) was used for leaf sampling. The soil samples were collected in the layers of 0-10, 10-20, 20-40, 40-60 and 60-100 cm of depth at four locations/sampling place (line and interline) per plot. These soil samples were air dried, grounded and sieved (2 mm) before of laboratory analysis.
Figure 1. Trunk solid volume of eucalyptus clones grown on field in the regions of
Pompeu (clay soil) and João Pinheiro (sandy soil) under dry season-Sept./11 (a) and rainy season-Feb./12 (b) and rainfall occurred in these regions from Jan./2011 to Feb./2012 (c). Significance of p-value by F test.
Region
Pompeu João Pinheiro
T ru n k so lid v o lu m e ( m
3 h
a -1 ) 0 20 40 60 80 100
Pompeu João Pinheiro
a b
p<0.001
p<0.05
p<0.001 p<0.001
Clone VM-01 Clone I-144 Clone VM-01 Clone I-144
Month/year Jan./1 1 Feb ./11 Mar ./11 Apr ./11 May /11 June /11 July /11 Aug ./11 Sep t./1 1 Oct./1 1 No v./1 1 De c./1 1 Jan./1 2 Feb ./12 R a in fa ll (m m /m o n th ) 0 100 200 300 400 500 600
Pompeu João Pinheiro
10
Table 2. Description of sites located in the State of Minas Gerais-MG, Brazil, belonging to Forestry Company Vallourec & Mannesmann Tubes (V&M Tubes) used for the field experiment
Region Coordinate/
altitude Soil Clone Specie
Planting Date
Stocking
Density Fertilization Sampling (season)
Dry Rainy
plants ha-1
kg ha-1 (N-P-K) Latossolo Vermelho Amarelo1 At planting 7 map3 18 map3
Pompeu 18º53' S 45º02' W/ 654 masl4
(Oxisol)2
VM-01
E. urophylla vs E.
camaldulenses
04-15-10 1333 (3.0x2.5m) 360 (10- 27- 10) 240 (23- 00-21) 350 (23- 00-21)
09/14/11 02/09/12 I-144 E. urophylla vs
E. grandis --- Neossolo Quartzarênico1 João Pinheiro 17º30' S 46º07' W/ 533 masl4
(Entisol)2
VM-01
E. urophylla vs E.
camaldulenses
05-03-10 1333 (3.0x2.5m) 300 (10- 27- 10) 250 (23- 00-23) 350 (23- 00-23)
09/16/11 02/07/12 I-144 E. urophylla vs
E. grandis
11
For plant sampling, only fully expanded leaves were collected (180 leaves/tree), with 60 leaves for each crown position, between middle and tips of the branches and from two and three branches of different sides of the plant, in the morning (from 8 to 12 h). The trees crowns were measured and then divided them into three parts (base, middle and apex) and the leaf sampling was done within the mean height of each part. In these same leaves, we also extracted two discs (0.78 cm2) for chlorophyll determination. During the second sampling (February 2012), we chose another tree to collect the leaves in each plot, since interference could exist with the previous sampling (September 2011). The leaves drying and grinding procedure was the same used for greenhouse experiment.
Laboratory analyses
The leaf samples were analyzed for total N, N-NH4+, N-NO3-, chlorophyll and P concentrations. Greenhouse samples were also evaluated for the concentrations of root total N, N-NH4+ and N-NO3-. Total N was determined by Kjeldahl (Bremner, 1996), whereas the mineral N forms (N-NH4+ and N-NO3-) were analyzed according to Tedesco et al. (1995). Chlorophylls (a and b) were extracted in saturated dimethylsulphoxide (DMSO) with CaCO3 in water bath (65 ˚C) by 1 h (greenhouse experiment) and by 2 h (field experiment), times defined in previous tests, and the absorbance measured at 649 and 665 nm. Chlorophylls (a and b) were calculated
according to Wellburn’s (1994) equations. From chlorophylls (a and b) we got the total chlorophyll. Phosphorus was extracted in HCl (0.01 mol L-1), after mineralization of the samples by calcination in muffle furnace (500 ºC) and quantification in ICP-OES (optical emission spectrophotometry) to calculate leaf N/P. Soil samples were analyzed for total N (Kjeldahl method), N-NH4+ (Kempers & Zweers, 1986) and N-NO3- (Yang et al., 1998). The pH in water (1:2.5 ratio), organic C (Walkley-Black), P and K (Mehlich- 1), texture (Ruiz, 2005), Ca2+, Mg2+ and Al3+ (KCl 1 mol L-1) and H + Al (calcium acetate 0.5 mol L-1)were also determined. The cation exchange capacity was calculate as (CEC)= Ca2++ Mg2++ K+ + Al3+. The organic C concentrations were transformed to soil organic matter (SOM = organic C x 1.724) (Alvarez V. et al., 1999).
Statistical analyses
12
equations and chose the significant model (p<0.05) with highest R2. We estimated concentrations of leaf critical range associated to 90 and 100 % of maximum growth, derived from equations fitted to dry matter production of plants and total N and N/P data. We also fitted Pearson correlation coefficients (r) between N supply (doses) and the indicators of N status and total dry matter of eucalyptus clones. In the case of field experiment, we adopted 10 % (p<0.10) as significant effect for F test. For this last analysis, we evaluated the main effect and only some interactions of greater interest in the study, due to the large number of possible interactions. The means were compared by Tukey (p<0.05) and all figures were done with the SIGMAPLOT software.
RESULTS AND DISCUSSION
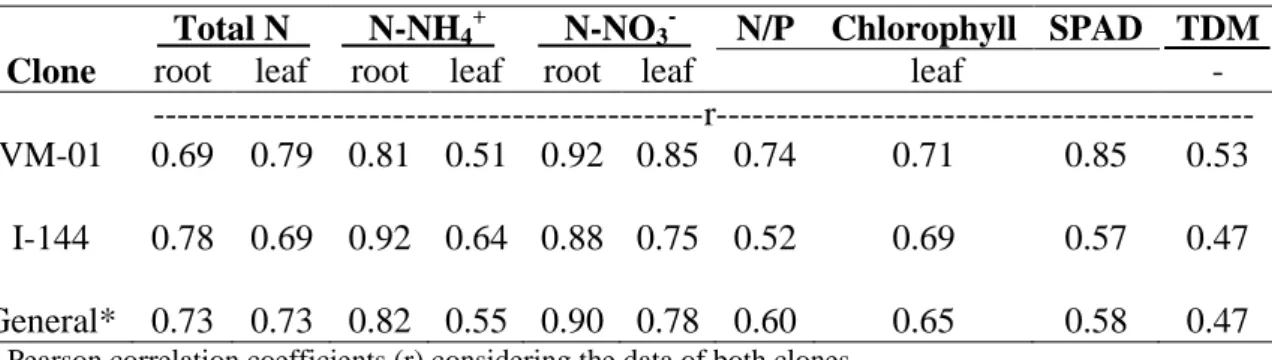
The N doses increased the concentrations of total N, N-NH4+ and N-NO3- in leaves and roots of both eucalyptus clones (Figure 2). For total N in root, clone VM-01 had Pearson correlation coefficient (r) lower than clone I-144, but in leaf it was inverse with general r of 0.73 (Table 3). There was no significant difference (p>0.05) between the clones with respect to root total N, however leaves differed significantly, and the clone VM-01 showed the highest values (Figures 2a and b). Pinto et al. (2011) assessed the nutritional efficiency of eucalyptus clones and found differences in the N use efficiency between the clones VM-01 and I-144. The first clone was found to have a lower efficiency, which indicates its greater demand for this nutrient.
Total N leaf concentrations estimated with 2.93 mmol L-1 of NH4NO3 (dose of
13
Figure 2
.
Concentrations of total N in root (a) and in leaf (b), N-NH4+ in root (c) and inleaf (d) and N-NO3- in root (e) and in leaf (f) of young eucalyptus clones under N doses in nutrient solution.ns, º, *, ** and ***, represent, respectively, not significant and significant at 10, 5, 1 and 0.1 % by F test (p<0.05). Cl (clone) and D (dose).
R o o t to ta l N ( g k g -1) 0 5 10 15 20 25 30 L e a f to ta l N ( g k g -1 ) 0 10 20 30 40 50 R o o t N -N H4 + ( m g k g -1 ) 0 100 200 300 400 500 600 L e a f N -N H4 + ( m g k g -1 ) 0 20 40 60 80 100 120
Dose of N (mmol L-1 of NH4NO3)
0.000.74 2.93 4.39 5.85 8.00
R o o t N -N O3 - ( m g k g -1 ) 0 100 200 300 400
0.000.74 2.93 4.39 5.85 8.00
L e a f N -N O3 - ( m g k g -1) 0 2 4 6 8 10 12 14 16 18 20 F test Clone (p>0.05) Dose (p<0.05) Cl x D (p>0.05)
yˆ
F test Clone (p<0.05) Dose (p<0.05) Cl x D (p>0.05)
F test Clone (p<0.05) Dose (p<0.05) Cl x D (p<0.05)
F test Clone (p<0.05) Dose (p<0.05) Cl x D (p<0.05)
F test Clone (p<0.05) Dose (p<0.05) Cl x D (p<0.05)
F test Clone (p<0.05) Dose (p<0.05) Cl x D (p>0.05)
a b
c d
e f
Clone VM-01
Clone I-144 =9.67+5.59**x-0.51**x2 R2=0.97
=11.03-0.45nsx+6.31**x0.5 R2=0.99
=7.51-4.75*x+24.15**x0.5 R2=0.98 =7.05-4.74*x+21.95*x0.5 R2=0.96
=38.18-36.21**x R2=0.93 =54.33+59.93***x R2=0.96
=31.80+26.09*x-2.70*x2 R2=0.90 =32.03+6.31*x R2=0.66
=-3.25+47.61***x R2=0.97 =-5.52+39.98**x R2=0.93 yˆ yˆ yˆ yˆ yˆ yˆ
yˆ yˆ
yˆ
yˆ yˆ
14
Table 3. Pearson correlation coefficients (r) between N supply (doses) and indicators of
N status and total dry matter (TDM) of eucalyptus clones grown in nutrient solution
Total N N-NH4+ N-NO3- N/P Chlorophyll SPAD TDM
Clone root leaf root leaf root leaf leaf -
---r--- VM-01 0.69 0.79 0.81 0.51 0.92 0.85 0.74 0.71 0.85 0.53
I-144 0.78 0.69 0.92 0.64 0.88 0.75 0.52 0.69 0.57 0.47
General* 0.73 0.73 0.82 0.55 0.90 0.78 0.60 0.65 0.58 0.47
* Pearson correlation coefficients (r) considering the data of both clones.
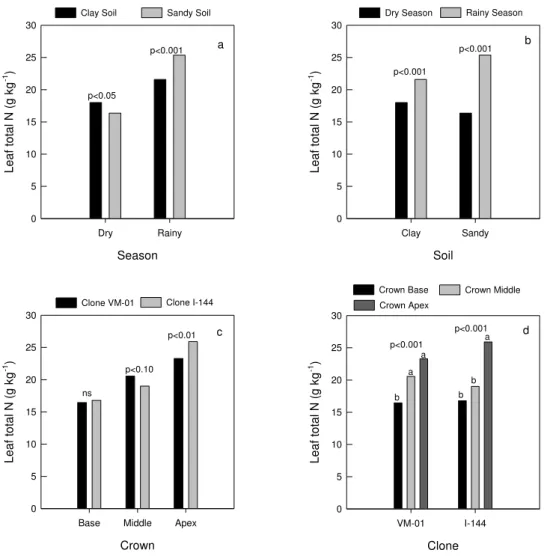
The optimal total N leaf concentration for tree growth decreases with age (Rubio-Covarrubias et al., 2009), due to a combination of factors, such as dry matter production rate exceeding soil N uptake rate (Smith & Lorenagan, 1997). In the field, total N leaf concentrations were different for both soils with greater concentrations in the clay soil in the dry season (Figure 3a), so they represented well the differences on soil total N concentrations between the regions in this season (Table 4). However, on rainy season total N leaf concentrations were greater in the region of sandy soil and thus they did not represent well the soil total N, since the clay soil also had greater total N concentrations in this season.
Soils with higher clay content offer greater protection for organic matter and greater N accumulation in soil (Cantarella, 2007). In the rainy season there is a chance of greater soil organic matter mineralization and as the clay soil has more organic matter (Table 1) and total N (Table 4), it has higher potential of N release for plant uptake, we would hope greater total N leaf concentrations in this situation. Greater total N leaf concentrations were verified on rainy season for both soils (Figure 3b). Therefore, as there was no constancy in the total N leaf concentrations between different soils regions to each season (Figure 3a), their concentrations cannot be considered a good indicator of its status for eucalyptus clones.
15
crown middle could be recommended for leaf sampling. For E. globulus sites, irrespective of their fertilization times, leaf total N did not show a good relationship with N response in Uruguayan soils (Perdomo et al., 2007). Rubio-Covarrubias et al. (2009) found that total N concentration showed the highest and most consistent association with the supply of this nutrient and growth of nectarine trees. Leaf analysis performed in different sites did not support the widespread use of total N concentration as an indicator of its deficiency in E. nitens (Smethurst et al., 2004). These results indicate a lack of consensus with the total N use as indicator of its status and also a need for more research in this issue. Thus, the total N use for leaf diagnosis is not reliable because it does not represent well its availability in the soil.
Figure 3. Total N leaf concentrations of eucalyptus clones in different soils for each
season (a), in different seasons for each soil (b), in different clones for each position of leaves collect in the crown (c) and in different crown positions for each clone (d). ns represents not significant at 10 % by F test (p>0.10). Means with the same letter, in each clone, are not significantly different by Tukey (p<0.05).
Season Dry Rainy L e a f to ta l N ( g k g -1) 0 5 10 15 20 25 30 Soil Clay Sandy L e a f to ta l N ( g k g -1) 0 5 10 15 20 25 30 Clone VM-01 I-144 L e a f to ta l N ( g k g -1) 0 5 10 15 20 25 30 Crown
Base Middle Apex
L e a f to ta l N ( g k g -1) 0 5 10 15 20 25 30
Dry Season Rainy Season
a b
c d
Clone VM-01 Clone I-144
p<0.001 p<0.001 p<0.05 p<0.001 ns p<0.10 p<0.01 p<0.001 p<0.001 Crown Base Crown Middle Crown Apex
Clay Soil Sandy Soil
16
In general, soil total N and N-NH4+ concentrations were higher in the soil upper layers (Table 4) because in these layers there is more organic matter (Table 1) and more than 95 % of soil total N is present in organic forms (Cantarella, 2007). In contrast, there was no standard distribution for the soil N-NO3- concentrations in the different layers, probably due the N-NO3- ions having high mobility and leaching in soils (Groffman, 2000). The plants absorb most of the soil N as N-NH4+ and N-NO3 -(Marschner, 2012). In all conditions of different regions, seasons, clones and soils depths there was a predominance of N-NH4+ concentrations over N-NO3- (Table 4). This fact is explained due to this specie being generally cultivated under acid soils with low natural fertility (Gama-Rodrigues et al., 2005) where the nitrification is lower due to bacteria that perform this process (Nitrosomonas and Nitrobacter) are sensitive to lower pH (Moreira & Siqueira, 2002; Table 1). As consequence, eucalyptus species preferentially absorb more N-NH4+ than N-NO3- (Barros & Novais, 1996; Figures 2, 4 and 5). Preferential uptake of N-NH4+ in relation to N-NO3- can constitute an advantage, given the lower metabolic energy use, since it does not require the action of root N-NO3 -reductase (Grespan et al., 1998). It would be advantageous for eucalyptus that seems to reduce further N-NO3- in the leaves than in the roots, as verified by too lower N-NO3 -concentrations found in the leaves in relation to root (Figures 2e and f).
17
Table 4. Concentrations1 of N (total, ammonium and nitrate) in the soils under
eucalyptus clones in different regions (Pompeu and João Pinheiro) and seasons (Dry and Rainy)
Pompeu João Pinheiro
VM-01 I-144 VM-01 I-144
Dry Rainy Dry Rainy Dry Rainy Dry Rainy
Layer Total N
---cm--- ---dag kg-1---
0-10 0.11 0.11 0.11 0.11 0.06 0.06 0.07 0.06
10-20 0.09 0.09 0.10 0.09 0.04 0.05 0.05 0.05
20-40 0.08 0.08 0.08 0.07 0.04 0.03 0.04 0.04
40-60 0.07 0.06 0.07 0.07 0.03 0.02 0.03 0.03
60-100 0.06 0.05 0.08 0.06 0.02 0.01 0.03 0.03
Mean ---0.08 a--- ---0.04 b---
N-NH4+
---mg kg-1--- 0-10 40.26 30.70 37.27 32.25 26.17 23.68 20.76 27.32 10-20 30.65 27.33 30.75 27.90 22.82 24.76 18.56 26.03 20-40 25.43 27.04 21.74 27.73 18.62 22.06 19.61 36.36 40-60 24.04 32.18 23.86 24.83 20.48 19.05 16.63 34.22 60-100 25.87 31.15 22.41 24.08 20.79 18.18 17.47 24.52 Mean ---28.37 a--- ---22.91b---
N-NO3
---mg kg-1---
0-10 0.55 0.54 0.86 0.51 0.69 0.54 0.72 0.44
10-20 0.49 0.41 0.57 0.57 0.59 0.47 0.61 0.61
20-40 0.48 0.28 0.52 0.44 0.56 0.46 0.51 0.29
40-60 0.60 0.36 0.55 0.38 0.56 0.34 0.64 0.29
60-100 0.60 0.25 0.93 0.57 0.88 0.52 1.10 0.52
Mean ---0.52 a--- ---0.57 a---
1Mean values of samples collected in line and interline. Pompeu and João Pinheiro represent regions with
clay and sandy soil, respectively. Means with the same letter, in the rows, are not significantly different
by Tukey (p<0.05). Total N (Kjeldahl’s method), N-NH4+ (Kempers & Zweers, 1986) and N-NO3- (Yang
18
The N-NH4+ leaf concentrations were higher in the sandy soil region in both dry and rainy seasons (Figure 4a), therefore it did not reflect their soil concentrations due to clay soil having a greater concentration this ion (Table 4). The N-NH4+ leaf concentrations were smaller in the rainy season, for both clay and sandy soils (Figure 4b), in contrast that was also observed with their concentrations on soil (Table 4). There was difference in N-NH4+ leaf concentrations between the clones only on the crown apex, with greater values for I-144, differently to what happened in the greenhouse (Figure 2d and 4c). It was observed that higher N-NH4+ leaf concentrations only on crown apex in clone I-144 and in VM-01 there was no difference in their concentrations among the crown positions (Figure 4d).
Figure 4. Leaf N-NH4+ concentrations of eucalyptus clones in different soils for each
season (a), in different seasons for each soil (b), in different clones for each position of leaves collect in the crown (c) and in different crown positions for each clone (d). ns represents not significant at 10 % by F test (p>0.10). Means with the same letter, in each clone, are not significantly different by Tukey (p<0.05).
Season Dry Rainy L e a f N -N H4 + ( m g k g -1 ) 0 10 20 30 40 50 Soil Clay Sandy L e a f N -N H4 + ( m g k g -1) 0 10 20 30 40 50 Clone VM-01 I-144 L e a f N -N H4 + ( m g k g -1) 0 10 20 30 40 50 Crown
Base Middle Apex
L e a f N -N H4 + ( m g k g -1 ) 0 10 20 30 40 50 a
Dry Season Rainy Season
b
c d
p<0.10
Clone VM-01 Clone I-144 p<0.001 p<0.001 ns ns p<0.001 ns p<0.001 p<0.001
Crown Base Crown Middle Crown Apex
Clay Soil Sandy Soil
19
For the N-NO3- leaf concentrations, except between soils on dry season, there was no difference among soils, seasons, clones and crown positions (Figures 5a, b, c and d), probably as a consequence of not having existed differences in their concentrations in the soil (Table 4). Concentrations of N-NO3- were very low for the purposes of diagnosis in canola (Hocking, 2001). Thus, it has been suggested that the combination of both indicators (stable compounds- N total and chlorophyll and N mobile forms- N-NH4+ and N-NO3-) could be used to diagnose the N status over a wide range of availability this nutrient in soil (Rubio-Covarrubias et al., 2009).
Figure 5. Leaf N-NO3- concentrations of eucalyptus clones in different soils for each
season (a), in different seasons for each soil (b), in different clones for each position of leaves collect in the crown (c) and in different crown positions for each clone (d). ns represents not significant at 10 % by F test (p>0.10).
The leaf N/P, chlorophyll and SPAD readings (Figures 6a, b and c) showed a similar behavior to N doses application in solution; with general r of 0.60, 0.65 and
Season Dry Rainy L e a f N -N O3
- (m
g k g -1 ) 0 5 10 15 20 Soil Clay Sandy L e a f N -N O3
- (m
g k g -1 ) 0 5 10 15 20 Clone VM-01 I-144 L e a f N -N O3
- (m
g k g -1 ) 0 5 10 15 20 Crown
Base Middle Apex
L e a f N -N O3
- (m
g k g -1 ) 0 5 10 15 20
Clay Soil Sandy Soil Dry Season Rainy Season
p<0.05 a b
c d ns ns ns ns ns ns ns ns
Clone VM-01 Clone I-144
20
0.58, respectively (Table 3). It was observed an increase in their values until reaching a peak, and then these values remained practically constant. However, the clone I-144 had the highest values these variables, unlike the leaf total N (Figure 2b). For N/P, the clone VM-01 presented a critical range from 11.42 to 13.38, related to the estimated doses of 1.63 and 3.80 mmol L-1 of NH4NO3, respectively, while estimated doses of 1.90 and 4.55 mmol L-1 of NH4NO3 were related to critical range of 14.70 and 15.90 for clone I-144 (Figure 6a). These values were similar to those reported in Australia and New Zealand (15; Judd et al., 1996; Knight & Nicholas, 1996) for E. globulus and E. nitens.
Figure 6. Leaf N/P (a), chlorophyll (b), SPAD readings (c) and total dry matter (d) of
young eucalyptus clones under N doses in nutrient solution.º, * and **, represent, respectively, significant at 10, 5 and 1 % by F test (p<0.05). Cl (clone) and D (dose).
=3.77-5.23*x+20.41*x0.5 R2 =0.92 =5.90-5.20*x+22.18*x0.5 R2 =0.96 =3.03-1.88ºx+8.97*x0.5 R2 =0.94 =4.32-2.78ºx+11.36*x0.5
R2=0.88 =17.15-5.78*x+27.45**x
0.5
R2=0.98
=32.17-3.59*x+18.98**x0.5 R2 =0.98 Leaf N /P 0 2 4 6 8 10 12 14 16 18 20 C hlorophy ll (µ g cm -2 ) 0 10 20 30 40 50 60 70
Dose of N (mmol L-1 of NH4NO3)
0.000.74 2.93 4.39 5.85 8.00
S P A D r eadin g s 0 10 20 30 40 50
0.000.74 2.93 4.39 5.85 8.00
T ot al dry m at ter (g /plant ) 0 5 10 15 20 25 30 35 F test Clone (p<0.05) Dose (p<0.05) Cl x D (p>0.05)
yˆ
F test Clone (p<0.05) Dose (p<0.05) Cl x D (p>0.05)
F test Clone (p<0.05) Dose (p<0.05) Cl x D (p<0.05)
F test Clone (p<0.05) Dose (p<0.05) Cl x D (p>0.05) yˆ
yˆ
yˆ yˆyˆ
yˆ yˆ a b c d Clone VM-01 Clone I-144 =16.92-1.80ºx+11.73**x0.5 R2 =0.98
21
In the field, the values of leaf N/P were between 20 and 29 (Figure 7), probably as a consequence of low mean leaf concentrations of P in these plants (< 0.90 g kg-1, Dechen & Nachtigall, 2007). There was no difference between leaf N/P for regions of sandy and clay soils in the dry season, however in the rainy season there were higher values of this ratio in the region of clay soil (Figure 7a). For both clay and sandy soils there were higher values of leaf N/P in the rainy season (Figure 7b), as also observed for leaf total N (Figure 3b). The clone VM-01 showed the greatest N/P regardless of crown position (Figure 7c), unlike the observed in the greenhouse (Figure 6a). For the different sampling positions of leaves in the crown there was a reduction of N/P from base to apex of the trees crown for the two clones (Figure 7d) due to P leaf concentrations (data not shown) being proportionately smaller in crown base, since this nutrient is mobile in the plant (Dechen & Nachtigall, 2007). Although the analysis of leaf N/P can be used to guide fertilization with these nutrients in eucalyptus (Perdomo et al. 2007), leaf analysis conducted at different sites did not support its widespread use as an indicator of N deficiency in E. nitens (Smethurst et al., 2004), as was also verified in this study.
22
Figure 7. Leaf N/P of eucalyptus clones in different soils for each season (a), in
different seasons for each soil (b), in different clones for each position of leaves collect in the crown (c) and in different crown positions for each clone (d). ns represents not significant at 10 % by F test (p>0.10). Means with the same letter, in each clone, are not significantly different by Tukey (p<0.05).
SPAD readings reflect the intensity of leaf green color (Fontes, 2011) proportional to the chlorophyll leaf concentrations. Though N deficient leaves are chlorotic (Marschner, 2012), greater total N leaf concentrations does not always mean an increase in the leaves green color, as verified when we compare the clones VM-01 and I-144. Clone VM-01 had greater total N leaf concentrations (Figure 2b); however it has showed lower SPAD readings as consequence less chlorophyll (Figure 6b) and then lighter green leaves. Also there is not always positive correlation between chlorophyll and N concentrations, since the N is not only constituent of chlorophyll molecule (Dechen & Nachtigall, 2007). So, with the increase of N doses in solution can be having predominantly N accumulation in other compounds instead of in chlorophyll. According
Season Dry Rainy L e a f N /P 0 5 10 15 20 25 30 Soil Clay Sandy L e a f N /P 0 5 10 15 20 25 30 Crown
Base Middle Apex
L e a f N /P 0 5 10 15 20 25 30
Clone VM-01 Clone I-144
Clone VM-01 I-144 L e a f N /P 0 5 10 15 20 25 30
Crown Base Crown Middle Crown Apex
Dry Season Rainy Season
ns a b c d p<0.05 p<0.001 p<0.10 p<0.05 p<0.01 p<0.10 p<0.01 p<0.001 Clay Soil Sandy Soil
23
to Fontes (2011), in a situation of luxury consumption the N excess is accumulated in plants as NO3-, and still not incorporated into the chlorophyll molecules. Therefore, the SPAD use in the plant N status diagnosis should be taken with caution, since it has some limitations because it is not a specific indicator for N.
Figure 8. Chlorophyll of eucalyptus clones in different soils for each season (a), in
different seasons for each soil (b), in different clones for each position of leaves collect in the crown (c) and in different crown positions for each clone (d). ns represents not significant at 10 % by F test (p>0.10). Means with the same letter, in each clone, are not significantly different by Tukey (p<0.05).
CONCLUSIONS
- The concentrations of N-NH4+ (root) and N-NO3- (root and leaf) showed use potential for predicting eucalyptus N requirements in greenhouse (highest correlation
Season Dry Rainy Chl or ophy ll (µg cm -2 ) 0 10 20 30 40 50 60 70 Soil Clay Sandy Chl or ophy ll (µg cm -2 ) 0 10 20 30 40 50 60 70 Clone VM-01 I-144 Chl or ophy ll (µg cm -2 ) 0 10 20 30 40 50 60 70 Crown
Base Middle Apex
Chl or ophy ll (µg cm -2 ) 0 10 20 30 40 50 60 70 a p<0.01
Dry Season Rainy Season
Clay Soil Sandy Soil
Clone VM-01 Clone I-144
b
c d
p<0.001 ns p<0.001
p<0.05
ns
p<0.001 p<0.001 p<0.001
b a
ab
Canopy Base Canopy Middle
24
coefficients- r), however, these mobile N forms (mainly N-NO3-) did not represent well the soil N levels in different seasons and regions evaluated in the field;
- It was observed similar responses for leaf N/P, chlorophyll and SPAD readings to N application in greenhouse (quadratic and square root models), with highest values of r for clone VM-01, and the N/P and chlorophyll in different seasons and regions did not reflect the real differences in soil N status in the field;
- The total N leaf concentration is not good indicator of N status, because it did not have highest values of r in greenhouse. Nevertheless, of all indicators evaluated, it better represented the variations in soil N status in different seasons and regions assessed for eucalyptus clones under field conditions.
LITERATURE CITED
ALCÁNTAR, G.; SANDOVAL, M.; CASTELLANOS, J.Z.; MÉNDEZ, F.; SÁNCHEZ, P. & RODRÍGUEZ, M.N. Diagnostic methods to evaluate nutrient status of garlic, onion, and broccoli. Commun. Soil Sci. Plant, 33: 2585-2598, 2002.
ALVA, A.K.; PARAMASIVAM, S. & GRAHAM, W.D. Impact of nitrogen management practices on nutritional status and yield of Valencia orange trees and groundwater nitrate. J. Environ. Qual., 27: 904-910, 1998.
ALVAREZ V., V.H.; NOVAIS, R.F.; BARROS, N.F.; CANTARUTTI, R.B. & LOPES, A.S. Interpretação dos resultados das análises de solos. In: RIBEIRO, A.C.; GUIMARÃES, P.T.G. & ALVAREZ V., V.H. eds. Recomendações para o uso de corretivos e fertilizantes em Minas Gerais. 5ª aproximação.Viçosa, CFSEMG, 1999. p.25-32.
ARAÚJO, C. Adubação nitrogenada de hortaliças: princípios e práticas com o tomateiro. Viçosa, UFV, 2007. 148p.
BARROS, N.F. & NOVAIS, R.F. Eucalyptus nutrition and fertilizer regimes in Brazil. In: ATTIWILL, P.M. & ADAMS, M.A., eds. Nutrition of eucalyptus. Austrália, CSIRO, 1996. p.335-355.
BREMNER, J.M. Nitrogen Total. In: SPARTS, D.L., ed. Methods of gril analysis. Chemical Methods, 1996. p.1085-1121.
CALDEIRA, M.T.M.; SANT’ANNA, R.; CAMBRAIA, J.; BARROS, N.F. &
NOVAIS, R.F. Efeito da interação N x S sobre a composição das frações nitrogenada e sulfurada e sobre a atividade da redutase do nitrato em eucalipto. R. Bras. Fisiol. Veg., 61:59-65, 1994.
25
CHAPIN, S.F.; FOLLET, J.M. & O’CONNOR, K.F. Growth, phosphate absorption, and phosphorus chemical fractions in two Chionochloa species. J. Ecol., 70:305-321, 1982.
CLARK, R.B. Characterization of phosphatase of intact maize roots. J. Agr. Food Chem., 23:458-460, 1975.
DECHEN, A.R. & NACHTIGALL, G.R. Elementos requeridos à nutrição de plantas. In: NOVAIS, R.F.; ALVAREZ V, V.H.; BARROS, N.F.; FONTES, R.L.F.; CANTARUTTI, R.B. & NEVES, J.C.L., eds. Fertilidade do solo. Viçosa, SBCS, 2007. p.91-132.
EMBRAPA. Centro Nacional de Pesquisa de Solos. Sistema brasileiro de classificação de solos. 2.ed. Rio de Janeiro, Embrapa Solos, 2006. 306p.
FONTES, P.C.R. Nutrição mineral de plantas: avaliação e diagnose. Viçosa, UFV, 2011. 296p.
FOULKES, M.J.; HAWKESFORD, M.J.; BARRACLOUGH, P.B.; HOLDSWORTH, M.J.; KERR, S.; KIGHTLEY, S. & SHEWRY, P.R. Identifying traits to improve the nitrogen economy of wheat: Recent advances and future prospects. Field Crop Res., 114:329-342, 2009.
GAMA-RODRIGUES, E.F.; BARROS, N.F.; GAMA-RODRIGUES, A.C. & SANTOS, G.A. Nitrogênio, carbono e atividade da biomassa microbiana do solo em plantações de eucalipto. R. Bras. Ci. Solo, 29:893-901, 2005.
GIVNISH, T.J. Adaption to sun and shade: a whole-plant perspective. Aust. J. Plant Physiol., 15:63-92, 1988.
GRESPAN, S.L.; DIAS, L.E. & NOVAIS, R.E. Crescimento e parâmetros cinéticos de absorção de amônio e nitrato por mudas de Eucalyptus spp. submetidas a diferentes relações amônio/nitrato na presença e ausência de fósforo. R. Bras. Ci. Solo, 22:667-674, 1998.
GROFFMAN, P. Nitrogen in the environment. In: SUMMER, M.E. ed. Handbook of soil science. Boca Raton, CRC Press, 2000.
HOCKING, P.J. Effects of sowing time on nitrate and total nitrogen concentrations in field-grown canola (Brassica napus L.) and implications for plant analysis. J. Plant Nutr., 24:43-59, 2001.
JUDD, T.S.; ATTIWILL, P.M. & ADAMS, M.A. Nutrient concentrations in
Eucalyptus: A synthesis in relation to differences between taxa, sites, and components.
In: ATTIWILL, P.M.& ADAMS, M.A., eds. Nutrition of eucalyptus. Australia, CSIRO, 1996. p.123-153.
26
KNIGHT, P.J. & NICHOLAS, I.D. Eucalyptus nutrition: New Zealand experience. In: ATTIWILL, P.M. & ADAMS, M.A., eds. Nutrition of eucalyptus. Australia, CSIRO, 1996. p.275-302.
LE ROUX, X.; SINOQUET, H. & VANDAME, M. Spatial distribution of leaf dry weight per area and leaf nitrogen concentration in relation to local radiation regime within an isolated tree crown. Tree Physiol., 19:181-188, 1999.
LEITE, F.P.; SILVA, I.R.; NOVAIS, R.F.; BARROS, N.F.; NEVES, J.C.L. & VILLANI, E.M.A. Nutrient relations during an eucalyptus cycle at different population densities. R. Bras. Ci. Solo, 35:949-959, 2011.
LOCATELLI, M.; BARROS, N.F.; NEVES, J.C.L. & NOVAIS, R.F. Efeito de formas de nitrogênio sobre o crescimento e composição mineral de mudas de eucalipto. Agrotrópica, 8:53-69, 1984.
MADEIRA, A.C.; MADEIRA, M.; FABIÃO, A.; MARQUES, P. & CARNEIRO, M. Avaliação da nutrição de plantações jovens de eucalipto por análise foliar e métodos não destrutivos. R. Ci. Agrar., 32:139-153, 2009.
MAIER, N.A. & CHVYL, W.L. Seasonal variation in nutrient status of australian waxflowers. J. Plant Nutr., 26:1873-1888, 2003.
MARSCHNER, P. Mineral nutrition of higher plants, 3nd ed., London, Academic Press, 2012. 651p.
MOREIRA, F.M.S. & SIQUEIRA, J.O. Microbiologia e bioquímica do solo. Lavras, Universidade Federal de Lavras, 2002. 625p.
OLFS, H.W.; BLANKENAU, K.; BRENTRUP, F.; JASPER, J.; LINK, A. & LAMMEL, J. Soil-and plant-based nitrogen-fertilizer recommendations in arable farming. J. Plant Nutr. Soil Sci., 168:414-431, 2005.
PERDOMO, C.; DURÁN, J. & LLOVET, P. Soil and plant indices for predicting eucalypt response to nitrogen in Uruguay. Soil Sci. Soc. Am. J., 71:1708-1718, 2007.
PINTO, S.I.C.; FURTINI NETO, A.E.; NEVES, J.C.L.; FAQUIN, V. & MORETTI, B.S. Eficiência nutricional de clones de eucalipto na fase de mudas cultivados em solução nutritiva. R. Bras. Ci. Solo, 35:523-533, 2011.
RAIJ, B. van; CANTARELLA, H.; QUAGGIO, J.A. & FURLANI, A.M.C. Recomendações de adubação e calagem para o Estado de São Paulo. Campinas, Instituto Agronômico, 1997. 285p. (Boletim Técnico, 100)
27
RUBIO-COVARRUBIAS, O.A.; BROWN, P.H.; WEINBAUM, S.A.; JOHNSON, R.S. & CABRERA, R.I. Evaluating foliar nitrogen compounds as indicators of nitrogen status in Prunus persica trees. Sci. Hortic., 120:27-33, 2009.
RUIZ, H. A. Incremento da exatidão da análise granulométrica do solo por meio da coleta da suspensão (silte + argila). R. Bras. Ci. Solo, 29:297-300, 2005.
SANTANA, R.C.; BARROS, N.F. & NEVES, J.C.L. Eficiência de utilização de nutrientes e sustentabilidade da produção em procedências de Eucalyptus grandis e
Eucalyptus saligna em sítios florestais do Estado de São Paulo. R. Árvore, 26:447-457,
2002.
SAS Institute Inc. 2004. SAS/STAT®9.1 User’s Guide. Cary, NC: SAS Institute Inc.
SHEDLEY, E.; DELL, B. & GROVE, T. Diagnosis of nitrogen deficiency and toxicity of Eucalyptus globulus seedlings by foliar analysis. Plant Soil, 177:183-189, 1995.
SMETHURST, P.J.; HOLZA, G.; MORONIA, M. & BAILLIE, C. Nitrogen management in Eucalyptus nitens plantations. Forest. Ecol. Manage., 193:63-80, 2004.
SMITH, F.W. & LONERAGAN, J.F. Interpretation of Plant Analysis: Concepts and Principles. In: Plant Analysis: An Interpretation Manual. Collingwood, Victoria (Australia), CSIRO Publishing, 1997. p.3-33.
TEDESCO, M.J.; GIANELLO, C.; BISSANI, C.A.; BOHNEN, H. & WOLKWEISS, S.J. Análises de solo, plantas e outros materiais. 2.ed. Porto Alegre, Universidade Federal do Rio Grande do Sul, 1995. 174p.
TURNBULL, T.L.; KELLY, N.; ADAMS, M.A. & WARREN, C.R. Within-canopy nitrogen and photosynthetic gradients are unaffected by soil fertility in field-grown
Eucalyptus globules. Tree Physiol., 27:1607-1617, 2007.
WELLBURN, A.R. The spectral determination of chlorophylls a and b, as well as carotenoids, using various solvents with spectrophotometers of different resolution. J. Plant Physiol., 144:307-313, 1994.
YANG, J.E.; SKOGLEY, E.O.; SCHAFF, B.E. & KIM, J.J. A simple Spectrophotometric determination of nitrate in water, resin, and soil extracts. Soil Sci. Soc Am. J., 62:1108-1115, 1998.
28
CHAPTER 2 – Differential behavior of young eucalyptus clones in relation
to nitrogen supply
Abstract- Nitrogen is a nutrient required in large amounts by plants; however, for
eucalyptus the effects of its application on dry matter production are divergent. There are nutritional differences among eucalyptus species, especially with respect to plant response to N. Thus, the aim this work was to evaluate the differential behavior of eucalyptus clones in growth, mineral nutrition and gas exchanges under N doses. A greenhouse experiment was carried out using nutrient solution (Clark, 1975, modified by Locatelli et al., 1984). The treatments consisted of two eucalyptus clones (VM-01 and I-144) and six doses of N (0, 0.74, 2.93, 4.39, 5.85 and 8 mmol L-1 of NH4NO3), arranged in a 2 x 6 factorial and laid out in randomized complete block design with five replications. After 60 days of treatment application, we assessed dry matter production, height, collar diameter and root length, gas exchanges and leaf concentration of macro and micronutrients. The gas exchanges were measured in youngest fully expanded leaves of plants using an infrared gas analyzer (IRGA) with constant radiation (1000
μmol m-2 s-1) and environment temperature and humidity. The results were submitted to analysis of variance and regression models were fit to data. Clone VM-01 was superior in height, height/collar diameter and it also had higher leaf concentration of all macronutrients and of Cu, Fe, Mo and Zn. On the other hand, clone I-144 showed greater production of total and root dry matter, root/shoot and collar diameter, moreover of greater stomatal conductance (gs) and transpiration (E). Therefore, these two eucalyptus clones exhibited a differential behavior and clone I-144, despite lower N leaf concentration, showed, in general, better growth compared to clone VM-01, thus having highest utilization efficiency of this nutrient.
Keywords: gas exchanges, growth, mineral nutrition, nutrient solution.
INTRODUCTION
Brazil is one of the largest producers of cellulose and paper in the world from
eucalyptus plantations (SBS, 2006). Eucalyptus is the most widely planted forest
species in Brazil, being planted on nearly 4.9 million hectares in 2011 (ABRAF, 2012).
Most eucalyptus forests in Brazil are planted in low fertility soils, frequently resulting in
29
al., 2011), and evidence of nutritional deficiencies have been documented (Silveira et
al., 1995). Consequently, Brazil is the country where have been observed higher
responses to mineral fertilization by eucalyptus (Pinto, 2009), with the necessity of application of high amounts of fertilizer to obtain greater productivity (Barros et al., 2004).
Nitrogen is one of the most limiting factors for plant growth and development (Majerowicz et al., 2000), being required in large amounts (Marschner, 2012). However, for eucalyptus the effects of its application on production of dry matter are positive in some cases (Smethurst et al., 2004; Jesus et al., 2012) and, in others, without positive response (Stape & Benedetti, 1997; Garategui, 2002; Pulito, 2009). Gonçalves
et al. (2000) report that the intensity of the response of eucalyptus to N fertilization is of
low magnitude. Also, studies (Furtini Neto et al., 1996; Santana et al., 2002) have verified nutritional differences among eucalyptus species, as plant response to N (Pinto et al., 2011). These last researchers point to out the understanding of nutrient demand and the genetic materials efficiency in converting the absorbed nutrients into biomass as an important aspect. There is wide intra and interspecific variability for eucalyptus species, mainly in features such as biomass production and growth rate (Chaperon, 1987). Changes in the root to shoot ratio in response to nutrient availability may be related to the maximization of acquisition and use of the available nutrients and carbohydrates to plant growth (Cruz et al., 1993; Majerowicz & Kerbauy, 2002). There is a limited understanding of the mechanisms that drive the partitioning of carbohydrates and nutrients between different plant parts (Marschner et al., 1996).
30
of absorbed N (Hay & Porter, 2006), existing a tight relation between leaf area index (LAI) and absorbed N (Hirel et al., 2007). There is, consequently, a close relation among N supply, leaf N distribution and leaf photosynthesis (Gasta & Lemaire, 2002).
Finally, it is expected that the eucalyptus clones have different responses in growth due to differences in nutritional demand and photosynthetic rates influenced by N supply. Therefore, this study aimed to evaluate the differential behavior of young eucalyptus clones in growth, mineral nutrition and gas exchanges under the application of N doses in nutrient solution.
MATERIAL AND METHODS
The experiment was carried out in a greenhouse at the Soil Science Department of the Federal University of Viçosa, Viçosa (20°45’14” S, 42°52’53” W), Brazil, from July to September 2011. The air temperature in the greenhouse was recorded daily and it showed minimum and maximum values of 7.9 and 33.9 ºC, respectively, during the time of cultivation of plants. The first thirty days represented the stage of plant acclimatization in nutrient solution and the other sixty days represented the exposure time of plants to treatments. The nutrient solution of Clark (1975), modified to contain the N-NH4+/N-NO3- equal to 1 (Locatelli et al., 1984) and the double of P concentration (Caldeira et al., 1994), was used in this study: macronutrients (mmol L-1; 1.30 CaCl2.2H2O, 0.30 MgSO4.7H2O, 0.069 KH2PO4, 0.53 KCl, 0.30 K2SO4 and 0.069 NaH2PO4.H2O) and micronutrients (µmol L-1; 19.0 H3BO3, 7.0 MnCl2.4H2O, 0.5 CuSO4.5H2O, 2.0 ZnSO4.7H2O, 0.086 (NH4)6Mo7O24.4H2O and 40.0 FeEDTA), varying only the N dose, with 2.93 mmol L-1 of NH4NO3 as reference dose.
The concentration of nutrient solution at the stage of plant acclimatization was gradually increased (25, 50, 75 and 100 % of original concentration) by each seven days. In this same stage the plants were placed in a collective plastic tray (11 L). After acclimatization, homogeneous plants were selected in relation to height and vigor and two plants were transferred to each plastic pot (6 L) composing an experimental unit. The nutrient solution was maintained under permanent aeration and changed weekly, using deionized water, and its pH was adjusted daily to 5.5 ± 0.05 (Locatelli et al., 1984) with addition of a solution of H2SO4 or NaOH (0.1 mol L-1).