Implementation of criteria for automatic release
of clinical chemistry test results in a laboratory
at an academic public hospital
Implantação de critérios de liberação automática de resultados de bioquímica
em um laboratório de hospital público universitário
Myriam S. Feitosa1; Daniel Henrique Bücker1; Silvana Maria E. Santos2; Leonardo S. Vasconcellos2
1. Hospital das Clínicas da Universidade Federal de Minas Gerais (HC/UFMG), Minas Gerais, Brazil. 2. Falcudade de Medicina da UFMG, Minas Gerais, Brazil.
First submission on 12/02/16; last submission on 18/03/16; accepted for publication on 28/03/16; published on 20/06/16
ABSTRACT
Introduction: Autoveriication is the release of laboratory test results from clinical instruments to hospital interface, or to patients’ records, with no human intervention. Veriication rules are inserted in the middleware and/or in the laboratory information system (LIS), based on criteria established by the laboratory. As a result, it ensures that every result is consistently reviewed in the same way, improving the entire veriication process and patient safety. Objective: Describe the implementation of autoveriication of clinical chemistry tests results at the core laboratory of Hospital das Clínicas da Universidade Federal de Minas Gerais (HC/UFMG), Brazil. Material and methods: Twenty-six automated chemistry assays were chosen. They were fully automated including internal quality control, interfaced with LIS, available 24 hours a day, seven days a week. Rules were set up in the middleware and in the LIS. Instrument lags, evaluation of sample integrity, test linearity, delta check and critical values were used to construct the veriication algorithms. Results: An autoveriication algorithm was constructed; delta check values were calculated and deined, as well as automatic veriication ranges. The results retained for manual veriication followed a lowchart prepared for this purpose. Conclusion: Autoveriication implementation led to a more consistent reviewing process of test results, eficiency and improved patient safety.
Key words: algorithms; clinical laboratory information systems; laboratory test; patient safety; laboratories hospital; automatic data processing.
INTRODUCTION
Autoveriication is a process of automatic release of laboratory results with no need for human intervention. A software automatically assesses test results based on criteria established by the laboratory, and releases these results without the intervention of a qualiied professional(1-4).
According to the document of the Clinical and Laboratory Standards Institute (CLSI) – Autoveriication of Clinical Laboratory Tests Results; Approved Guideline(AUTO10-A) –, autoveriication criteria can be deined by the user and adapted to different settings and services. They may include reference values, internal quality control results, instrument lagging, delta check (comparison of the current exam results against another previous result of the same patient, if there is one), reagent lot checks, demographic information about patients, clinical information, critical values and others(3).
In some more sophisticated systems, comments may also be inserted in medical records, based on patterns of laboratory results(5, 6).
Implementing autoveriication leads to standardized result veriication criteria, reduction of turnaround time (TAT)(2), optimization of laboratory staff working time, allowing them to focus on results that really need a more detailed interpretation, and discuss important cases with the ordering physicians. Communication of critical results, assurance of the quality of the released results, and, greater safety to the patients cared for(3, 7, 8) are other gains of autoveriication.
The rules of autoveriication may be inserted in the middleware and/or in the laboratory information system (LIS). Middleware is the software that links LIS and instruments(2, 5).
In most services, processes of validation and veriication of results take place in a manual form, even with the widespread use
of computers in laboratories. Results are released individually, and they may reach hundreds per shift. This task demands qualiied professionals, and it is ruled by law(9), because it is a critical moment, in which phases prior to test conduction are reviewed. It is time consuming and highly subjective, depending on knowledge and experience of the professional releasing results. A good strategy to minimize these variables is the implementation of automatic result release(4, 5).
Autoveriication in laboratory medicine services may expedite result release and ensure greater safety to patients when it permits that truly altered results be reviewed with the necessary standards of care(2, 8, 10, 11).
Unfortunately, the literature is scarce in works detailing how to implement rules and algorithms for the automatic release of laboratory results(8, 12-14), mainly in the national scenario(15).
The objective of the current work was to describe the implementation of autoveriication in biochemical tests of the emergency test menu at the core laboratory of Hospital das Clínicas da Universidade Federal de Minas Gerais (HC/UFMG).
MATERIAL AND METHODS
Core laboratory of HC/UFMG
The HC/UFMG is a public university tertiary general hospital afiliated to the Uniied Health System (UHS), and it provides care in all medical specialties, except radiotherapy. It is a
national reference in transplantations, oncologic treatments and chemotherapy, maternity ward and high-risk nursery, among others. It has a 509-bed installed capacity, with 144 beds distributed between the intensive care unit and the emergency department.
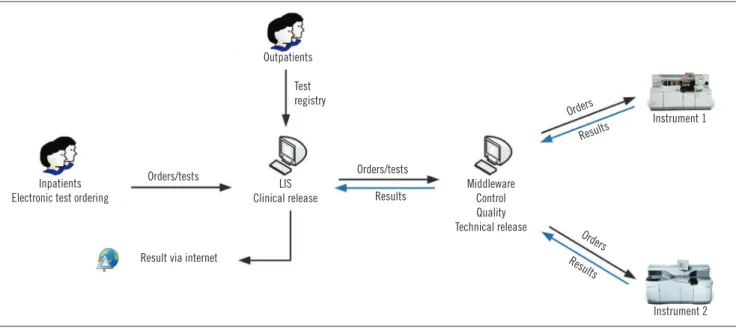
At the core laboratory of HC/UFMG, the clinical release of results is carried out by legally able, trained professionals, such as physicians, biochemists, or biomedical scientists(9). The criteria used for release are personal and depend on the professional’s technical formation and experience. During this step, professionals use their knowledge and mental algorithms for the detection of any pre-analytical, analytical or post-analytical error that can impair inal results. In the absence of result inconsistencies, reports are electronically released so that they can be consulted online or printed, and delivered to the patient or the attending physician (Figure 1).
Definition of tests to be autoverified
The chemistry assays of the emergency test menu that underwent autoveriication were those carried out in instruments Vitros®5.1 and 5600, interfaced with LIS, available 24 hours a day, seven days a week. Internal quality control had already become fully interfaced, and all actions were taken and records related to controls were kept in the middleware.
The 26 autoveriied tests were: albumin, alanine transaminase (ALT), amylase, aspartate transaminase (AST), uric acid, bilirubin assays, calcium, total creatine phosphokinase (CPK), chlorine, total cholesterol, high-density lipoprotein (HDL)-cholesterol and
FIGURE 1 − Flow of test conduction at the core laboratory of HC/UFMG
HC/UFMG: Hospital das Clínicas da Universidade Federal de Minas Gerais; LIS: laboratory information system.
Inpatients Electronic test ordering
Orders/tests
LIS Clinical release
Test registry
Result via internet
Orders/tests
Results
Middleware Control Quality Technical release
Orders
Orders
Results
Results
Instrument 1
low-density lipoprotein (LDL)-cholesterol, creatinine, alkaline phosphatase, phosphorus, gamma-glutamyltransferase (GGT), glucose, lactate, D-lactate dehydrogenase, magnesium, C-reactive protein (CRP), total proteins and fractions, potassium, sodium, triglycerides, and urea.
Development of algorithms of automatic release
The algorithms of automatic release were developed according to the guidelines of the document AUTO10-A(3). A general algorithm was designed for the deined tests, and the values for each test were established, in each step. As results are released in two steps – in the middleware and in the LIS –, the algorithm must foresee the actions in each one of them.
Middleware design
In the analytical phase, release criteria regarding integrity of the biological sample were set in the middleware, as well as equipment errors, interference with the reaction, and quality control. The module of quality control in the middleware was set to not carry out (block) the test, in case the results of internal control were not within the established intervals and approved by a professional trained in the system(16).
Since the instruments read the lipemia, turbidity and hemolysis indices of each sample, it was possible to set the lag (alert sign) in the middleware, corresponding to each interferent, if it were present in enough quantity to interfere with the test result. The interference limit of each of them for each test was set in the equipment by the manufacturer, and can be sent to the middleware. When they are present, a new sample must be ordered.
Besides sample quality and quality control lags, instrument error lags – which could release anomalous results or reports without results, so as to block the test – were also set. Speciic lags for some tests were set, which demand action from releasers, and block results.
In addition, tests with values outside the analytical linearity were retained for later dilution or investigation, when applicable. CRP, in its turn, was set to permit that results below linearity were released.
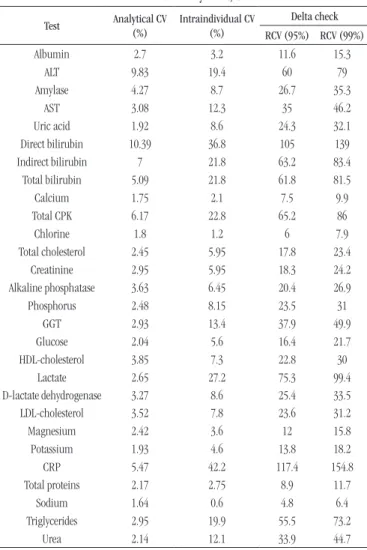
Definition of delta check values
Firstly, the delta check values of each analyte were established, and then the release algorithm was built in the LIS. In order to calculate the delta check value of each analyte, the reference change value (RCV)(12) was adopted, using the formula: RCV = 21/2* Z* [CV
A 2 + CV
I2]1/2, with: Z = 1.96 (95% signiicance) or 2.58
(99% signiicance); CVA= analytical coeficient of variation of the test; and CVI = coeficient of intraindividual biological variation.
CVA was calculated based on the average value of all coeficients of variation (CV), in all levels of control, during the year 2014. CVI was obtained based on literature data(17).
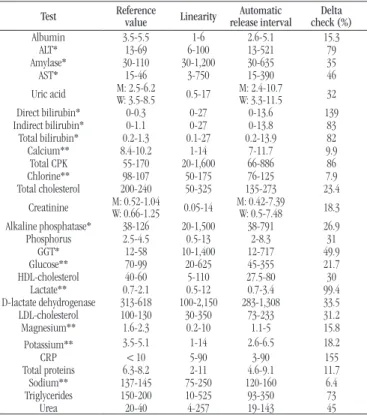
Calculation of the automatic release interval
The automatic release interval was deined as the average distance between the midpoint of the reference range and the low and high linear measurement limits of each test(2). All results within this interval and with no previous test to be compared with were programmed to be released automatically, as follows: Test: albumin
Reference range: 3.5-5 g/dl Linearity range: 1-6 g/dl
• midpoint of the reference range: (3.5 + 5)/2 = 4.25 g/dl • low limit of automatic release: [(4.25 - 1)/2] + 1 = 2.62 g/dl • high limit of automatic release: [(6 - 4.25)/2] + 4.25 = 5.1 g/dl
When reference values were distributed by age group and sex, the automatic release interval was altered based on the reference range. When results exceeded the interval of critical values deined by the laboratory, the critical values were adopted as limits, since they must be immediately reported to physicians. In other exams, when the limit of the release interval was within the adopted reference range, it was decided to keep the limit of the reference range.
For triglycerides, the automatic release was deined to be kept up to 399 mg/dl. If the result were ≥ 400 mg/dl, the sample would be retained for LDL to be measured. In samples with triglycerides < 400 mg/dl, total cholesterol and HDL were measured, and LDL and very low density lipoprotein(VLDL) were calculated based on these three parameters, using the classic Friedewald equation.
LIS configuration
In the LIS, values of delta check and automatic release interval were conigured. All the results previously released in the middleware were submitted to the LIS criteria. Rules were irstly applied just in results of one instrument and in two analytes at a time. The automatic release of each analyte was gradually enabled, after release of the irst morning routine, relative to inpatients.
detect any discrepancies and possible inadequate releases. For each test, values within and outside the deined release range, as well as delta check lags, were veriied.
Middleware and LIS were provided by Matrix Sistemas e Serviços® (São Paulo-SP, Brazil), MatrixMiddleware® 2.3.12 Release Build 7 (middleware) and MatrixDiagnosis® 2015.1.3.17 (Laboratory Information System [LIS]).
Design of a flowchart for manual result release
After the implementation of automatic release, a lowchart was designed to standardize the manual release of tests retained by the LIS. All the professionals at the core laboratory of HC/UFMG involved in test release were trained to deal with this low.
FIGURE 2 − Algorithm of automatic release used at the core laboratory of HC/UFMG
HC/UFMG: Hospital das Clínicas da Universidade Federal de Minas Gerais; LIS: laboratory information system.
Sample
Middleware
Test analyte
Controls approved?
Sample flag?
Equipment flag?
Linearity flag?
No
Yes
Yes
Yes
Yes
Yes
Corrective measures Block
test
Yes
No
No
No
No No
Recollection
Correct problem
Verify sample dilution protocol
Autoverification for LIS
LIS
Connect result
Delta check within the interval?
Manual release
Value within the defined release
interval?
Automatic report release
TABLE 1 − Values of delta check adopted for autoverification
at the core laboratory of HC/UFMG
Test Analytical CV
(%)
Intraindividual CV (%)
Delta check
RCV (95%) RCV (99%)
Albumin 2.7 3.2 11.6 15.3
ALT 9.83 19.4 60 79
Amylase 4.27 8.7 26.7 35.3
AST 3.08 12.3 35 46.2
Uric acid 1.92 8.6 24.3 32.1
Direct bilirubin 10.39 36.8 105 139
Indirect bilirubin 7 21.8 63.2 83.4
Total bilirubin 5.09 21.8 61.8 81.5
Calcium 1.75 2.1 7.5 9.9
Total CPK 6.17 22.8 65.2 86
Chlorine 1.8 1.2 6 7.9
Total cholesterol 2.45 5.95 17.8 23.4
Creatinine 2.95 5.95 18.3 24.2
Alkaline phosphatase 3.63 6.45 20.4 26.9
Phosphorus 2.48 8.15 23.5 31
GGT 2.93 13.4 37.9 49.9
Glucose 2.04 5.6 16.4 21.7
HDL-cholesterol 3.85 7.3 22.8 30
Lactate 2.65 27.2 75.3 99.4
D-lactate dehydrogenase 3.27 8.6 25.4 33.5
LDL-cholesterol 3.52 7.8 23.6 31.2
Magnesium 2.42 3.6 12 15.8
Potassium 1.93 4.6 13.8 18.2
CRP 5.47 42.2 117.4 154.8
Total proteins 2.17 2.75 8.9 11.7
Sodium 1.64 0.6 4.8 6.4
Triglycerides 2.95 19.9 55.5 73.2
Urea 2.14 12.1 33.9 44.7
HC/UFMG: Hospital das Clínicas da Universidade Federal de Minas Gerais; CV: coefficient of variation; RCV: reference change value; ALT: alanine transaminase; AST: aspartate transaminase; CPK: creatine phosphokinase; GGT: gamma-glutamyltransferase; HDL: high-density lipoprotein; LDL: low-density lipoprotein; CRP: C-reactive protein.
RESULTS
Automatic release algorithm
An algorithm was developed for implementation of autoveriication, which can be used in medical chemistry tests performed in instruments Vitros®5.1 and 5600. Some rules were mandatorily conigured in the middleware; and others, in the LIS (Figure 2).
Delta check results
TABLE 2 − Parameters used for configuration of tests in the LIS
at the core laboratory of HC/UFMG
Test Reference value Linearity release intervalAutomatic check (%)Delta
Albumin 3.5-5.5 1-6 2.6-5.1 15.3
ALT* 13-69 6-100 13-521 79
Amylase* 30-110 30-1,200 30-635 35
AST* 15-46 3-750 15-390 46
Uric acid M: 2.5-6.2W: 3.5-8.5 0.5-17 M: 2.4-10.7W: 3.3-11.5 32
Direct bilirubin* 0-0.3 0-27 0-13.6 139
Indirect bilirubin* 0-1.1 0-27 0-13.8 83
Total bilirubin* 0.2-1.3 0.1-27 0.2-13.9 82
Calcium** 8.4-10.2 1-14 7-11.7 9.9
Total CPK 55-170 20-1,600 66-886 86
Chlorine** 98-107 50-175 76-125 7.9
Total cholesterol 200-240 50-325 135-273 23.4
Creatinine M: 0.52-1.04W: 0.66-1.25 0.05-14 M: 0.42-7.39W: 0.5-7.48 18.3
Alkaline phosphatase* 38-126 20-1,500 38-791 26.9
Phosphorus 2.5-4.5 0.5-13 2-8.3 31
GGT* 12-58 10-1,400 12-717 49.9
Glucose** 70-99 20-625 45-355 21.7
HDL-cholesterol 40-60 5-110 27.5-80 30
Lactate** 0.7-2.1 0.5-12 0.7-3.4 99.4
D-lactate dehydrogenase 313-618 100-2,150 283-1,308 33.5
LDL-cholesterol 100-130 30-350 73-233 31.2
Magnesium** 1.6-2.3 0.2-10 1.1-5 15.8
Potassium** 3.5-5.1 1-14 2.6-6.5 18.2
CRP < 10 5-90 3-90 155
Total proteins 6.3-8.2 2-11 4.6-9.1 11.7
Sodium** 137-145 75-250 120-160 6.4
Triglycerides 150-200 10-525 93-350 73
Urea 20-40 4-257 19-143 45
*Lower value defined by the lower reference value; **one or both values defined by the test critical value; LIS: laboratory information system; HC/UFMG: Hospital das Clínicas of Universidade Federal de Minas Gerais; W: woman; M: man; ALT: alanine transaminase; AST: aspartate transaminase; CPK: creatine phosphokinase; GGT: gamma-glutamyltransferase; HDL: high-density lipoprotein; LDL: low density lipoprotein; CRP: C-reactive protein.
Automatic release interval
The automatic release intervals calculated for coniguration in the LIS can be seen in Table 2. When limits exceeded the critical values, these were adopted.
Flowchart of manual release of results
The lowchart created for the manual release of tests retained at the LIS is represented in Figure 3. Its inal form was deined with those in charge of test release and the technical sector medical coordination at the core laboratory of HC/UFMG.
DISCUSSION
This study describes the implementation of autoveriication in medical chemistry tests in a laboratory that serves outpatients and inpatients.
At the core laboratory of HC/UFMG, from January to October 2015, an average of 142 thousand tests per month was released, with 42 thousand (30%) inpatients and 100 thousand (70%) outpatients. Out of this total of tests, 78 thousand (56%) were chemistry assays, which may be ordered as a matter of urgency or routine, from inpatients and outpatients.
FIGURE 3 − Manual release flowchart of tests retained by autoverification at the core laboratory of HC/UFMG
HC/UFMG: Hospital das Clínicas da Universidade Federal de Minas Gerais.
Test result
Release result Communicate to the physician
Yes No
No
No Yes
Yes Yes Yes
No
No No
Yes
No
Yes Is it a
critical result?
Retained by delta check?
Are there other results of the order blocked by the
delta check?
Are alterations compatible with the available clinical data?
Release result
Result compatible with available clinical data?
Review controls Review crude
data
All processes
OK?
Correct the
problem Repeat the test
Results expected by the physician Contact the
physician
Review sample aspect/volume
The chosen tests are part of the emergency menu of HC/ UFMG, represent a signiicant fraction of the total released tests (56%) and are performed in two similar instruments interfaced with the LIS. The whole process of internal quality control of these tests was already interfaced with the middleware and incorporated into routine work, conditioning the beginning of autoveriication to the approval of internal controls by supervisors. Initiating the process by them, a positive immediate impact can be felt in TAT reduction and the improvement of result release, as described by other authors(2, 8, 13).
The design and implementation of the autoveriication algorithm followed the guidelines described in the document AUTO10-A(3), which advocates that the place for inclusion of autoveriication algorithms must be based on the characteristics and the resources of each system, as well as on the expertise and the preference of the involved professionals.
In the literature, a good part of the services also conigures the rules of autoveriication in the middleware and the LIS(13). However, there are authors that opted to conigure such rules preferably in the middleware(8); and others, just in the LIS(2).
In our service, a general algorithm was designed to be applied to all tests, and the parameterization of autoveriication algorithms occurred in both the middleware and the LIS.
Flowchart programming for result autoveriication is available in a good part of laboratory softwares, whose rules follow mathematical principles, such as Boolean logic (in the form of if… then statements), in a speciic order(15, 18). At the core laboratory of HC/UFMG, the enforcement of such rules, in the middleware (MatrixMiddleware®) and the LIS (MatrixDiagnosis®) was not complex. Both softwares already present speciic ields for the inclusion of delta check values and automatic release intervals, which can be differentiated as to patients’ sex and age. As to test linearity, values provided by the manufacturer, validated in the service, were adopted. On the other hand, the system proved limited for programming of Boolean rules that are more complex for the deinition of automatic release intervals, with different determining factors in relation to patients’ origin or clinical proile, for example.
Aiming at patient safety, it was fundamental that the autoveriication process was associated with quality internal controls(6, 16). At the core laboratory of HC/UFMG, there was no automatic result release without previous approval of internal controls recorded in the middleware, MatrixConnect®.
Sample alerts or lags were set in the equipment itself and sent to the middleware. In the current service, Vitros®
equipment routinely read icterus, hemolysis and turbidity indices in biological samples. The presence of these interferents in speciic concentrations that acknowledgely alter the analyte measure resulted in sample recollection, as demonstrated in the autoveriication algorithm.
Equipment lags were also set according to the material provided by the equipment manufacturer. Some tests have speciic reading lags, principally when there is a mechanical problem and error in the conduction of a test or inal reading of the reaction, what causes result retention.
In the automation instruments at the core laboratory of HC/UFMG, the dilution protocols of each test were already developed. In them, the sample linearity lag was also important, because it informed the operators about the necessity to return with it to the equipment for dilution. All these conducts were foreseen in the autoveriication algorithm. The tests that did not have any alert were automatically released to the LIS, MatrixDiagnosis®.
In the literature, delta checks are also frequently used in autoveriication algorithms(2, 3, 8, 12, 19). They can be produced from studies of pair result exams in a population similar to that in which it will be applied. Differences between the tests are plotted in a frequency distribution histogram. The values to be used are chosen in 1% or 5% of the encountered values. In the present work, a 99% (p < 0.01) conidence interval (CI) was used to calculate the RCV to be inserted as delta check in each test.
Delta check values can also be established according to the service experience, and adjusted in an empirical form. RCV, based on probability, analytical precision and/or intraindividual variation, also proved an objective measure for evaluation of seried results(12). Fraser et al. (2002) obtained around 60% of autoveriied tests, using delta check and the clinical decision limit as criteria for automatic release(12). However, the theoretical disadvantage of using just this formula as a criterion is the occurrence of false positives in sick individuals, as CVI was established in healthy individuals(17).
REFERENCES
1. Duca DJ. Autoveriication in a laboratory information system. Lab Med. 2002; 33: 21-5.
2. Torke N, Boral L, Nguyen T, Perri A, Chakrin A. Process improvement and operational eficiency through test result autoveriication. Clin Chem. 2005; 51: 2406-8. PubMed PMID: 16306113.
values, the decision was to establish the interval in critical values to assure immediate communication of medical results(2).
In the literature, there is no consensus over the interval to be considered for results to be released automatically. There are laboratories that adopted the linearity range as the release limit(13). Shih et al. (2011) used the limits of the linearity range, but in the exams with a large interval, they conducted a statistical study of prevalence using values between 2%-98%(8).
One of the beneits of result autoveriication is to ensure that all results go through the same process, and are governed by the same assessment rules, before being released, thus increasing process consistency and patient safety(2, 3, 8, 20).
The lowchart for release of results retained at the LIS was designed to assure consistency in the manual release of these exams. The actions to be taken were decided based on the cause for retention of the exam at the LIS. Those responsible for the release of these exams also participated in the development of the low and were enabled for this function.
Although it was not the object of study of the current article, another advantage of the automatic release described
in the literature is the reduction of TAT. Torke et al. (2005) reported reduction in 22% of test TAT after implementation of autoveriication(2). At the core laboratory of HC/UFMG, the percentage of released exams in up to 120 minutes changed from around 50% in the pre-autoveriication period to around 83% post-implementation. Outpatient tests, released in up to two hours, changed from around 4% to around 60%. The service also had reduction of available manforce, principally the involved professional enabled for result release.
CONCLUSION
The criteria and algorithms for automatic result release were deined and implemented for clinical chemistry tests of the emergency menu at HC/UFMG. The processes of manual release of the exams retained by the LIS were also standardized and implemented with the creation of a lowchart and the training of the involved personnel. The employment of autoveriication in emergency chemistry assays at the core laboratory of HC/UFMG enabled standardization and safety in result release.
RESUMO
Introdução: A verificação automática dos resultados consiste na liberação dos resultados dos exames diretamente do
equipamento, sem intervenção humana. São inseridas regras para avaliar os resultados no middleware e/ou no sistema de informação laboratorial (SIL), com base em critérios estabelecidos pelo laboratório. A autoverificação uniformiza os critérios de liberação e melhora a eficiência no processo, garantindo a segurança do paciente. Objetivo: Descrever a implantação da autoverificação nos testes bioquímicos do menu de urgência no Serviço de Medicina Laboratorial (SML) do Hospital das Clínicas da Universidade Federal de Minas Gerais (HC/UFMG). Material e métodos: Foram configurados 26 testes bioquímicos disponíveis 24 horas por dia, plenamente interfaceados, inclusive o controle interno da qualidade. Definiram-se parâmetros e algoritmos usados para configuração do SIL e no middleware. No algoritmo elaborado para autoverificação, foram incluídos
lags de equipamento, presença de interferentes na amostra, linearidade, delta check e valores críticos. Resultados: O algoritmo de liberação automática de resultados, os valores de delta check, os intervalos de liberação automática e o fluxograma para liberação manual dos resultados retidos foram definidos e implantados. Conclusão: A implantação da autoverificação nos testes bioquímicos do menu de urgência no serviço possibilitou padronização e segurança na liberação dos resultados.
Unitermos: algoritmos; sistemas de informação em laboratório clínico; testes laboratoriais; segurança do paciente; laboratórios
hospitalares; processamento automatizado de dados.
3. CLSI. Autoveriication of clinical laboratory tests results. Approved Guideline (AUTO10-A). Wayne, PA, USA; 2006.
4. Johnstone LM. A practical approach to the implementation of autoverify. Accred Qual Assur. 2004; 9: 155-8.
6. Jones JB. A strategic informatics approach to autoveriication. Clin Lab Med. 2013; 33: 161-81. PubMed PMID: 23331736.
7. Pearlman ES, Billelo L, Stauffer J, Kamarinos A, Miele R, Wolfert MS. Implications of autoveriication for the clinical laboratory. Clin Leadersh Manag Rev. 2002; 16: 237-9. PubMed PMID: 1268427.
8. Shih MC, Chang HM, Tien N, Hsiao CT, Peng CT. Building and validating an autoveriication system in the clinical chemistry laboratory. Lab Med. 2011; 42: 668-73.
9. ANVISA. Resolução da diretoria colegiada RDC nº 302, de 13 de outubro de 2005.
10. Davis GM. Autoveriication of the peripheral blood count. Lab Med. 1994; 25: 528-31.
11. Davis GM. Autoveriication of macroscopic urinalysis. Lab Med. 1999; 30: 56-60.
12. Fraser CG, Stevenson MP, Kennedy IMG. Biological variation data are necessary prerequisites for objective autoveriication of clinical laboratory data. Accred Qual Assur. 2002; 7: 455-60.
13. Krasowski MD, Davis SR, Drees D, et al. Autoveriication in a core clinical chemistry laboratory at an academic medical center. J Pathol Inform. 2014; 5: 13. PubMed PMID: 24843824.
14. Martinez-Nieto O, Lozano-Gaitán A, Beltran-Diaz P, Mojica-Figueroa IL, Morales-Reyes OL, Isaza-Ruget MA. Autoveriication of the automated blood cell counter (CBC) in a reference laboratory in Bogota, Colombia. J Bras Patol Med Lab. 2015; 51: 369-75.
15. Melo MR, Melo KC, Faria CDC. Utilidade de regras booleanas aplicadas à liberação de resultados de exames hormonais e marcadores tumorais. J Bras Patol Med Lab. 2006; 42: 252-64.
16. Westgard JO. Taking autoveriication to the next level – up or down? In: Westgard JO, editor. Nothing but the truth about quality. US: Westgard QC; 2004. p. 103-10.
17. Minchinela J, Ricós C, Perich C, et al. Biological variation database, and quality speciications for imprecision, bias and total error (desirable and minimum). The 2014 update [Internet]. Available at: http://www. westgard.com/biodatabase-2014-update.htm. Accessed on: 12 fev 2016. 18. Dorizzi RM, Caruso B, Meneghelli S, Rizzo TTP. The DNSevTM expert system in the autoveriication of tumor markers and hormones results. Accred Qual Assur. 2006; 11: 303-7.
19. Straseski JA, Strathmann FG. Patient data algorithms. Clin Lab Med. 2013; 33: 147-60. PubMed PMID: 23331735.
20. Valdiguié PM, Rogari E, Philippe H. VALAB: expert system for validation of biochemical data. Clin Chem. 1992; 38: 83-7. PubMed PMID: 1733611.
CORRESPONDING AUTHOR
Leonardo S. Vasconcellos