Preoperative Planning for Renal Cell Carcinoma - Benefits of
64-Slice CT Imaging
Manjiri Dighe, Thomas Takayama, William H. Bush Jr
Department of Radiology (MD, WHB), and Department of Surgery (TT), University of Washington
Medical Center, Seattle, Washington, USA
ABSTRACT
Surgery is the primary form of treatment in localized renal cell carcinoma. Adrenal-sparing nephrectomy, laparoscopic nephrectomy and nephron-sparing partial nephrectomy are growing trends for more limited surgical resection. Accurate preoperative imaging is essential for planning the surgical approach. Multislice CT and MR are regarded as the most efficient modalities forimaging renal neoplasms. Development of faster CT systems like 64-slice CT with improved resolution and capability to achieve isotropic reformats have significantly enhanced the role of CT in imaging of renal neoplasms. This review article describes the present state, technique and benefits of 64-slice CT scanning in preoperative planning for RCC.
Key words: renal cell carcinoma; imaging, three-dimensional; surgery Int Braz J Urol. 2007; 33: 305-12
INTRODUCTION
Renal cell carcinoma (RCC) is the fifth most common cancer in adults and accounts for 85% of all malignant tumors of the kidney (1). It represents 3% of all male and 2% of female cancers. The incidence of RCC is 6.0 - 8.0 per 100,000 of the population (2). Surgery is the primary form of treatment in localized renal cell carcinoma. In addition, adrenal-sparing nephrectomy, laparoscopic nephrectomy and nephron-sparing partial nephrectomy are growing trends for more limited surgical resection (3). The aims of preoperative imaging are to characterize the lesion, identify accessory vessels, define adjacent organ extension, identify lymph nodal or visceral metastases, reliably predict the presence and extent of any
thrombus in the renal vein, vena cava and heart and evaluate the other kidney.
Multislice CT and MR are regarded as the most effective modalities for imaging renal neoplasms. Development of faster CT systems like the 64-slice CT scanner with improved resolution and capability to achieve isotropic reformats have significantly enhanced the role of CT in preoperative imaging of renal neoplasms.
IMAGING TECHNIQUE AND
PROTOCOLS WITH 64 SLICE
MULTIDETECTOR TECHNOLOGY
al-lowing image acquisition through the entire kidney during various phases of contrast enhancement after the administration of a single bolus of intravenous con-trast material (4-7). Multi-detector 64-slice CT tech-nology takes advantage of significantly reduced im-age acquisition time for multi-phasic, thin-slice imim-age acquisitions of the kidneys in a single breath-hold with superior contrast bolus utilization.
A precontrast phase provides a baseline from which to measure the enhancement within the lesion after the administration of intravenous contrast mate-rial. Calcifications are also seen in 30% of cases of RCC. The enhancement characteristic is important in distinguishing hyperdense cysts from solid tumors (Fig-ures-1A and 1B). Because most renal cell carcinomas have a rich vascular supply, they enhance significantly after administration of intravascular contrast material. Enhancement values of more than 15-20 HU are con-sidered suspicious for malignancy (8); more variation in enhancement is found with small masses due to the dense opacification of adjacent normal parenchyma.
Generally, dual phase imaging with a nephrographic phase and a delayed phase is used for evaluating suspected renal neoplasms and depicting perinephric extension and vascular anatomy. For dual phase imaging, 150 mlof non-ionic lower osmolality con-trast media (320 mg ml-1) is injected at 3 cc/sec and
images are acquired following delaysof approximately 90 seconds and 6 minutes for the nephrographic and pyelographic phases, respectively. In some institutions, an initial scan is also performed in the corticomedullary phase. In the corticomedullary phase, the contrast ma-terial is primarily in the cortical capillaries, peritubular spaces, and cortical tubular lamina and has not yet fil-tered through the more distal renal tubules (9). In the nephrographic phase, the contrast material filters through the glomeruli into the loops of Henle and collecting tu-bules (9). The renal parenchyma enhances homogenously during this phase, due to tubular accu-mulation. Renal tumors enhance less than the surround-ing parenchyma in this phase, because they lack nor-mal glomerular-tubular function and hence this phase is most valuable for detecting renal masses and char-acterizing indeterminate lesions (10). The contrast reaches the collecting system during the delayed or the excretory phase and, as a result, the attenuation of the
nephrogram progressively decreases (Figure-1C). Macari & Bosniak (11) have suggested that measure-ment of the washout of contrast material from a lesion at 15 minutes allows differentiation between hyperdense cysts and renal neoplasms. In their study, there was no changein the attenuation of high-density cysts between the initialcontrast-enhanced CT scan and the 15-minute-delayed images. In comparison, all lesions that proved to be neoplasms at surgeryor follow-up studies showed a decrease in attenuation or “de-enhancement” of at least 15 HU at delayed CT, which was attributed to the washout of contrast material from the vascular bed of the tumor (11).
Contiguous thin sections are obtained using protocols dependent on machine manufacturer to en-able overlapping reconstruction. At our institution, multiphase CT scans are obtained on GE Lightspeed VCT 64 slice scanner at 0.625 mm thickness at a pitch of 1.375:1. These slices are reconstructed at 2.5 mm thickness in the axial plane and coronal mats are obtained at 5 mm intervals. Sagittal refor-mats and 3D reconstruction are performed on a case specific basis. Cardiac gated studies are performed for patients with IVC extension (see Figure-4). Multi-phase CT of the abdomen is performed from top of the liver to 1 cm below the lowest kidney. A 15 minute scanogram is performed at the end of the exam to assess the ureters. The protocol used at our institu-tion is illustrated in Table-1.
With the rapid acquisition of multiple simulta-neous slices and thin-section reformatted coronal and/ or sagittal images, the 64-slice CT scanner provides excellent detail in demonstrating local extension to the bowel and retroperitoneum (see Figures-2, 3, 5, 6 and 7). Multiplanar three-dimensional reconstruction tech-niques including volume rendering, maximum inten-sity projection and shaded surfacedisplay provide com-prehensive information about the relationships and pos-sible involvement of vascular structures in renal neo-plasms.
TECHNICAL CONSIDERATIONS
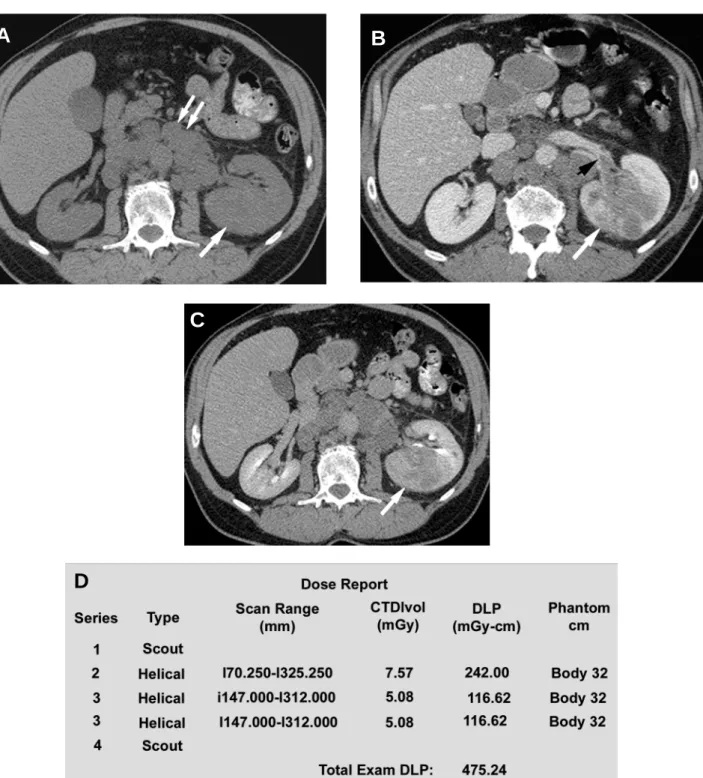
Figure 1 – Axial CT scan of the abdomen showing renal cell carcinoma. A) The tumor is involving the left kidney (arrow) with nodal
metastases in the retroperitoneum (double arrow). Note the noncontrast isodense appearance of the mass compared to the rest of the kidney. B) This image illustrates the enhancement in the mass on contrast administration where it increased in enhancement from 20 HU to 110 HU. Note the small thrombus in the proximal left renal vein (black arrowhead). C) Delayed image through the kidney showing the close proximity of the mass to the renal collecting system. D) A typical dose report generated automatically by the scanner for a patient. Dose given is calculated for each scan (noncontrast [series 2], nephrographic [series 3a] and delayed phase [series 3b] with the total dose of 475.24 mGy-cm for this patient).
A
B
C
Table 1 – Protocol used in our institution.
IV contrast 150 cc Optiray320, 3cc/sec
Precontrast Diaphragm to iliac crest
90 sec delay 1 cm above the top of the kidney to 1 cm below the lowest kidney 6 min delay 1 cm above the top of the kidney to 1 cm below the lowest kidney 15 min delay AP scout view from diaphragm to base of bladder
Pitch 1.375:1
Slice thickness 0.625 mm
kVp / helical rotation 120-140/ 0.4-0.8 sec
Recon 1 2.5 mm standard
Recon 2 Coronal 5 mm
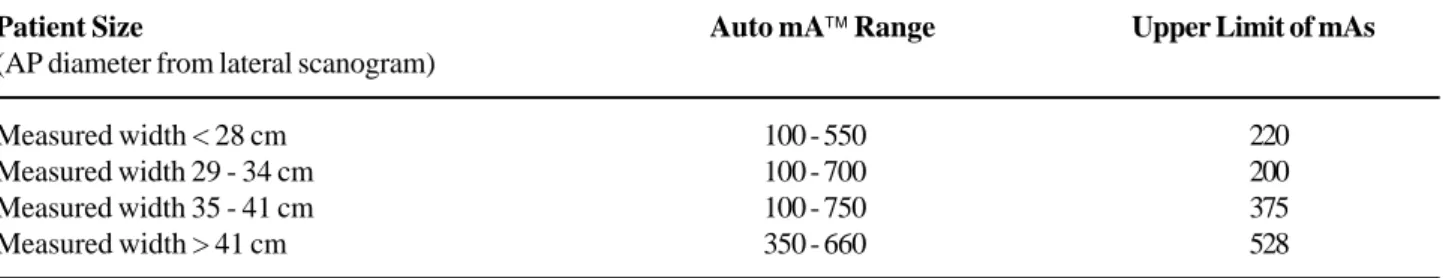
unnecessary and may, in fact, obscure intravascular contrast. The radiation dose in our CT scanners is regulated using the Smart mA feature, in which the mAs used is regulated according to the amount of tissue (bone/soft tissue) that has to be traversed in x, y and z axes. For example, the mAs used in the mid-abdomen is less than the mAs used in the pelvis due to the bony structures in the pelvis. The radiation dose given also depends on the patient’s size with more dose required for larger patients and less for smaller patients. This is regulated according to the body
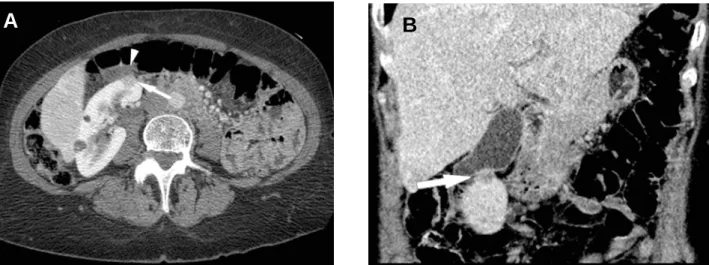
thick-Figure 2 – The axial sections in this case failed to show the gallbladder involvement as clearly as the sagittal reformatted image did. A)
Axial section through the abdomen showing the small renal cell carcinoma (white arrow) and the gallbladder adjacent to it (arrowhead). B) Coronal image showing involvement of the gallbladder seen as the loss of fat plane and thickening in the gallbladder wall (white arrow). The gallbladder had to be resected during surgery as it was adherent to the tumor and histopathology showed extension of the tumor into the gallbladder.
ness as illustrated in Table-2. Maximum mAs to be used can also be set in this Auto-mA feature. Fig-ure-1D illustrates the average dose generated during each scan and the total dose report.
IMAGING AND SURGICAL PLANNING
Surgical planning is usually enhanced by the information obtained from imaging studies: extent of the tumor and its location in the kidney; proximity to
Table 2 – The mAS is regulated according to the body thickness as per the table illustrated below.
Patient Size
(AP diameter from lateral scanogram)
Measured width < 28 cm Measured width 29 - 34 cm Measured width 35 - 41 cm Measured width > 41 cm
Auto mA Range
100 - 550 100 - 700 100 - 750 350 - 660
Upper Limit of mAs
220 200 375 528
Table 3 – Tumor.
Renal hilum
Close proximity to adjacent organs
Metastases
Size of mass
Location on kidney
Collateral vessels
Vessel anomalies, lymph nodes wrapped around vessels
Left side: pancreas, spleen, aorta/branches, iliacs, psoas, colon Right side: liver/gallbladder, IVC, colon, duodenum, iliacs
Liver, LN, adrenals, opposite kidney
Staging
Possible radiofrequency ablation (laparoscopic or percutaneous, partial nephrectomy
Upper, mid or lower
Anterior, posterior or lateral Involvement of collecting system
Possible radiofrequency ablation (laparoscopic or percutaneous, partial nephrectomy
Arteries, veins
Table 4 – Inferior vena cava (IVC).
Level of thrombus
Possible invasion of IVC wall
Distension of IVC
Invasion of IVC branches and extent.
Infrahepatic, intrahepatic, hepatic veins, IVC above diaphragm, atrium.
Obstruction, extent of bland thrombus above and below IVC tumor thrombus
the renal collecting system and renal vessels; presence of fat planes between the tumor and other structures (for e.g., liver, colon and posterior abdominal wall
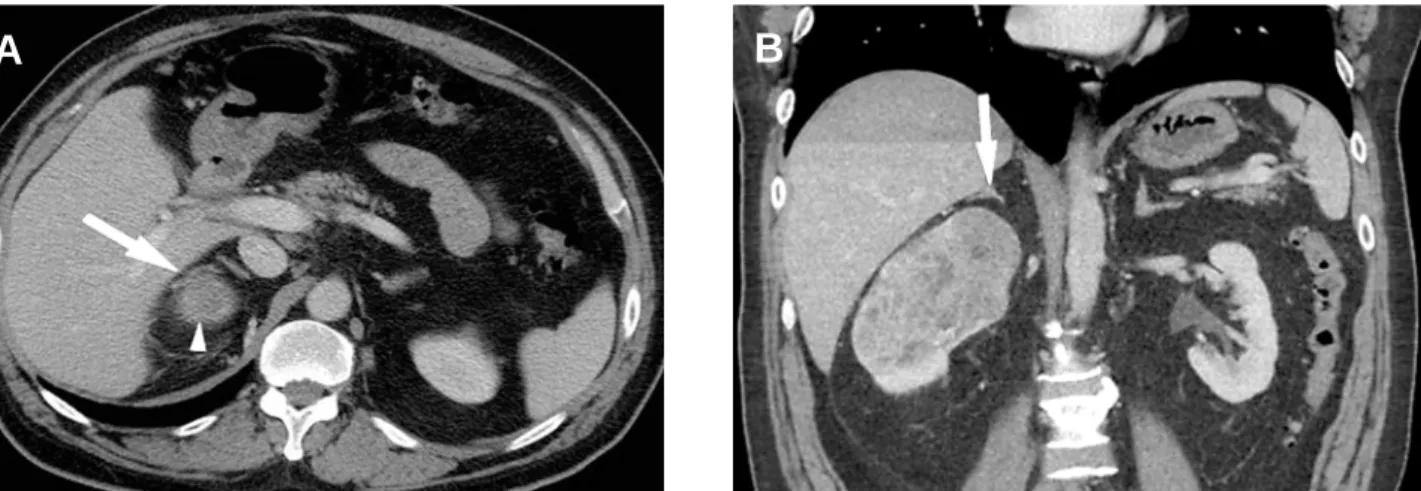
Figure 3 – Noninvolvement of the adrenal shown more clearly on the coronal reformat. A) Axial image through the superior portion of
the right kidney illustrating the tumor (arrowhead) in close proximity to the right adrenal gland (arrow). Fat plane between the tumor and the adrenal is not well seen. B) Note that the fat plane is much better seen on this coronal reformatted image confirming non-involvement of right adrenal gland.
Figure 4 – Tumor thrombus extent shown much better on cardiac-gated reformats. This study was performed by cardiac gating to assess
the extent of tumor extension into the inferior vena cava. A) Axial image - tumor is seen to extend into the right atrium and into the right ventricle as well (black arrows). B) Sagittal reformat - note peritoneal metastasis (white arrow) and extend into the right atrium and into the right ventricle well (black arrow).
contralateral kidney, and the appearance of the adrenal glands are also reliably assessed (12), Tables-3 and 4.
CONCLUSION
64 slice CT imaging provides an improvement in the preoperative analysis of renal masses. The
reformatted images in multiple planes and cardiac-gated sequences can offer additional help in surgical planning and reformatted images provide detailed information about arterial and venous collaterals and invasion of adjacent organs.
A
B
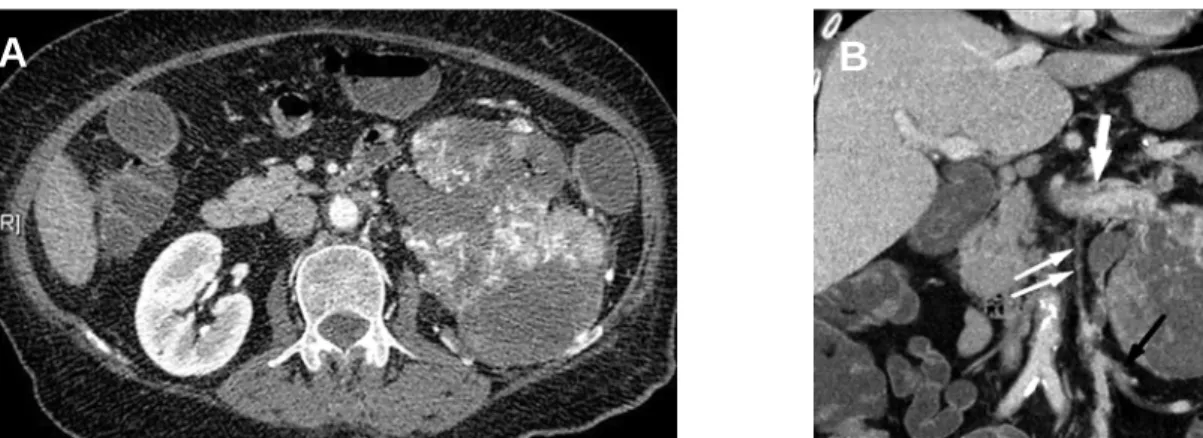
A
Figure 5 – Ovarian vein thrombosis seen much better on the coronal reformat. A) Axial section demonstrates the large mass in the left
kidney with multiple venous collaterals around it. B) Coronal reformatted image illustrates ovarian vein thrombosis (small double white arrows), which was missed on the axial section. Note the large thrombus in the left renal vein (large white arrow); the collaterals (black arrow) drain retrograde through the patent proximal ovarian vein.
Figure 6 – Relationship to the colon seen better on coronal reformat. A) Axial section through the left renal mass showing fat stranding
(white arrow) suggesting extension of the mass into the colon. B) Coronal reformatted image illustrating the extent of contact of the mass with the colon but not confirming invasion. The colon was not involved at surgery.
Figure 7– Postoperative CT showing scar tissue without recurrence of tumor. A) Axial section shows irregularly enhancing area in the
upper pole of the left kidney (white arrow). B) Coronal reformats through the same area showed this to be only scar tissue (white arrow).
A
A
A
B
B
CONFLICT OF INTEREST
None declared.
REFERENCES
1. Heidenreich A, Ravery V, European Society of Oncological Urology: Preoperative imaging in renal cell cancer. World J Urol. 2004; 22: 307-15.
2. Smith D: Renal Cancer. Urology. 2002; 20: 301-4. 3. Russo P: Renal cell carcinoma: presentation, staging,
and surgical treatment. Semin Oncol. 2000; 27: 160-76. 4. Cohan RH, Sherman LS, Korobkin M, Bass JC, Francis IR: Renal masses: assessment of corticomedullary-phase and nephrographic-corticomedullary-phase CT scans. Radiology. 1995; 196: 445-51.
5. Kopka L, Fischer U, Zoeller G, Schmidt C, Ringert RH, Grabbe E: Dual-phase helical CT of the kidney: value of the corticomedullary and nephrographic phase for evaluation of renal lesions and preoperative staging of renal cell carcinoma. AJR Am J Roentgenol. 1997; 169: 1573-8.
6. Szolar DH, Kammerhuber F, Altziebler S, Tillich M, Breinl E, Fotter R, et al.: Multiphasic helical CT of the kidney:
increased conspicuity for detection and characterization of small (< 3-cm) renal masses. Radiology. 1997; 202: 211-7.
7. Yuh BI, Cohan RH: Different phases of renal enhancement: role in detecting and characterizing renal masses during helical CT. AJR Am J Roentgenol. 1999; 173: 747-55.
8. Israel GM, Bosniak MA: How I do it: evaluating renal masses. Radiology. 2005; 236: 441-50.
9. Saunders HS, Dyer RB, Shifrin RY, Scharling ES, Bechtold RE, Zagoria RJ: The CT nephrogram: implications for evaluation of urinary tract disease. Radiographics. 1995; 15: 1069-85.
10. Birnbaum BA, Jacobs JE, Ramchandani P: Multiphasic renal CT: comparison of renal mass enhancement during the corticomedullary and nephrographic phases. Radiology. 1996; 200: 753-8.
11. Macari M, Bosniak MA: Delayed CT to evaluate renal masses incidentally discovered at contrast-enhanced CT: demonstration of vascularity with deenhancement. Radiology. 1999; 213: 674-80.
12. Kaplan S, Ekici S, Dogan R, Demircin M, Ozen H, Pasaoglu I: Surgical management of renal cell carcinoma with inferior vena cava tumor thrombus. Am J Surg. 2002; 183: 292-9.
Accepted: January 9, 2007
Correspondence address: Dr. Manjiri Dighe
Assistant Professor
Department of Radiology, Box 357115 University of Washington Medical Center, Seattle, WA, 98195, USA
Fax: + 1 206 598-0252