NHESSD
3, 6615–6649, 2015A spatial Bayesian network model to assess urban flood
risk to people
S. Balbi et al.
Title Page
Abstract Introduction
Conclusions References
Tables Figures
◭ ◮
◭ ◮
Back Close
Full Screen / Esc
Printer-friendly Version
Interactive Discussion
Discussion
P
a
per
|
Discussion
P
a
per
|
Discussion
P
a
per
|
Discussion
P
a
per
|
Nat. Hazards Earth Syst. Sci. Discuss., 3, 6615–6649, 2015 www.nat-hazards-earth-syst-sci-discuss.net/3/6615/2015/ doi:10.5194/nhessd-3-6615-2015
© Author(s) 2015. CC Attribution 3.0 License.
This discussion paper is/has been under review for the journal Natural Hazards and Earth System Sciences (NHESS). Please refer to the corresponding final paper in NHESS if available.
A spatial Bayesian network model to
assess the benefits of early warning for
urban flood risk to people
S. Balbi1,4, F. Villa1,4, V. Mojtahed2, K. T. Hegetschweiler3, and C. Giupponi2
1
BC3, Basque Centre for Climate Change, Bilbao, Spain
2
Ca’ Foscari University of Venice, Department of Economics and Venice Centre for Climate Studies, Venezia, Italy
3
Swiss Federal Institute for Forest, Snow and Landscape Research – WSL, Birmensdorf, Switzerland
4
IKERBASQUE, Basque Foundation for Science, Bilbao, Spain
Received: 18 September 2015 – Accepted: 7 October 2015 – Published: 29 October 2015 Correspondence to: S. Balbi ([email protected])
NHESSD
3, 6615–6649, 2015A spatial Bayesian network model to assess urban flood
risk to people
S. Balbi et al.
Title Page
Abstract Introduction
Conclusions References
Tables Figures
◭ ◮
◭ ◮
Back Close
Full Screen / Esc
Printer-friendly Version
Interactive Discussion
Discussion
P
a
per
|
Discussion
P
a
per
|
Discussion
P
a
per
|
Discussion
P
a
per
|
Abstract
This article presents a novel methodology to assess flood risk to people by integrat-ing people’s vulnerability and ability to cushion hazards through copintegrat-ing and adaptintegrat-ing. The proposed approach extends traditional risk assessments beyond material dam-ages; complements quantitative and semi-quantitative data with subjective and local
5
knowledge, improving the use of commonly available information; produces estimates of model uncertainty by providing probability distributions for all of its outputs. Flood risk to people is modeled using a spatially explicit Bayesian network model calibrated on expert opinion. Risk is assessed in terms of: (1) likelihood of non-fatal physical injury; (2) likelihood of post-traumatic stress disorder; (3) likelihood of death. The study area
10
covers the lower part of the Sihl valley (Switzerland) including the city of Zurich. The model is used to estimate the benefits of improving an existing Early Warning System, taking into account the reliability, lead-time and scope (i.e. coverage of people reached by the warning). Model results indicate that the potential benefits of an improved early warning in terms of avoided human impacts are particularly relevant in case of a major
15
flood event: about 75 % of fatalities, 25 % of injuries and 18 % of post-traumatic stress disorders could be avoided.
1 Introduction
Fluvial flooding is the most threatening natural hazard in Europe in terms of economic impact. For instance, between 2003 and 2009, 26 major events caused market-valued
20
damages amounting to about EUR 17 billion, with 320 human fatalities (EEA, 2010). Flood risk management is thus a priority for the European Union (e.g., EFAS-IS, 2015; European Commission, 2007), however the quantification of the benefits of flood risk prevention measures is an unresolved challenge in disaster research, mainly because the academic community hasn’t developed yet a shared standard to quantify flood risk.
25
NHESSD
3, 6615–6649, 2015A spatial Bayesian network model to assess urban flood
risk to people
S. Balbi et al.
Title Page
Abstract Introduction
Conclusions References
Tables Figures
◭ ◮
◭ ◮
Back Close
Full Screen / Esc
Printer-friendly Version
Interactive Discussion
Discussion
P
a
per
|
Discussion
P
a
per
|
Discussion
P
a
per
|
Discussion
P
a
per
|
(Gain et al., 2012). The most widely adopted framework in Disaster Risk Reduction (DRR) envisages the calculation of expected damages as a function of hazard, physi-cal vulnerability, and exposure (Crichton, 1999; UNDRO, 1980) According to the DRR framework, hazard is characterized by specific return periods – an estimate of the like-lihood of the event – and together with the vulnerability it is usually expressed as a
di-5
mensionless index, while the exposure is expressed with the unit(s) of measurement of the elements at risk, in physical or monetary terms. Although disasters can impact social-ecological systems in multiple ways, this approach has been mainly used to as-sess damages to built infrastructure.
Ideally, as pointed out by recent literature (Balbi et al., 2013; Meyer et al., 2013),
10
a comprehensive cost assessment should include the following cost elements:
1. damages to receptors that have a market value (direct tangible costs);
2. damages to people and the environment that have intrinsic value but no market value (direct intangible costs);
3. costs generated outside the time frame or the geographical location of the
haz-15
ardous event (indirect costs).
Even though a few attempts at holistic assessment exist (e.g., Jonkman et al., 2008; Gain et al., 2015), in practice only direct tangible costs are assessed most of the times (Balbi et al., 2013) because material damages are often considered sufficient to anal-yse and justify decisions regarding structural risk reduction measures (e.g., dikes,
em-20
bankments). Another difficulty with the traditional DRR framework is that it neglects the fact that the magnitude of the costs of disasters is influenced by the adaptive behavior of communities to absorb or cushion hazards (Rose, 2004). This is evident when con-sidering the human dimension of vulnerability (Cutter et al., 2003), which has been progressively recognized as one of the main components of risk (UNISDR, 2005).
25
NHESSD
3, 6615–6649, 2015A spatial Bayesian network model to assess urban flood
risk to people
S. Balbi et al.
Title Page
Abstract Introduction
Conclusions References
Tables Figures
◭ ◮
◭ ◮
Back Close
Full Screen / Esc
Printer-friendly Version
Interactive Discussion
Discussion
P
a
per
|
Discussion
P
a
per
|
Discussion
P
a
per
|
Discussion
P
a
per
|
dimension of vulnerability encompasses both the ability to cope with the hazard ex-post and the capacity to adapt to hazardous events ex-ante from a social perspective (Giupponi et al., 2014). During the 1990s, disaster management was primarily focused on the response of governments, communities, and international organizations to deal with the consequences of disasters after they occurred. More recently, emphasis has
5
shifted to the role of knowledge and preparedness (United Nation International Strat-egy for Disaster Reduction (UNISDR), 2010) and downplaying the human dimension of vulnerability is no longer acceptable. The reason for this shift is twofold: (a) natural hazard occurrence is subject to intrinsic uncertainty, which will be exacerbated by cli-mate change; and (b) the consequences of a natural hazard increasingly depend on
10
the behavior of the affected communities and their capacity to adapt.
The case of Early Warning Systems (EWSs) is iconic (Carsell et al., 2004; Nguyen et al., 2013; Daupras et al., 2015) as by anticipating the hazard they can reduce not only the amount of direct tangible costs – people can move transportable properties outside of the exposed area – but they can also: (i) save human lives (direct
intan-15
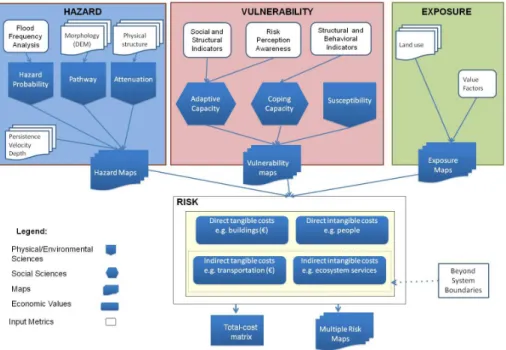
gible costs); (ii) change the behavior of people avoiding long-lasting trauma (indirect intangibles costs); (iii) prevent post-disaster evacuation costs (indirect tangible costs). This article adopts the KULTURisk methodological framework (Bullo, 2013; Giupponi et al., 2014) and presents a method to quantify the benefits of EWS. The KULTURisk framework (see Fig. 1) proposes two main innovations with regards to the state of the
20
art: (1) a non-monetary measure of risk that goes beyond direct tangible costs and (2) consideration of the individual and collective ability to reduce risk. The first is functional to the second, because the quantification of intangible and indirect costs is a prereq-uisite for assessing the benefits of both non-structural measures and preparedness. Until recently the KULTURisk framework has been mainly implemented by means of
25
NHESSD
3, 6615–6649, 2015A spatial Bayesian network model to assess urban flood
risk to people
S. Balbi et al.
Title Page
Abstract Introduction
Conclusions References
Tables Figures
◭ ◮
◭ ◮
Back Close
Full Screen / Esc
Printer-friendly Version
Interactive Discussion
Discussion
P
a
per
|
Discussion
P
a
per
|
Discussion
P
a
per
|
Discussion
P
a
per
|
variation: a probabilistic and spatially explicit model developed with Bayesian networks based on elicited expert knowledge. We argue that this novel methodological config-uration enables a more effective spatial flood risk management by differentiating risk estimates in each spatial unit of the landscape and keeping track of the associated un-certainty. We focus on flood risk to people because we assume that results can better
5
reflect the integration of people’s vulnerability and ability to cushion hazards by coping and adapting, and do not need a full monetization to be clearly understood. Moreover, among the possible impacts to individuals, life loss is evidently the most relevant due to its irreversibility.
In Sect. 2 we describe the case of the greater Zurich area and the simulation
sce-10
nario, the Bayesian modeling framework, and the expert knowledge elicitation process. In Sect. 3 we test the sensitivity of the vulnerability module of the framework and we describe the expected flood impacts and their local implications in a spatially explicit fashion. We conclude by highlighting the importance of EWSs in the new course of integrated flood risk management, discussing the advantages and limitations of the
15
proposed methodology and envisioning future research options.
2 Material and methods
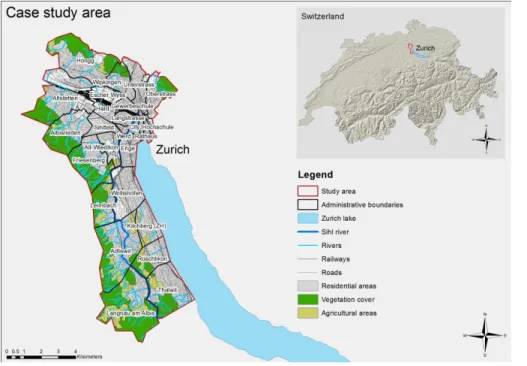
2.1 Case study
The case study area (see Fig. 2) is the lower part of the Sihl river valley in Switzerland. The Sihl River is a pre-alpine river with a catchment area of 336 km2 (Addor et al.,
20
2011; Buchecker et al., 2013). Since 1938, the river discharge of the Sihl has been influenced by the Sihl Lake, a reservoir used for hydro-power production located in the upper part of the river basin. The water used for energy production is not released back into the Sihl River, but diverged into the lake of Zurich. The Sihl river valley with its sub-catchments is particularly prone to flash floods triggered by summer thunderstorms.
25
NHESSD
3, 6615–6649, 2015A spatial Bayesian network model to assess urban flood
risk to people
S. Balbi et al.
Title Page
Abstract Introduction
Conclusions References
Tables Figures
◭ ◮
◭ ◮
Back Close
Full Screen / Esc
Printer-friendly Version
Interactive Discussion
Discussion
P
a
per
|
Discussion
P
a
per
|
Discussion
P
a
per
|
Discussion
P
a
per
|
into the river during the warmer months. Large parts of Zurich, Switzerland’s largest city, are positioned along the alluvial cone of the river itself. The river flows through the city and runs beneath the main railway station located in the city centre before joining the Limmat River (Addor et al., 2011; Buchecker et al., 2013). It has been estimated that in case of a 300 to 500 year flood event, direct tangible costs can amount up to
5
5 billion Swiss Francs (AWEL, 2013). In 2005, Zurich narrowly escaped a major flood when a thunderstorm moved away from Zurich towards central Switzerland. Our case study area covers an area of 78 km2 including part of the city of Zurich with 21 dis-tricts plus 5 municipalities (Adliswil, Kilchberg, Langnau am Albis, Rüschlikon, Thalwil). The residential areas cover 41.28 km2, with approximately 289 000 inhabitants. About
10
10 000 estate properties are located in hazard zones (Maidl and Buchecker, 2014). Since 2008 the EWS IFKIS Hydro Sihl (Intercantonal Early Warning and Crisis Infor-mation System) has been in place. The system uses meteorological inforInfor-mation, mea-sured data from gauging stations, e.g. precipitation intensity and discharge level, and event-related information provided by observers working in the field. Models forecast
15
the expected runoffand the information is uploaded to a visualization platform that can be accessed by all members responsible for taking decisions on flood risk control in the Sihl river basin (Romang et al., 2011). The function of the EWS is to provide decision support for local emergency response officers to consider increases in the retention capacity of the Sihl Lake. In case of an expected flood, water is preventively released
20
from the lake (drawdown) directly into the Sihl River without passing through the power plant. The release of water increases the buffering capacity of the lake, reducing the probability of flood for the city of Zurich, but at the same time causes a decrease in power production, making false alarms costly. Moreover, in order to be effective, the release of water needs to happen at least one day before a serious event (Addor et al.,
25
NHESSD
3, 6615–6649, 2015A spatial Bayesian network model to assess urban flood
risk to people
S. Balbi et al.
Title Page
Abstract Introduction
Conclusions References
Tables Figures
◭ ◮
◭ ◮
Back Close
Full Screen / Esc
Printer-friendly Version
Interactive Discussion
Discussion
P
a
per
|
Discussion
P
a
per
|
Discussion
P
a
per
|
Discussion
P
a
per
|
2.2 Methods
Despite the limitations described, the EWS is regarded as useful in significantly re-ducing flood risk, although its benefits have never been quantified. For the purpose of defining the EWS baseline, four experts from local authorities were surveyed about their perceived – thus subjective – performance of the EWS regarding its reliability (the
5
probability of a correct forecast), lead time (time in hours between the warning and the event occurrence) and scope (the coverage of people reached by the warning). This information was collected in the form of multiple choice questions and then translated in the baseline probabilities of Table 1 using the frequency of outputs from the respon-dents. In this article, we consider what the implications of an alternative scenario are
10
when the EWS is improved to a maximum theoretical effectiveness of its performances. The baseline and the alternative scenario are summarized in Table 1.
Building on the traditional DRR approach (UNDRO, 1980; Crichton, 1999), our framework postulates that the magnitude of flood risk is directly related to the inten-sity of the hazard as well as to the whole (i.e. physical and human) vulnerability of the
15
exposed system. Hazard, vulnerability, and exposure are integrated into a single func-tion of risk using Bayesian networks (BNs). Hazard and vulnerability interact to produce probabilities of harm to people. These probabilities are then multiplied by the number of exposed receptors, provided by the exposure scenarios, to compute the actual number of people affected, sorted into different categories.
20
A BN is a graphical representation of a joint probability distribution, which consists of a qualitative part, a directed acyclic graph representing conditional dependencies, and a quantitative one, a collection of numerical parameters representing conditional probability distributions. BNs constitute a widely accepted formalism for representing uncertain knowledge (subjective or objective) and for efficiently reasoning with it (Pearl
25
distribu-NHESSD
3, 6615–6649, 2015A spatial Bayesian network model to assess urban flood
risk to people
S. Balbi et al.
Title Page
Abstract Introduction
Conclusions References
Tables Figures
◭ ◮
◭ ◮
Back Close
Full Screen / Esc
Printer-friendly Version
Interactive Discussion
Discussion
P
a
per
|
Discussion
P
a
per
|
Discussion
P
a
per
|
Discussion
P
a
per
|
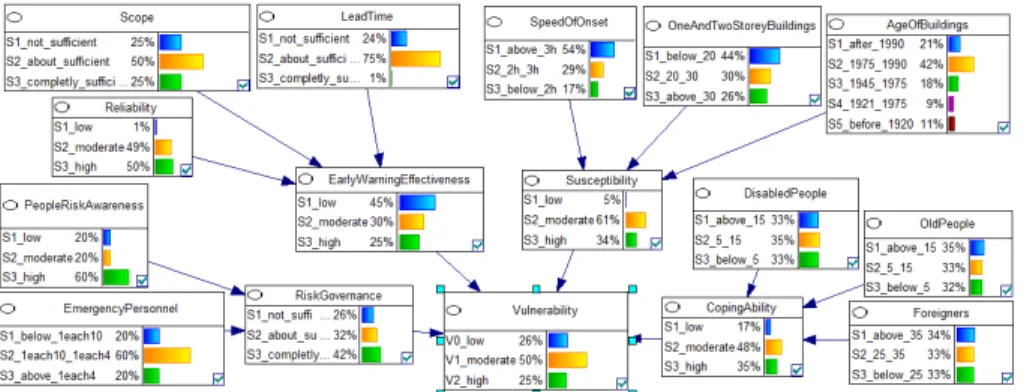
tion over a finite number of states or events. For input nodes (nodes without parents) this probability is termed the prior probability and for child nodes it is termed the condi-tional probability (i.e., the probability of its value condicondi-tional on a set of outcomes for its input nodes). The dispersion in the probability distribution of the output node (e.g. vul-nerability in Fig. 3) can be considered as a proxy for model output uncertainty. BNs can
5
be constructed through expert opinion or by learning the conditional probability distri-butions from the data. There has been many studies in the past years on the automatic learning, so called training (Buntine, 1996), of Bayesian networks from the data (e.g., Vogel et al., 2012) and, consequently, many learning algorithms have been developed, based on different methodologies (de Campos and Castellano, 2007). In this study we
10
employ a mixed approach whereby opinions expressed by flood experts are used to create an extended dataset to train the BNs.
BNs have been applied to research problems across many disciplines, including natural resource management (McCann et al., 2006). In particular, BNs have found increasing application to environmental management under uncertainty, including
inte-15
grated water management issues (e.g., Barton et al., 2008). Examples are also avail-able in the domain of natural hazard management (Vogel et al., 2014). Amendola et al. (2000) use BNs to consider the chain of indirect damages caused by natural haz-ards. Antonucci et al. (2004) assess debris flow hazards using credal networks. Straub (2005) illustrates the potential of BNs for rock-fall hazard ratings. Vogel et al. (2012)
es-20
timate the flood damage to residential buildings using BNs trained on real world data, including usually neglected characteristics of the flooded objects and the results out-perform the traditional stage-damage-function approach (Elmer et al., 2010) and keep track of uncertainty. Spatial Bayesian assessments are gaining attention from the scien-tific community in different disciplines, especially in epidemiology and human
geogra-25
NHESSD
3, 6615–6649, 2015A spatial Bayesian network model to assess urban flood
risk to people
S. Balbi et al.
Title Page
Abstract Introduction
Conclusions References
Tables Figures
◭ ◮
◭ ◮
Back Close
Full Screen / Esc
Printer-friendly Version
Interactive Discussion
Discussion
P
a
per
|
Discussion
P
a
per
|
Discussion
P
a
per
|
Discussion
P
a
per
|
with missing data, and to account for and help communicating uncertainties in different part of the assessments. In the case of flood risk it is common to have background knowledge about expected impacts, among which some are subjective (from experts’ assessment) and some objective (from previous events). Experts possess prior infor-mation about the prevalence of possible conditions of hazard and vulnerability from
5
previous events.
2.3 Data and model components
Hazard is commonly represented by maps of intensity of flood, provided by hydro-logical analysis and modeling, with reference to different return periods. For this study we used 3 hazard maps provided by the GIS Centre of Canton Zurich describing the
10
flood extension of a 300 years event in terms of flood inundation depth (D), velocity of flooded water (V), and debris factor (DF). This can be considered as a worst-case scenario for the study area. The hazard Bayesian module is developed mirroring the hazard rate (HR) function of DEFRA (2006), whereby:
HR=D×(V +β)+DF (1)
15
In our case we matched the combination of the discretized inputs to three levels of hazard: low hazard for HR lower than 1, moderate hazard for HR between 1 and 3, and high hazard for HR above 3, usingβequal to 0.5.Dis discretized into 4 states: 0 to 50, 50 to 100, 100 to 150 cm, and above 150 cm.V is discretized into 3 states: lower than 2 m s−1, between 2 and 4 m s−1, and above 4 m s−1. DF is a binary variable, where zero
20
means absence and 1 means presence of debris factor. The mentioned discretizations are consistent with the classes derived from deterministic functions proposed by Ronco et al. (2015).
Vulnerability maps result from the combination of both physical and social compo-nents. Input variables for the vulnerability model were broken down into 4 main groups
25
dis-NHESSD
3, 6615–6649, 2015A spatial Bayesian network model to assess urban flood
risk to people
S. Balbi et al.
Title Page
Abstract Introduction
Conclusions References
Tables Figures
◭ ◮
◭ ◮
Back Close
Full Screen / Esc
Printer-friendly Version
Interactive Discussion
Discussion
P
a
per
|
Discussion
P
a
per
|
Discussion
P
a
per
|
Discussion
P
a
per
|
abled people, and non-native speakers (e.g. newcomers, foreigners). The mentioned data are provided by the Statistical Offices of Canton Zurich and the City of Zurich. Susceptibility is a function of age of the exposed buildings (source: GIS Centre Canton Zurich), percentage of single and two storey buildings (source: local statistical offices), and speed of onset – the time that flood wave peak takes to reach the building, which
5
is location dependent and derived from averages provided by the four EWS local ex-perts for selected points within the case study area. Risk governance is articulated into societal risk awareness (derived from Maidl and Buchecker, 2014 – a survey of property owners) and per capita number of emergency personnel (F. B. Hegi, Protec-tion and Rescue Zurich, 2013, personal communicaProtec-tion). Early warning effectiveness
10
is modeled as described in the previous section (See Table 1).
Exposure is the presence of people and assets in the modeled landscape. In this application we employ two scenarios: (1) we use the average residential population density per district to represent human targets in the event of an overnight flood; (2) we use data about hourly presence of people in selected public buildings of relevance
15
(schools, stations, shopping centres, etc.) during a working day to represent human targets in the event of a working hours flood hit. The advantage of this approach is that it offers a realistic assessment in areas with a low residential population density but high presence of people during the day, e.g. in shopping areas.
2.4 Elicited expert knowledge
20
Expert knowledge has been used in three different phases of the model development:
1. a team of experts belonging to the KULTURisk Project have built and internally peer reviewed the vulnerability module (see the next section);
2. four local professionals, selected by the Swiss Federal Institute for Forest, Snow and Landscape Research (WSL) among those dealing with the EWS IFKIS Hydro
25
NHESSD
3, 6615–6649, 2015A spatial Bayesian network model to assess urban flood
risk to people
S. Balbi et al.
Title Page
Abstract Introduction
Conclusions References
Tables Figures
◭ ◮
◭ ◮
Back Close
Full Screen / Esc
Printer-friendly Version
Interactive Discussion
Discussion
P
a
per
|
Discussion
P
a
per
|
Discussion
P
a
per
|
Discussion
P
a
per
|
3. 25 international flood experts, selected among authors’ contacts from own institu-tions and from sector specific scientific conferences related to the topic (e.g. EGU Leonardo 2012: Mojtahed et al., 2012, EGU General Assembly 2013: Giupponi et al., 2013), were interviewed to extrapolate experts’ estimates on risk output that were used to train the integrated risk Bayesian model.
5
In the following, we discuss the latter phase. The panel of experts was consulted through a questionnaires (provided as Supplement) in order to deduce their opinions about expected consequences of given conditions of hazard and vulnerability within the case study. Among these experts, 20 had more than 5 years’ experience on floods, 15 had been consulted by public bodies on flood risk, and 10 had direct knowledge about
10
the case study. Experts were asked to rank the likely effect on a hypothetical individual for different scenarios of hazard and vulnerability using a numeric score between 0 and 100. Both hazard and vulnerability were described as discrete states (high, moderate or low) using a narrative format. For example, moderate hazard was described through the phrase “the flood depth is marginal (e.g.<0.5 m), but the water velocity is
signifi-15
cant for an average person (e.g.>2 m s−1) and there is some debris factor”; moderate vulnerability was described as “It’s a residential area of individual houses with base-ment, where many retired people reside. There have been flash floods before but the EWS is not at the technological level to deal with those. However, the civil protection agency is physically located within the area”.
20
Experts provided responses about the likelihood of: (1) non-fatal physical injury; (2) post-traumatic stress disorder (PTSD); and (3) death. In the questionnaire, experts were also asked to define the effect of exposure on risk. Although some experts recog-nized the existence of a non-linear relation, preliminary results were produced under the assumption that risk increases linearly with exposure.
25
NHESSD
3, 6615–6649, 2015A spatial Bayesian network model to assess urban flood
risk to people
S. Balbi et al.
Title Page
Abstract Introduction
Conclusions References
Tables Figures
◭ ◮
◭ ◮
Back Close
Full Screen / Esc
Printer-friendly Version
Interactive Discussion
Discussion
P
a
per
|
Discussion
P
a
per
|
Discussion
P
a
per
|
Discussion
P
a
per
|
the use of the PC learning algorithm, a well-established constraint learning algorithm named after its authors, Spirtes et al. (2000). Learning produced a trained overall BN where the hazard and vulnerability modules interact to produce the 3 types of output. We ran this BN in each cell of a rasterized landscape, delivering probability distributions for spatially varying hazard and vulnerability factors. We finally multiplied these factors
5
by the number of exposed receptors provided by the exposure scenarios, computing distributions for the actual number of people affected.
Geographical information systems and BN models are fully coupled in the simu-lations used for this study. The spatial context for the study is a rasterized landscape where both deterministic and probabilistic models run in each grid cell. For this
applica-10
tion we used the GeNIe software (https://dslpitt.org/genie/) to develop the BN modules, which were integrated and spatialized by the modeling infrastructure (See Villa et al., 2014) that directly supports GeNIe’s native format.
3 Results and discussion
3.1 Analysis of the vulnerability module
15
The Bayesian vulnerability module was developed and tested by the authors and ex-perts participating to the KULTURisk consortium. The foundations of the conceptual model were established during the development of the KULTURisk framework (Moj-tahed et al., 2012; Balbi et al., 2012; Giupponi et al., 2013) and are thoroughly doc-umented in Giupponi et al. (2014). The number of factors potentially influencing
vul-20
nerability is large, and their single and joint effects are largely unknown. A minimal set of factors should include both physical and social variables (e.g., Cutter et al., 2003; Thieken et al., 2005; Adger and Vincent, 2005; Kuhlicke et al., 2011). The main chal-lenges in assessing flood vulnerability are related to (a) tailoring the set of indicators to the context and scale, and (b) aggregating and weighting indicators (or estimating the
25
NHESSD
3, 6615–6649, 2015A spatial Bayesian network model to assess urban flood
risk to people
S. Balbi et al.
Title Page
Abstract Introduction
Conclusions References
Tables Figures
◭ ◮
◭ ◮
Back Close
Full Screen / Esc
Printer-friendly Version
Interactive Discussion
Discussion
P
a
per
|
Discussion
P
a
per
|
Discussion
P
a
per
|
Discussion
P
a
per
|
Regarding the selection of indicators, social scientists argue that vulnerability factors should be investigated in each case study by interacting with local stakeholders, mainly using semi-quantitative research approaches (e.g., Steinführer et al., 2008). We took a slightly different approach, which avoids deep stakeholder participation, by making use of local knowledge from the experts involved in this study. The selection of the
5
vulnerability indicators was tailored to the application context taking into account haz-ard type, spatial scale and data availability. Where the data were not spatially explicit, the available information was used to build prior probabilities for the input nodes (see Sect. 2.2). All the data were discretized for use in BNs; discretization breaks of numeric variables are either suggested by experts (e.g. speed of onset) or, lacking hypotheses
10
on which to base discretization, uniformly distributed (e.g. age of building). Further analysis could focus on the effect of discretization (Uusitalo, 2007).
Regarding the aggregation of indicators, Giupponi et al. (2014) suggest to employ a socially weighted multi-criteria method, which also implies relevant stakeholders’ in-volvement. Coherently with the previous step, we instead opted for an expert-informed
15
Bayesian approach, whereby preference weights are implicitly captured by the network causal structure and by the conditional probability distribution validated by the experts. Following the guidelines of Marcot et al. (2006), who detail robust strategies to de-velop and update BNs for environmental management purposes, we represent each node of the vulnerability BN module through discrete states and then identify the
sin-20
gle most likely outcome for each combination of parent node states, effectively forcing one outcome state for each input combination. In this development phase, we tried to approximate equal weights for each input node on the intermediate nodes, while among the intermediate nodes the effect of early warning effectiveness is doubled with respect to the others (i.e. 40 vs. 20 %). Then probabilities were adjusted to represent
25
reasonable probability distribution. In the development of the first-cut model (named alpha-level in Marcot et al., 2006) we also respected the following principles in order to keep its complexity under control:
NHESSD
3, 6615–6649, 2015A spatial Bayesian network model to assess urban flood
risk to people
S. Balbi et al.
Title Page
Abstract Introduction
Conclusions References
Tables Figures
◭ ◮
◭ ◮
Back Close
Full Screen / Esc
Printer-friendly Version
Interactive Discussion
Discussion
P
a
per
|
Discussion
P
a
per
|
Discussion
P
a
per
|
Discussion
P
a
per
|
2. Input nodes are based on existing data (mainly spatially explicit data).
3. Intermediate nodes are used to summarize the major themes (e.g. early warning effectiveness summarizes the three dimensions of EWSs).
The result of the selection and aggregation of indicators as described above is the vulnerability module represented in Fig. 3, which exhibits four main components
(in-5
termediate nodes) whereby early warning effectiveness and susceptibility include in-fluencing factors (input nodes) typically displayed in studies of flood damages to resi-dential buildings (Thieken et al., 2005; Vogel et al., 2012), while coping ability and risk governance include typical factors of social vulnerability literature (Cutter et al., 2003; Adger and Vincent, 2005).
10
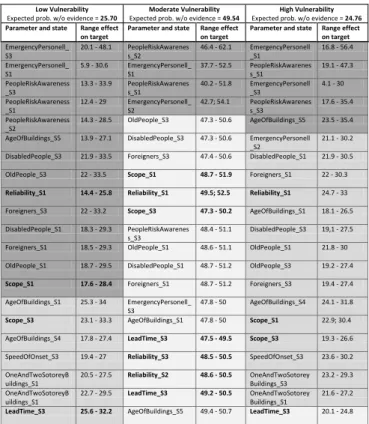
Sensitivity analysis shows that the results are mostly sensitive to input parameters related to risk governance. This information is detailed in Table 2, where the sensitivity of each output is broken down for every possible interval of outcome (i.e. low, moderate and high vulnerability). In this analysis we consider only the effects of individual input nodes and not their combinations. A conditional confidence analysis (Frey and Patil,
15
2002) is performed, taking each state of input nodes individually. For every state of the output node (i.e. vulnerability) the range of variation of the marginal probability is computed over all the possible states of the input nodes.
In Table 2, sensitive input parameters are mostly related to the emergency personnel and to the risk awareness factors. Low vulnerability is the most sensitive output state
20
with 13 input parameter states that can induce a change in the output state probabil-ity of above 10 %. Among these the maximum variation (28 %) can be produced by a thorough presence of emergency personnel, which in turn increases the probability of low vulnerability. More specifically, the range effect on the target (low vulnerability) spans from 20.1 to 48.1 %, against a posterior probability of 25.7 %, and is produced
25
with a full variation of the parameter probability, from 0 to 100 %.
NHESSD
3, 6615–6649, 2015A spatial Bayesian network model to assess urban flood
risk to people
S. Balbi et al.
Title Page
Abstract Introduction
Conclusions References
Tables Figures
◭ ◮
◭ ◮
Back Close
Full Screen / Esc
Printer-friendly Version
Interactive Discussion
Discussion
P
a
per
|
Discussion
P
a
per
|
Discussion
P
a
per
|
Discussion
P
a
per
|
the sensitivity of the vulnerability module is acceptable given the ranges of input change imposed. Moreover, early warning parameters do not appear to be very sensitive; for example, low EWS reliability and limited EWS scope can affect the expected probability of low vulnerability up to 10–12 %. This is relevant in view of the discussion of results proposed in the next section.
5
3.2 Simulated spatial results
Simulated results can be presented as a comparative analysis of the baseline (i.e. presence of the current EWS) with the alternative scenario representing the improve-ment of the EWS to a maximum theoretical effectiveness. The latter assumes that its reliability, scope and lead time are completely effective based on the perception
10
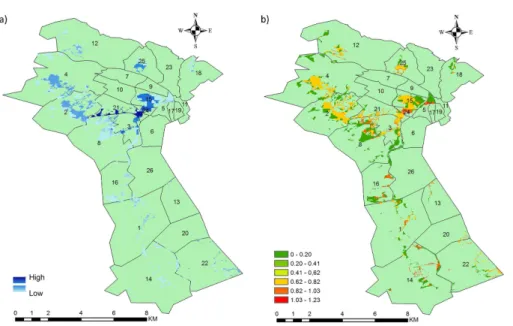
of experts (see Table 1). This method allows the quantification of the benefits of the EWS in terms of avoided injuries, PTSDs and fatalities. The summary of results, ag-gregated per district and municipality, is presented for the two exposure scenarios in Table 3 (day flood) and Table 4 (overnight flood). These data have been derived from the model output originally produced as GIS raster maps with a resolution of 50 m. We
15
only present a representative set of these maps (Fig. 4). For each cell in which the BN is applied the output is expressed as a probability distribution. To represent uncertainty we produced maps of the coefficient of variation (CV) calculated from the distributions along with maps of the mean values in each cell. For example, Figure 4b describes the uncertainty of the number of injured people due to an overnight flood. An average
20
uncertainty (CV around 0.5) is shown for the cells with highest expected impact, higher uncertainty is shown in some cells with low expected impact (e.g. the City), but also in some cases of expected medium-high impact (e.g. the Werd district) as discussed in the following paragraphs. Uncertainty captures where the quality of input data could improve to produce more precise risk estimation with our model.
25
NHESSD
3, 6615–6649, 2015A spatial Bayesian network model to assess urban flood
risk to people
S. Balbi et al.
Title Page
Abstract Introduction
Conclusions References
Tables Figures
◭ ◮
◭ ◮
Back Close
Full Screen / Esc
Printer-friendly Version
Interactive Discussion
Discussion
P
a
per
|
Discussion
P
a
per
|
Discussion
P
a
per
|
Discussion
P
a
per
|
injuries and PTSD is lower, around 20 %. The difference in absolute numbers and spatial distributions between day and night scenarios depends on different exposure data. For example, while the City district could be at high risk in case of day flood, it could be among the safest if the flood happens during the night. Alt-Wiedikon and Langstrasse appear to be at risk in both cases, while and Albisrieden, Altstetten and
5
Sihlfeld are mainly at risk during an overnight flood. Thalwil and Adliswil are at risk dur-ing an overnight flood, but they are not covered by exposure data for the day scenario. Enge, Hard, Hochschule, Kilchberg, Langnau am Albis, Oberstrass, Rathaus, Rüsch-likon and Unterstrass are also not covered by day exposure data. Note that the effect of the EWS improvement is different in every cell, and thus in every district/municipality,
10
according to the different contribution to the reduction of vulnerability that it can achieve depending on the conditions of the other factors of vulnerability. For example vulner-ability may remain high even with a very effective EWS because susceptibility is high (due to the speed of onset) and coping capacity is particularly low (due to the presence of vulnerable human receptors). However, in this application we don’t explore how early
15
warning effectiveness could be conditional on the timing (day vs. night) of the event. The simulation results lead to distinguish three main types of districts that could be affected by a flood event: (1) the inner city of Zurich, (2) Zurich’s nightlife district, and (3) the densely populated residential areas which cover most of the case study area including the five municipalities in the Sihl valley. The city district is especially at risk
20
during a day flood. This district is characterised by numerous commercial activities such as shops, restaurants and other businesses and includes Zurich’s main railway station. It thus encapsulates the busiest areas in Zurich, although the actual number of inhabitants is relatively low. Zurich’s main station is not only a central hub for na-tional and internana-tional rail transportation, but also includes an underground shopping
25
peo-NHESSD
3, 6615–6649, 2015A spatial Bayesian network model to assess urban flood
risk to people
S. Balbi et al.
Title Page
Abstract Introduction
Conclusions References
Tables Figures
◭ ◮
◭ ◮
Back Close
Full Screen / Esc
Printer-friendly Version
Interactive Discussion
Discussion
P
a
per
|
Discussion
P
a
per
|
Discussion
P
a
per
|
Discussion
P
a
per
|
ple pass through the station every day. As the Sihl River flows directly underneath the station, a flood could trap a lot of people underground. Early evacuation of the railway station is a key task to avoid major human costs in case of day flood. In contrast to the city district, the Langstrasse district is at risk both in case of day and overnight flood. Langstrasse is a district with very mixed functions. On the one hand, it is a very
5
popular nightlife district with plenty of restaurants, bars, pubs, discos, etc. On the other hand, it is a multicultural residential area with more than 10 000 inhabitants. Rent in Langstrasse is comparatively cheap, attracting people with low incomes. The percent-age of residents depending on social welfare (14 % in 2006) is the highest in Zurich. There is a high percentage of foreigners among the residents (up to 50 % in certain
10
streets), many of them with limited knowledge of German (Craviolini et al., 2008). These factors contribute to the vulnerability of the district to unusual events such as flooding. Traditionally, residents are warned by a general sound alarm and via radio about an impending flood, but especially in the Langstrasse district it might be difficult to reach everybody in this way. Jointly with Albisrieden, Altstetten, situated along the
15
river Limmat downstream to where the Sihl joins the Limmat, is one of the residential districts most at risk in case of an overnight flood, due to a relatively high population density. Measures to reduce flooding along the Limmat were implemented in 2013. A 1.8 km long section of the Limmat has been restored and expanded up to 8 m, giving the river more space in case of flood events. At the same time, new dams have been
20
constructed to protect critical areas (Building Department Canton Zurich, 2013). In this particular case our simulation suggests that an efficient EWS could prevent most of the fatalities in case of a major overnight flood.
4 Discussion and conclusions
Flood risk has been traditionally measured through the expected monetary damage to
25
NHESSD
3, 6615–6649, 2015A spatial Bayesian network model to assess urban flood
risk to people
S. Balbi et al.
Title Page
Abstract Introduction
Conclusions References
Tables Figures
◭ ◮
◭ ◮
Back Close
Full Screen / Esc
Printer-friendly Version
Interactive Discussion
Discussion
P
a
per
|
Discussion
P
a
per
|
Discussion
P
a
per
|
Discussion
P
a
per
|
like dams and levees, leaving aside the influence of people’s behavior in dealing with floods. Conversely, regardless of structural protections, increased exposure by means of occupation of land by human settlements has been in fact the main driver of in-creased flood risk in the last years (United Nation International Strategy for Disaster Reduction (UNISDR), 2010). The evolution of land encroachment, together with the
5
vulnerability of exposed settlements and the increasing frequency of extreme events due to climate change, is calling for a new course in integrated flood risk management. Non-structural measures (e.g. relocation and detention basins) and preparedness (e.g. EWSs and rising risk awareness) are gaining ground in the governance of risk pre-vention and reduction, as words like “adaptation” and “coping ability” become of
com-10
mon use in the policy-making arena. In particular, EWSs are recognized as an efficient risk reduction option in flood prone areas, as flood forecasting undergoes technological innovation in terms of reliability and lead time (see Pappenberger et al., 2015). How-ever, there are still few studies about the quantification of the benefits of EWSs. In this article we demonstrate a novel approach based on the KULTURisk framework (Balbi
15
et al., 2012; Giupponi et al., 2014), which attempts to fill this research gap for what con-cerns the potential avoided consequences to human targets. In general, the benefits of a risk prevention measure are the difference between potential consequences de-termined under the baseline scenario and the potential consequences under an alter-native scenario where new or improved risk prevention measures are put in place. We
20
simulate a scenario analysis focused on the potential benefits of EWS improvement. This simulation suggests that the potential benefits of a fully efficient EWS in terms of avoided human impacts are particularly relevant in case of a major flood event: the EWS can avoid about 75 % of fatalities, 25 % of injuries and 18 % of post-traumatic stress disorders.
25
Al-NHESSD
3, 6615–6649, 2015A spatial Bayesian network model to assess urban flood
risk to people
S. Balbi et al.
Title Page
Abstract Introduction
Conclusions References
Tables Figures
◭ ◮
◭ ◮
Back Close
Full Screen / Esc
Printer-friendly Version
Interactive Discussion
Discussion
P
a
per
|
Discussion
P
a
per
|
Discussion
P
a
per
|
Discussion
P
a
per
|
though the delivered results appear reasonable, and are backed up by parallel studies as we discuss in the next paragraph, more research is required for robust policy recom-mendations. For example, the vulnerability model has been peer reviewed by domain experts in order to produce the final version implemented in this study. However, fur-ther strategies like data learning (where data is available) or deep stakeholder inclusion
5
(where resources are available) could be put in place for consolidating this part of the methodology. For this article we simply acknowledged these limitations and discussed a sensitivity analysis to complement the results of the vulnerability module.
The results reinforce that, from a methodological point of view, it is possible to em-ploy quantitative data (flood modeling and GIS data), and semi-quantitative information
10
integrating subjective (expert opinion) and local knowledge (risk perception and EWS baseline), to produce estimates in line with more established (and deterministic) ap-proaches. In particular, the application of BNs allows us to produce probabilistic results and include an explicit visualization of model uncertainty. Moreover, the incorporation of early warning scenarios allows the assessment of the potential benefits of the EWS.
15
As a mean of preliminary cross-validation, we can anticipate that the results for the baseline overnight flood scenario, for what concerns injuries and fatalities, are dimen-sionally and spatially consistent with the equivalent GIS analysis carried out during the KULTURisk project with a deterministic model and no expert involvement (Bullo, 2013; Olschewski, 2013). The probabilistic and expert-informed results match the results of
20
the deterministic application, although they reflect a more pessimistic outlook on in-juries (1300 vs. 1000 people affected) and appear slightly more conservative about fatalities (18 vs. 29 deaths). Compared to the mentioned deterministic application the main advantage of using a probabilistic methodology like BNs is the possibility of using the information on uncertainty, deriving from both model structure and data, as showed
25
NHESSD
3, 6615–6649, 2015A spatial Bayesian network model to assess urban flood
risk to people
S. Balbi et al.
Title Page
Abstract Introduction
Conclusions References
Tables Figures
◭ ◮
◭ ◮
Back Close
Full Screen / Esc
Printer-friendly Version
Interactive Discussion
Discussion
P
a
per
|
Discussion
P
a
per
|
Discussion
P
a
per
|
Discussion
P
a
per
|
case of EWS. By altering baseline conditions of key variables related to early warning effectiveness, we are able to simulate ex-ante the benefits of improving the business as usual conditions. The quantification of the required investments are beyond the scope of this paper although a local planner could get an idea of the hotspots where to inter-vene both in terms of expected impacts and uncertainty level. For example a decision
5
to be taken in an area where high uncertainty should drive research to improve the quality of the data that feed into the model or the model itself if the goodness of data is considered to be satisfactory. Finally, with respect to the original application of the KULTURisk methodology, our model also considers an alternative scenario of EWS improvement both for overnight and day flood.
10
This work could be further expanded in two main ways. The simplest one is the com-parison of the costs and the benefits of the EWS. This comcom-parison requires the estima-tion of investments and running costs related to a fully efficient EWS, as envisioned in our scenario, including the state of the art forecasting models, real time weather data assimilation, full population warning coverage, personnel requirements for operation
15
and maintenance, etc. Such a development would in turn lead to the monetization of the benefits, differently from what we presented in the results section. Under a more traditional economic perspective, it is possible to envisage ways to estimate monetary values by applying the method of disability-adjusted life years (DALY) (Murray et al., 2013) to injuries and post-traumatic stress disorder results and to assess the loss of
20
lives using the value of statistical life (VSL) method (Jonkman et al., 2003). While DALY quantifies the burden of being in states of poor health or disability (including the impli-cations of age on productivity) in terms of forgone good years of expected life, VSL captures the value that an individual places on a marginal change in their likelihood of death. Bearing in mind the widespread criticism around these two methods (mainly for
25
NHESSD
3, 6615–6649, 2015A spatial Bayesian network model to assess urban flood
risk to people
S. Balbi et al.
Title Page
Abstract Introduction
Conclusions References
Tables Figures
◭ ◮
◭ ◮
Back Close
Full Screen / Esc
Printer-friendly Version
Interactive Discussion
Discussion
P
a
per
|
Discussion
P
a
per
|
Discussion
P
a
per
|
Discussion
P
a
per
|
a flood module, which would be able to simulate different hazards linked to a weather generator module. This would sustain the ability to test different climate change sce-narios. Further technological developments are focusing on the automated generation of questionnaires from the BN structure and the use of e-participation methodologies (Bojovic et al., 2015) to extract BNs training data.
5
The Supplement related to this article is available online at doi:10.5194/nhessd-3-6615-2015-supplement.
Acknowledgements. This research was partially funded by the KULTURrisk (Knowledge-based approach to develop a cULTURE of Risk prevention) project. FP7-ENV-2010|Project 265280 (www.kulturisk.eu). The authors want to thank the 25 flood risk experts and the four EWS
ex-10
perts interviewed. We express our gratitude to Roland Olschewski and Matthias Buchecker (Swiss Federal Institute for Forest, Snow and Landscape Research – WSL) and Martina Bullo (Department of Environmental Sciences, Informatics and Statistics, Ca’ Foscari University of Venice), for the insights provided by their work. Special thanks to Animesh Gain and Claudio Biscaro (Department of Economics, Ca’ Foscari University of Venice) for the review of the
vul-15
nerability module. We also want to acknowledge Valentina Gallina, Silvia Torresan, Elena Se-menzin and Alex Zabeo (Department of Environmental Sciences, Informatics and Statistics, Ca’ Foscari University of Venice) for the contribution in the development of the KULTURisk Frame-work. The technology used to integrate BNs with GIS is k.LAB, a semantic meta-modelling platform developed by co-author Villa (Villa et al., 2014). The GIS results have been elaborated
20
with the QGIS open source application (www.qgis.org).
References
Addor, N., Jaun, S., Fundel, F., and Zappa, M.: An operational hydrological ensemble prediction system for the city of Zurich (Switzerland): skill, case studies and scenarios, Hydrol. Earth Syst. Sci., 15, 2327–2347, doi:10.5194/hess-15-2327-2011, 2011. 6619, 6620
NHESSD
3, 6615–6649, 2015A spatial Bayesian network model to assess urban flood
risk to people
S. Balbi et al.
Title Page
Abstract Introduction
Conclusions References
Tables Figures
◭ ◮
◭ ◮
Back Close
Full Screen / Esc
Printer-friendly Version
Interactive Discussion
Discussion
P
a
per
|
Discussion
P
a
per
|
Discussion
P
a
per
|
Discussion
P
a
per
|
Adger, W. N. and Vincent, K.: Uncertainty in adaptive capacity, CR Geosci., 337, 399–410, 2005. 6626, 6628
Amendola, A., Ermoliev, Y., Ermolieva, T. Y., Gitis, V., Koff, G., and Linnerooth-Bayer, J.: A
systems approach to modeling catastrophic risk and insurability, Nat. Hazards, 21, 381–393, 2000. 6622
5
Antonucci, A., Salvetti, A., and Zaffalon, M.: Hazard assessment of debris flows by credal
net-works, in: iEMSs 2004 International Congress: “Complexity and Integrated Resources Man-agement”, edited by: Pahl-Wostl, C., Schmidt, S., and Jakeman, T., International Environ-mental Modelling and Software Societey, Osnabrueck, Germany, 14–17 June, 2004. 6622 AWEL: Amt für Abfall, Wasser, Energie und Luft: Hochwasserschutz an Sihl, Zürichsee und
10
Limmat: Integrales Risikomanagement und Massnahmenziel-Konzept, available at: http:// www.hochwasserschutz-zuerich.zh.ch (last access: October 2015), 2013. 6620
Balbi, S., Giupponi, C., Gain, A., Mojtahed, V., Gallina, V., Torresan, S., and Marcomini, A.: A Conceptual Framework for Comprehensive Assessment of Risk Prevention Measures: The Kulturisk Framework (KR-FWK), available at SSRN 2184193, Basque Centre for Climate
15
Change, Bilbao, 2012. 6626, 6632
Balbi, S., Giupponi, C., Olschewski, R., and Mojtahed, V.: The economics of hydro-meteorological disasters: approaching the estimation of the total costs, BC3 Working Paper Series 2013-12, available at: http://www.kulturisk.eu/results/wp1 and http://papers.ssrn.com/ sol3/papers.cfm?abstract_id=2184193 (last access: October 2015), 2013. 6617
20
Barton, D., Saloranta, T., Moe, S., Eggestad, H., and Kuikka, S.: Bayesian belief networks as a meta-modelling tool in integrated river basin managementóPros and cons in evaluating nutrient abatement decisions under uncertainty in a Norwegian river basin, Ecol. Econ., 66, 91–104, 2008. 6622
Bojovic, D., Bonzanigo, L., Giupponi, C., and Maziotis, A.: Online participation in climate change
25
adaptation: a case study of agricultural adaptation measures in Northern Italy, J. Environ. Manage., 157, 8–19, 2015. 6635
Buchecker, M., Salvini, G., Di Baldassarre, G., Semenzin, E., Maidl, E., and Marcomini, A.: The role of risk perception in making flood risk management more effective, Nat. Hazards Earth
Syst. Sci., 13, 3013–3030, doi:10.5194/nhess-13-3013-2013, 2013. 6619, 6620
30
NHESSD
3, 6615–6649, 2015A spatial Bayesian network model to assess urban flood
risk to people
S. Balbi et al.
Title Page
Abstract Introduction
Conclusions References
Tables Figures
◭ ◮
◭ ◮
Back Close
Full Screen / Esc
Printer-friendly Version
Interactive Discussion
Discussion
P
a
per
|
Discussion
P
a
per
|
Discussion
P
a
per
|
Discussion
P
a
per
|
Bullo, M.: Flood risk: Application and validation of a regional risk assessment methodology to the case study of Sihl river in Zurich, Masters thesis, Ca’Foscari University of Venice, 2013. 6618, 6633
Buntine, W.: A guide to the literature on learning probabilistic networks from data, knowledge and data engineering, IEEE Transactions on, 8, 195–210, 1996. 6622
5
Carsell, K. M., Pingel, N. D., and Ford, D. T.: Quantifying the benefit of a flood warning system, Nat. Hazards Review, 5, 131–140, 2004. 6618
Celio, E., Koellner, T., and Grêt-Regamey, A.: Modeling land use decisions with Bayesian net-works: spatially explicit analysis of driving forces on land use change, Environ. Modell. Softw., 52, 222–233, 2014. 6622
10
Craviolini, C., Heye, C., and André, O.: Das Langstrassenquartier. Veränderungen, Einflüsse, Einschätzungen – 1990 bis 2007, Stadt Zürich, Zürich 2008. 6631
Crichton, D.: The risk triangle, Natural Disaster Management, 102–103, 1999. 6617, 6621 Cutter, S. L., Boruff, B. J., and Shirley, W. L.: Social vulnerability to environmental hazards, Soc.
Sci. Quart., 84, 242–261, 2003. 6617, 6626, 6628
15
Daupras, F., Antoine, J., Becerra, S., and Peltier, A.: Analysis of the robustness of the French flood warning system: a study based on the 2009 flood of the Garonne River, Nat. Hazards, 75, 215–241, 2015. 6618
de Campos, L. M. and Castellano, J. G.: Bayesian network learning algorithms using structural restrictions, Int. J. Approx. Reason., 45, 233–254, 2007. 6621, 6622
20
DEFRA: Flood Risk to people Phase 2, FD2321-TR2 Guidance Document March 2006, Tech. rep., Department for Environment, Food and Rural Affairs, 2006. 6623
EEA: Mapping the Impacts of Natural Hazards and Technological Accidents in Europe: An Overview of the Last Decade, European Environment Agency, Copenhagen, 2010. 6616 EFAS-IS: European Flood Awareness System, available at: https://www.efas.eu/ (last access:
25
October 2015), 2015. 6616
Elmer, F., Thieken, A. H., Pech, I., and Kreibich, H.: Influence of flood frequency on residential building losses, Nat. Hazards Earth Syst. Sci., 10, 2145–2159, doi:10.5194/nhess-10-2145-2010, 2010. 6622
European Commission: Directive 2007/60/EC of the European Parliament and of the Council
30
NHESSD
3, 6615–6649, 2015A spatial Bayesian network model to assess urban flood
risk to people
S. Balbi et al.
Title Page
Abstract Introduction
Conclusions References
Tables Figures
◭ ◮
◭ ◮
Back Close
Full Screen / Esc
Printer-friendly Version
Interactive Discussion
Discussion
P
a
per
|
Discussion
P
a
per
|
Discussion
P
a
per
|
Discussion
P
a
per
|
Frey, C. H. and Patil, S. R.: Identification and review of sensitivity analysis methods, Risk Anal., 22, 553–578, 2002. 6628
Gain, A. K., Giupponi, C., and Renaud, F. G.: Climate change adaptation and vulnerability assessment of water resources systems in developing countries: a generalized framework and a feasibility study in Bangladesh, Water, 4, 345–366, 2012. 6617
5
Gain, A. K., Mojtahed, V., Biscaro, C., Balbi, S., and Giupponi, C.: An integrated ap-proach of flood risk assessment in the eastern part of Dhaka City, Nat. Hazards, 1–32, doi:10.1007/s11069-015-1911-7, 2015. 6617, 6618
Giupponi, C., Gain, A., Mojtahed, V., and Balbi, S.: The socio-economic dimension of flood risk assessment: insights of KULTURisk framework, in: EGU General Assembly Conference
10
Abstracts, Vienna, Austria, 7–12 April 2013, vol. 15, p. 2456, 2013. 6625, 6626
Giupponi, C., Mojtahed, V., Gain, A. K., Biscaro, C., and Balbi, S.: Integrated risk assessment of water related disasters, Paron, P., and Di Baldassarre, G., Hydro-Meteorological Hazards, Risks, and Disasters, Elsevier, Amsterdam, 163–200, 2014. 6618, 6626, 6627, 6632 Grêt-Regamey, A. and Straub, D.: Spatially explicit avalanche risk assessment linking Bayesian
15
networks to a GIS, Nat. Hazards Earth Syst. Sci., 6, 911–926, doi:10.5194/nhess-6-911-2006, 2006. 6622
Hall, J. and Solomatine, D.: A framework for uncertainty analysis in flood risk management decisions, International Journal of River Basin Management, 6, 85–98, 2008. 6618
Jonkman, S., Van Gelder, P., and Vrijling, J.: An overview of quantitative risk measures for loss
20
of life and economic damage, J. Hazard. Mater., 99, 1–30, 2003. 6634
Jonkman, S., Bočkarjova, M., Kok, M., and Bernardini, P.: Integrated hydrodynamic and
eco-nomic modelling of flood damage in the Netherlands, Ecol. Econ., 66, 77–90, 2008. 6617 Kuhlicke, C., Scolobig, A., Tapsell, S., Steinführer, A., and De Marchi, B.: Contextualizing social
vulnerability: findings from case studies across Europe, Nat. Hazards, 58, 789–810, 2011.
25
6626
Maidl, E. and Buchecker, M.: Raising risk preparedness by flood risk communication, Nat. Hazards Earth Syst. Sci., 15, 1577–1595, doi:10.5194/nhess-15-1577-2015, 2015. 6620, 6624
Marcot, B. G., Steventon, J. D., Sutherland, G. D., and McCann, R. K.: Guidelines for developing
30
NHESSD
3, 6615–6649, 2015A spatial Bayesian network model to assess urban flood
risk to people
S. Balbi et al.
Title Page
Abstract Introduction
Conclusions References
Tables Figures
◭ ◮
◭ ◮
Back Close
Full Screen / Esc
Printer-friendly Version
Interactive Discussion
Discussion
P
a
per
|
Discussion
P
a
per
|
Discussion
P
a
per
|
Discussion
P
a
per
|
McCann, R. K., Marcot, B. G., and Ellis, R.: Bayesian belief networks: applications in ecology and natural resource management, Can. J. Forest Res., 36, 3053–3062, 2006. 6622 Meyer, V., Becker, N., Markantonis, V., Schwarze, R., van den Bergh, J. C. J. M., Bouwer, L. M.,
Bubeck, P., Ciavola, P., Genovese, E., Green, C., Hallegatte, S., Kreibich, H., Lequeux, Q., Logar, I., Papyrakis, E., Pfurtscheller, C., Poussin, J., Przyluski, V., Thieken, A. H., and
Vi-5
avattene, C.: Review article: Assessing the costs of natural hazards – state of the art and knowledge gaps, Nat. Hazards Earth Syst. Sci., 13, 1351–1373, doi:10.5194/nhess-13-1351-2013, 2013. 6617
Mojtahed, V., Balbi, S., and Giupponi, C.: Flood Risk Assessment through Bayesian Networks: Effects of Adaptive and Coping Capacity in Risk Reduction to People, in: EGU Leonardo 10
Conference, Torino, Italy 14–16 November 2012, 2012. 6625, 6626
Mukolwe, M., Di Baldassarre, G., and Bogaard, T.: KULTURisk Methodology Application: Ubaye Valley (Barcelonnette, France), Hydro-Meteorological Hazards, Risks, and Disasters, Else-vier, Amsterdam, p. 201, 2014. 6618
Murray, C. J., Vos, T., Lozano, R., et al.: Disability-adjusted life years (DALYs) for 291 diseases
15
and injuries in 21 regions, 1990–2010: a systematic analysis for the Global Burden of Dis-ease Study 2010, Lancet, 380, 2197–2223, 2013. 6634
Nguyen, T. C., Robinson, J., Kaneko, S., and Komatsu, S.: Estimating the value of economic benefits associated with adaptation to climate change in a developing country: a case study of improvements in tropical cyclone warning services, Ecol. Econ., 86, 117–128, 2013. 6618
20
Olschewski, R.: Sihl/Zurich case study, The 3rd KULTURisk workshop: Venice, Italy, 19–20 September 2013, Benefits of disaster prevention measures: consolidating and widening an innovative risk assessment methodology, available at: http://www.corila.it/?q=node/180 (last
access: October 2015), 2013. 6633
Pappenberger, F., Cloke, H. L., Parker, D. J., Wetterhall, F., Richardson, D. S., and Thielen, J.:
25
The monetary benefit of early flood warnings in Europe, Environ. Sci. Policy, 51, 278–291, 2015. 6620
Pearl, J. and Russell, S.: Bayesian networks, Computer Science Department, University of California, Los Angeles, 1998. 6621
Raso, G., Schur, N., Utzinger, J., Koudou, B. G., Tchicaya, E. S., Rohner, F., NíGoran, E. K.,
30
NHESSD
3, 6615–6649, 2015A spatial Bayesian network model to assess urban flood
risk to people
S. Balbi et al.
Title Page
Abstract Introduction
Conclusions References
Tables Figures
◭ ◮
◭ ◮
Back Close
Full Screen / Esc
Printer-friendly Version
Interactive Discussion
Discussion
P
a
per
|
Discussion
P
a
per
|
Discussion
P
a
per
|
Discussion
P
a
per
|
Romang, H., Zappa, M., Hilker, N., Gerber, M., Dufour, F., Frede, V., Bérod, D., Oplatka, M., Hegg, C., and Rhyner, J.: IFKIS-Hydro: an early warning and information system for floods and debris flows, Nat. Hazards, 56, 509–527, 2011. 6620
Ronco, P., Bullo, M., Torresan, S., Critto, A., Olschewski, R., Zappa, M., and Marcomini, A.: KULTURisk regional risk assessment methodology for water-related natural hazards –
5
Part 2: Application to the Zurich case study, Hydrol. Earth Syst. Sci., 19, 1561–1576, doi:10.5194/hess-19-1561-2015, 2015. 6618, 6623
Rose, A.: Economic principles, issues, and research priorities in hazard loss estimation, in: Modeling Spatial and Economic Impacts of Disasters, Springer-Verlag, Heidelberg, Ger-many, 13–36, 2004. 6617
10
Spirtes, P., Glymour, C. N., and Scheines, R.: Causation, Prediction, and Search, vol. 81, MIT press, Cambridge MA, USA, 2000. 6626
Steinführer, A., Kuhlicke, C., De Marchi, B., Scolobig, A., Tapsell, S., and Tunstall, S.: Towards flood risk management with the people at risk: From scientific analysis to practice recommen-dations (and back), Flood Risk Management: Research and Practice: Extended Abstracts
15
Volume (332 pages)+full paper CD-ROM, p. 167, 2008. 6627
Straub, D.: Natural hazards risk assessment using Bayesian networks, in: 9th International Conference on Structural Safety and Reliability, Rome, Italy, 19–23 June 2005, 20–23, 2005. 6622
Thieken, A. H., Müller, M., Kreibich, H., and Merz, B.: Flood damage and influencing factors:
20
new insights from the August 2002 flood in Germany, Water Resour. Res., 41, W12430 doi:10.1029/2005WR004177, 2005. 6626, 6628
UNDRO: Natural Disasters and Vulnerability Analysis, Tech. rep., United Nations Disaster Relief Organization, Geneva, Switzerland, 1980. 6617, 6621
United Nation International Strategy for Disaster Reduction (UNISDR): Hyogo framework for
25
action 2005–2015: building the resilience of nations and communities to disasters, in: Final Report of the World Conference on Disaster Reduction, 18 to 22 January 2005 in Kobe, Hyogo, Japan 2006 (A/CONF 206/6), UNISDR Geneva, Switzerland, 2010.
Uusitalo, L.: Advantages and challenges of Bayesian networks in environmental modelling, Ecol. Model., 203, 312–318, 2007. 6627
30
NHESSD
3, 6615–6649, 2015A spatial Bayesian network model to assess urban flood
risk to people
S. Balbi et al.
Title Page
Abstract Introduction
Conclusions References
Tables Figures
◭ ◮
◭ ◮
Back Close
Full Screen / Esc
Printer-friendly Version
Interactive Discussion
Discussion
P
a
per
|
Discussion
P
a
per
|
Discussion
P
a
per
|
Discussion
P
a
per
|
Vogel, K., Riggelsen, C., Merz, B., Kreibich, H., and Scherbaum, F.: Flood damage and influ-encing factors: a Bayesian network perspective, in: 6th European Workshop on Probabilistic Graphical Models (PGM 2012), University of Granada, Granada, Spain, 2012. 6622, 6628 Vogel, K., Riggelsen, C., Korup, O., and Scherbaum, F.: Bayesian network learning for
natu-ral hazard analyses, Nat. Hazards Earth Syst. Sci., 14, 2605–2626,
doi:10.5194/nhess-14-5