ACPD
10, 7215–7264, 2010Combining visible and infrared radiometry and lidar
data
A. Bozzo et al.
Title Page
Abstract Introduction
Conclusions References
Tables Figures
◭ ◮
◭ ◮
Back Close
Full Screen / Esc
Printer-friendly Version
Interactive Discussion Atmos. Chem. Phys. Discuss., 10, 7215–7264, 2010
www.atmos-chem-phys-discuss.net/10/7215/2010/ © Author(s) 2010. This work is distributed under the Creative Commons Attribution 3.0 License.
Atmospheric Chemistry and Physics Discussions
This discussion paper is/has been under review for the journal Atmospheric Chemistry and Physics (ACP). Please refer to the corresponding final paper in ACP if available.
Combining visible and infrared
radiometry and lidar data to test ice
clouds optical properties
A. Bozzo1,*, T. Maestri1, and R. Rizzi1
1
Dipartimento di Fisica, Universit `a di Bologna, Italy
*
now at: University of Edinburgh, School of GeoSciences, Edinburgh, UK
Received: 5 December 2009 – Accepted: 6 March 2010 – Published: 18 March 2010 Correspondence to: R. Rizzi ([email protected])
ACPD
10, 7215–7264, 2010Combining visible and infrared radiometry and lidar
data
A. Bozzo et al.
Title Page
Abstract Introduction
Conclusions References
Tables Figures
◭ ◮
◭ ◮
Back Close
Full Screen / Esc
Printer-friendly Version
Interactive Discussion
Abstract
Measurements taken during the 2003 Pacific THORPEX Observing System Test (P-TOST) by the MODIS Airborne Simulator (MAS), the Scanning High-resolution Inter-ferometer Sounder (S-HIS) and the Cloud Physics Lidar (CPL) are compared to sim-ulations performed with a line-by-line and multiple scattering modeling methodology 5
(LBLMS). Formerly used for infrared hyper-spectral data analysis, LBLMS has been extended to the visible and near infrared with the inclusion of surface bi-directional re-flectance properties. A number of scenes are evaluated: two clear scenes, one with nadir geometry and one cross-track encompassing sun glint, and three cloudy scenes, all with nadir geometry.
10
CPL data is used to estimate the particulate optical depth at 532 nm for the clear and cloudy scenes. Cloud optical depth is also retrieved from S-HIS infrared window radiances, and it agrees with CPL values, to within natural variability. MAS data are simulated convolving high resolution radiances.
The paper discusses the results of the comparisons for the clear cases and for the 15
three cloudy cases. LBLMS clear simulations agree with MAS data to within 20% in the shortwave (SW) and near infrared (NIR) spectrum and within 2 K in the infrared (IR) range. It is shown that cloudy sky simulations using cloud parameters retrieved from IR radiances systematically underestimate the measured radiance in the SW and NIR by nearly 50%, although the IR retrieved optical thickness agree with same measured 20
by CPL. MODIS radiances measured from Terra are also compared to LBLMS simula-tions in cloudy condisimula-tions using retrieved cloud optical depth and effective radius from MODIS, to understand the origin for the observed discrepancies. It is shown that the simulations agree, to within natural variability, with measurements in selected MODIS SW bands.
25
ACPD
10, 7215–7264, 2010Combining visible and infrared radiometry and lidar
data
A. Bozzo et al.
Title Page
Abstract Introduction
Conclusions References
Tables Figures
◭ ◮
◭ ◮
Back Close
Full Screen / Esc
Printer-friendly Version
Interactive Discussion
1 Introduction
A recent review of the light scattering properties of cirrus (Baran, 2009) points out that it is more desirable to construct cirrus ice crystal models that predict the light scattering properties of non-spherical ice crystals that can be applied at any wavelength rather than at particular wavelengths. It also points out that the choice of ice crystal model, 5
beside its importance for climate modeling, is also important for the space-based re-mote sensing of cirrus properties, since inappropriate choice of the scattering phase function may lead to errors in retrieved optical depth of several factors. The review contains a wealth of references pertaining to this problem.
The issue of the quality of cloud products that are now routinely produced from satel-10
lite data is addressed in Ham et al. (2009) that examines the quality of the MODIS retrieved cloud products. These are used as input of a radiative transfer model to com-pute multiply scattered radiances at a number of MODIS channels and comparing the measurements to the simulations. The main findings are that radiances for shortwave bands between 0.466 and 0.857 µm appear to be quite accurate, while simulated ra-15
diances for the 1.24, 1.63 and 3.78 µm bands do not well agree with measurements. Large differences between simulations and data are also found in the infrared window bands (such those centered at 8.56, 11.0 and 12.0 µm).
In Yang et al. (2007) the differences of the bulk optical properties of ice clouds re-trieved in MODIS collection 4 and 5 are investigated and it is shown that collection 20
5 optical thickness over ocean are a factor 1.9 higher than the collection 4 counter-part. Moreover it is stated that the differences can lead to either an enhancement or a reduction of the warming effect of ice clouds, depending on the specific ice cloud of interest.
In the Zhang et al. (2009) paper, the main concern is the influences of different ice 25
ACPD
10, 7215–7264, 2010Combining visible and infrared radiometry and lidar
data
A. Bozzo et al.
Title Page
Abstract Introduction
Conclusions References
Tables Figures
◭ ◮
◭ ◮
Back Close
Full Screen / Esc
Printer-friendly Version
Interactive Discussion two retrievals. They conclude that ice cloud optical thickness retrievals based on
satel-lite measurements of solar reflection are highly sensitive to the choice of the ice particle model assumed in the retrieval.
The present study was initiated to evaluate the quality of a forward modeling method-ology, called Line-By-Line Multiple Scattering (LBLMS), that is an extension to the 5
shortwave of a state-of-the-art methodology already used to simulate high resolution spectral data in the infrared spectral range, from 3000 to 50 cm−1 (Rizzi et al., 2001; Amorati and Rizzi, 2002; Maestri and Rizzi, 2003; Tjemkes et al., 2003; Rizzi and Maestri, 2003; Maestri et al., 2005).
Two diverse data sets are used. The first is a field study during the 2003 Pacific 10
THORPEX Observing System Test (P-TOST, http://angler.larc.nasa.gov/thorpex/), that will be referred to as PTH. During PTH the spectro-radiometric data are combined with lidar products that describe the particulate (aerosol and clouds) extinction profiles. Since our long-term interests are on the retrieval of cloud variables, the experimental cases selected for the core study involve radiances measured in presence of cloud 15
decks. However the methodology and results for two clear scenes are also included, since nadir and cross track simulations of a clear scene provide evidence of correct modeling of the surface and of the aerosol layers, especially in the shortwave (SW) part of the spectrum. This is especially important when dealing with thin clouds in order to avoid that incorrect simulations of surface or aerosols properties affect the 20
cloud properties retrieval process.
The second data set is from the Moderate Resolution Imaging Spectroradiometer (MODIS) and corresponding retrieved cloud products. This data set is used to clarify the unexpected results obtained from the PTH cloud cases, and is not intended to present results of statistical significance.
25
ACPD
10, 7215–7264, 2010Combining visible and infrared radiometry and lidar
data
A. Bozzo et al.
Title Page
Abstract Introduction
Conclusions References
Tables Figures
◭ ◮
◭ ◮
Back Close
Full Screen / Esc
Printer-friendly Version
Interactive Discussion
2 Description of the experiment and instruments
The PTH data-set was measured on 22 and 23 February 2003 during the flight of the P-TOST over the Pacific Ocean SE of the Hawaiian Islands, when the high altitude NASA aircraft ER-2 carried the three instruments of interest for our analysis: S-HIS, MAS and CPL.
5
The Scanning High-resolution Interferometer Sounder (S-HIS) (Revercomb et al., 1998) is a Fourier-transform spectrometer with laser-controlled sampling, operating in the thermal spectrum between 3.3 µm and 17.2 µm (3000–680 cm−1); it utilizes a 45◦scene mirror that rotates through a measurement sequence consisting of views of the earth and two calibration sources, one at ambient and another up to 60 K above 10
ambient. During each scan, 11 cross-track Field of Views (FOVs) are sampled (±35◦ total view angle), with a nadir spatial resolution of 2 km from the nominal 20 km ER-2 flight level and a spectral resolution of 0.5 cm−1.
The MODIS Airborne Simulator (MAS) (King et al., 1996) was built as support to the development of the MODIS satellite instrument: it is a 50 channel scanning spec-15
trometer that covers the spectral range from visible to thermal infrared and acquires 50×50 m (at nadir) pixel data across a 37 km swath (±43◦view angle) from the nominal ER-2 flight level. At the nominal ER-2 ground speed of 210 m/s, MAS FOVs show an along-track superposition of the scan lines of about 33% of the pixel width.
The Cloud Physics Lidar (CPL) (McGill et al., 2002) provides cloud and aerosol 20
backscatter profile at 30 m vertical and 200 m horizontal resolution at 1064 nm, 532 nm, 355 nm. During the PTH experiment the CPL, provided optical depths at 532 nm up to a saturation value of about 3.
In addition to the ER-2, the NOAA G-4 research aircraft flew carrying the Airborne Vertical Atmospheric Profiling System (AVAPS) to measure the temperature and hu-25
ACPD
10, 7215–7264, 2010Combining visible and infrared radiometry and lidar
data
A. Bozzo et al.
Title Page
Abstract Introduction
Conclusions References
Tables Figures
◭ ◮
◭ ◮
Back Close
Full Screen / Esc
Printer-friendly Version
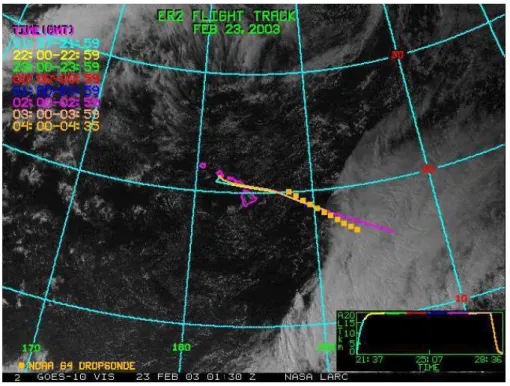
Interactive Discussion took off20 min after the ER-2. A wide leveled high pressure area was prevailing over
the Hawaiian region. The ER-2 flew from Hickam AFB to get on WNW-ESE oriented track line (20◦N, 153◦W to 16◦N, 144◦W ) designed to enter and transect subtropical jet zone running up from tropics between 150 and 140◦W longitude. ER-2 did 2 back and forth runs (4 total segments) of this line with the G-4 doing profiling on a similar 5
but shorter leg, releasing 11 drop-sondes. G-4 flew back after two ER-2 legs. The Western third of this line contained clear to partly cloudy (low cloud) skies. Middle and eastern ends were overcast with thick cirrus associated with the subtropical flow. Transect crossed core of subtropical jet positioned at about 145◦W. An overlook of the entire mission’s route can be seen in Fig. 1.
10
2.1 Modeling methodology
Although S-HIS and MAS flew together on the ER-2, the data-recording time of the two instruments had different reference, resulting in different time overpass over the same scene. Moreover, it had been noted (R. Holz, University of Wisconsin, Madison, personal communication, 2004) that S-HIS data had wrong geographic data position-15
ing due to use of the inertial navigation system of the ER-2 as reference, which in the analyzed mission didn’t work properly. Therefore a scheme was developed to collo-cate MAS and S-HIS data using MAS channel 45 (a window centered at 11 µm). This channel performs a relatively more stable measurement of the scene radiance with re-spect to window channels located in NIR range, which are affected, moreover, by solar 20
contribution. Two sets of virtual measurements are generated, having the spatial reso-lution of S-HIS and the spectral resoreso-lution of MAS: MAS pixels are averaged over the S-HIS footprint closest to nadir and the S-HIS data is convolved over the MAS spectral response function to produce the equivalent MAS spectral bands (Moeller et al., 2003). The minimisation of the mean square differences between the convolved S-HIS signal 25
ACPD
10, 7215–7264, 2010Combining visible and infrared radiometry and lidar
data
A. Bozzo et al.
Title Page
Abstract Introduction
Conclusions References
Tables Figures
◭ ◮
◭ ◮
Back Close
Full Screen / Esc
Printer-friendly Version
Interactive Discussion between MAS and S-HIS data is found to be 41±2 s. The uncertainty of 2 s produces a
possible spatial displacement of about 400 m at the nominal ground speed of the ER-2, i.e. it is smaller than the linear dimension of the S-HIS nadir footprint.
The simulations are done with a suite of codes collectively called Line-By-Line Multi-ple Scattering (LBLMS). In the present work the line-by-line computations of layer spec-5
tral optical depths are done using the Line-by-Line Radiative Transfer Model (LbLRTM) (Clough and Iacono, 1995). LbLRTM can solve the clear sky radiative transfer equation, but in our study is used to generate layer monochromatic optical depths (OD). These are interpolated at 0.002 cm−1and then convolved to compute spectrally averaged OD. Tests were done to find the appropriate spectral resolution for the specific sensor that 10
is modeled (S-HIS and MAS in this work) so that the difference between radiances convolved using the averaged optical depths or directly the LbLRTM monochromatic radiances were below a given threshold. Results are dependent on the spectral widths over which the OD average is performed and also on the atmospheric layering.
After the tests three different spectral resolutions were used, as a compromise be-15
tween a reasonable computing time and accuracy: 0.01 cm−1 from 580 to 3000 cm−1 (3.33–17.2 µm, indicated as IR in this paper), 0.05 cm−1
from 3000 to 7000 cm−1
(NIR, 1.43–3.33 µm ), and 0.5 cm−1from 7000 to 22 000 cm−1 (SW, 0.45–1.43 µm). The HI-TRAN 2004 (Rothman et al., 2005) spectroscopic database and the MT-CKD 1.3 water vapour continuum absorption model (Clough et al., 2005) are used.
20
The integration of the radiative transfer equation, including multiple scattering, is based on the code RT3 (Evans and Stephens, 1991). Layer spectral absorption optical depth is the sum of molecular and particle absorption and spectral total scattering optical depth is the sum of particle and Rayleigh scattering with the total phase function being a weighted mean of the two components.
25
ACPD
10, 7215–7264, 2010Combining visible and infrared radiometry and lidar
data
A. Bozzo et al.
Title Page
Abstract Introduction
Conclusions References
Tables Figures
◭ ◮
◭ ◮
Back Close
Full Screen / Esc
Printer-friendly Version
Interactive Discussion function of the oceanic pigment concentration. The model implemented in RT3 is
anal-ogous to the one adopted in 6S (Vermote et al., 2006), with the only exception being the wind direction dependency that in RT3, due to limitations inherent to its computa-tional structure, is not allowed. A description of the methods adopted and of the re-sults obtained is found in Bozzo (2009). Post-processing of high resolution radiances 5
to produce un-apodised spectra at S-HIS resolution is done as described in Rizzi et al. (2001). Simulated MAS radiances are obtained by convolving the spectral values at the indicated resolution with the MAS response functions (NASA, cited 2008).
Aerosol single scattering optical depth and phase function are computed using an in-house code, but the main physics contained (refractive index of components, aerosol as 10
a collection of homogeneous spherical particles, size distributions, definition of external mixtures and growth coefficients) is analogous to the package OPAC (Hess et al., 1998) and so are the computed properties. The Mie scattering portion is handled by routines distributed together with the initial version of the RT3 code by Frank Evans.
The retrieval methodology (RT-RET) used to derive cloud optical depths and eff ec-15
tive dimension of the cloud particle size distribution (PSD) from S-HIS radiances is described (and applied to Arctic and Mid latitude clouds respectively) in Maestri and Holz (2009) and Maestri et al. (2010). RT-RET uses LbLRTM and the same doubling and adding algorithm (RT3) described earlier.
The single scattering properties for different ice habits in the short-wave (0.25– 20
4.5 µm) and long-wave (4.5–100 µm) spectral ranges are taken from Yang and Liou (1998) and Yang et al. (2005) and will be referred to in the following by the acronyms SSP-SW and SSP-IR.
Previous work (e.g. Wendisch et al., 2005; Wyser, 1999) has shown large differences in simulations based on PSD composed of single shapes and there are no reasons to 25
ACPD
10, 7215–7264, 2010Combining visible and infrared radiometry and lidar
data
A. Bozzo et al.
Title Page
Abstract Introduction
Conclusions References
Tables Figures
◭ ◮
◭ ◮
Back Close
Full Screen / Esc
Printer-friendly Version
Interactive Discussion ice clouds. The major differences between mid-latitude and tropical cirrus clouds are
found for cirri formed near strong tropical convective events, at the top of large anvils. Such ice clouds present usually higher fractions of larger particles than mid latitude-synoptic ice clouds, associated to strong updrafts (Baum et al., 2005). In case of syn-optically generated mid-latitude cirrus, the large ice crystals tend to subside quickly due 5
to the weak updrafts. In our case, although the cirrus is associated with the subtropical jet-stream, it does not show the characteristics related to the tropical convective struc-tures. MIXML has been tested in the analysis of infrared interferometric data collected at Mid Latitudes and in cloudy conditions during the italian phase of the EAQUATE experiment Maestri et al. (2010).
10
The ice particle size distribution (PSD) adopted for the forward and inverse compu-tations is a Gamma distribution:
n(D)=N0Dµe−λD (1)
whereDis the particle maximum dimension,N0is the intercept value of the distribution,
λ the slope (with unit of an inverse dimension) and µ is the dispersion (or shape) 15
parameter. The PSD is extended to particles smaller than the maximum dimension for which properties are available in the quoted databases by assuming that in the range from 0 to 2 µm spherical particles are present, whose properties are computed using same code as for aerosol properties.
Particular attention has been given to the treatment of the phase function to account 20
for the sharp diffraction peak exhibited by the ice crystals. Since the scattering phase function is handled with an expansion in Legendre polynomials, such peaked func-tions would require thousands of components, which in turn would imply an extremely time-consuming solution. Instead the procedure proposed by Potter (1970) has been followed and the phase function peak is modified, with a spectrally varying algorithm 25
ACPD
10, 7215–7264, 2010Combining visible and infrared radiometry and lidar
data
A. Bozzo et al.
Title Page
Abstract Introduction
Conclusions References
Tables Figures
◭ ◮
◭ ◮
Back Close
Full Screen / Esc
Printer-friendly Version
Interactive Discussion The number of Legendre terms used in the computation is linked to the number of
angles employed in the zenith discretization in each hemisphere (Nu). After consider-able tests we have used, for the ice cloud cases, Nu=32 (and 125 Legendre terms) in all spectral regions except from 600 to 4850 cm−1 whereNu is set to 60 (237 Leg-endre terms). Since the CPU time required for LBLMS computation is proportional to 5
the cube ofNu, the accurate computation of high resolution radiances has required a massive computational effort that was made possible only after code parallelisation.
3 Description of the clear cases and results
3.1 Measurement conditions for the clear cases
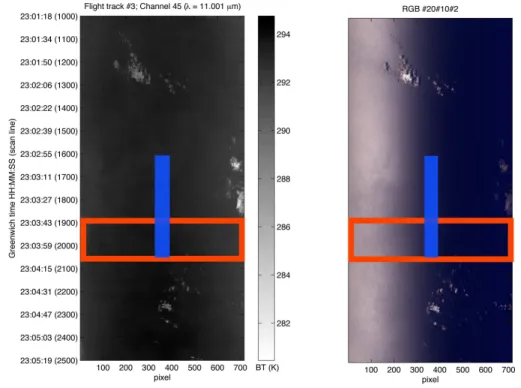
Figure 2 illustrates the scene under consideration: the left panel is MAS channel 45 10
(11 µm) and the right panel is an RGB image from three MAS channels. A widespread sun-glint-affected region is observed and clearly distinguishable in the right panel along the full scan. Two regions are selected for the nadir and cross-track comparisons. For the nadir case the measured MAS data are averaged over a 20 pixel wide and 400 pixel long area, which covers a section 2◦wide (±1◦across the nadir line) and roughly 15
15 km long, along the blue line in Fig. 2. For the cross-track case MAS measurements are averaged over an area as wide as the full MAS swath and 120 pixel long (the red box on Fig. 2), which roughly corresponds to a 4 km long and 40 km wide region.
In both case studies the averaged MAS data is compared to the LBLMS simulation. The solar zenith angle is approximately 31◦and solar azimuth 204◦; sensor azimuth 20
angle swings between 204 and 24◦, hence aligned with the surface incidence plane of solar radiation.
Three drop-sondes were launched in coincidence with this track: one at 23:07 UTC, the second at 23:12 UTC and the third at 23:17 UTC. All drop-sondes measured a 10 m wind speed between 6 m/s and 7 m/s with azimuthal direction around 30◦, hence 25
ACPD
10, 7215–7264, 2010Combining visible and infrared radiometry and lidar
data
A. Bozzo et al.
Title Page
Abstract Introduction
Conclusions References
Tables Figures
◭ ◮
◭ ◮
Back Close
Full Screen / Esc
Printer-friendly Version
Interactive Discussion in the simulation at 6.5 m/s. The vertical profile of temperature and humidity used
for the simulation is a composite of the data from the 23:17 UTC drop-sonde and a standard tropical profile (Anderson et al., 1986) to fill the 10 km gap between the G-4 and the ER-2 cruise altitude. The CO2 mixing ratio profile is modified to measured global mean value for the period of the campaign. Absorption from chloro-fluoro-carbon 5
macro molecules (CFC) is also accounted for.
The CPL detected the presence of an aerosol layer distributed in the boundary layer from 1000 m down to about 500 m. Below this level there is no information on aerosol optical depth. Since the source of aerosol is the oceanic surface an exponential ex-trapolation of the measured optical depth profile down to the marine surface is as-10
sumed. The integrated optical depth at 532 nm obtained with this procedure is 0.07. The aerosol layers (from surface to 1000 m height) are simulated with the optical char-acteristics of a maritime tropical aerosol model (same mixture defined in Hess et al. (1998), grown in an ambient with 80% relative humidity, in accordance with the drop-sondes measurements.
15
The pigment concentration of the oceanic water derived from the global products of the SeaWiFS satellite (Johnson et al., 1998), averaged over 8-days around the 22 February 2003 in the Pacific Ocean SE of the Hawaiian Islands, has a mean value of 0.07 mg/m3.
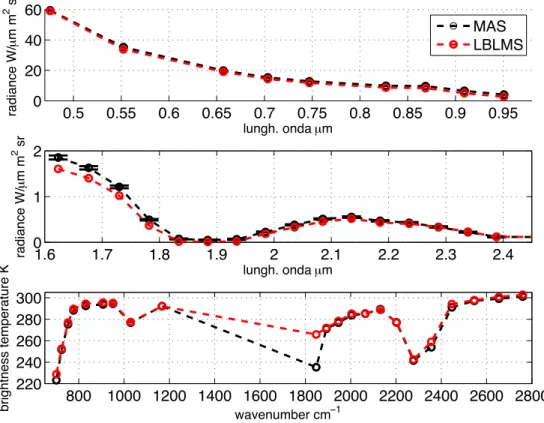
3.2 Results for the clear nadir case
20
Results for the nadir case are shown in the three panels of Fig. 3 in terms of radi-ance (all radiradi-ance values are given with unit W/(m2µm sr) ) for the SW and NIR and brightness temperature (K) for the IR range. Figure 4 shows the relative errors in ra-diance between LBLMS and MAS data for the SW and NIR range and the absolute error in brightness temperature (K) for the IR range. The error bars added to the mea-25
ACPD
10, 7215–7264, 2010Combining visible and infrared radiometry and lidar
data
A. Bozzo et al.
Title Page
Abstract Introduction
Conclusions References
Tables Figures
◭ ◮
◭ ◮
Back Close
Full Screen / Esc
Printer-friendly Version
Interactive Discussion centered at 1848 cm−1 did not work properly during the selected mission and should
be ignored in the comparison.
The difference between the simulations and the MAS data is almost constant in the SW range between 0.45 and 1 µm with a value of about 1.5 W/(m2µm sr), hence the relative error increases with increasing wavelength since the radiance level is decreas-5
ing: it remains below 10% for wavelength shorter than 0.7 µm and it grows up to 35% approaching the channels at 0.95 µm. In the NIR range the relative error is around 10–15% with the exception of the strong H2O band, where it reaches values of about
90%.
In the IR, from 500 cm−1to 2800 cm−1, the absolute errors are between 0.5 and 2 K 10
except in the 3 channels located in the strong CO2absorption bands (one at 700 cm− 1
and the other two at 2250 and 2450 cm−1). The discrepancy in the opaque channels due to CO2 absorption is certainly linked to the assumed atmospheric temperature
profile . The surface skin temperature is set equal to the last temperature measured by the drop-sonde and this affects the simulation in the window regions. These dif-15
ferences could be easily eliminated to a large extent by improving the assumed atmo-spheric/surface temperature profile: these fitting procedures are however more per-tinent when a product is to be obtained rather than when a detailed case study is examined.
The largest relative differences in the SW and NIR are found in channels with impor-20
tant water vapour absorption. We have performed simulations also of the S-HIS data (not shown) and the results show a negative bias (the simulation being colder that the S-HIS data) in the infrared vibro-rotational band of water vapour. Therefore the water vapour profile, and in particular the profile assumed between the G-4 and the ER-2 flight levels, is likely more humid than the true profile, which also explains the negative 25
ACPD
10, 7215–7264, 2010Combining visible and infrared radiometry and lidar
data
A. Bozzo et al.
Title Page
Abstract Introduction
Conclusions References
Tables Figures
◭ ◮
◭ ◮
Back Close
Full Screen / Esc
Printer-friendly Version
Interactive Discussion In conclusion the main causes of the observed discrepancies in the SW and NIR
could be the modeling of the scattering by the oceanic surface, the assumed aerosol optical depth vertical profile, the aerosol mixture adopted and its growth properties. Each of these will be discusses in what follows.
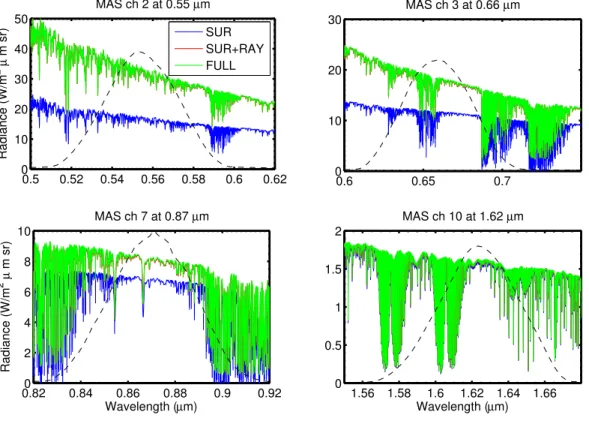
To understand the importance of each process, the four panels of Fig. 5 show the 5
upwelling radiance at MAS height simulated for four channels when a) the source func-tion is the surface with a molecular atmosphere that only absorbs radiance (line la-beled SUR in all panels), b) when molecular scattering is added as source of radiance (SUR+RAY) and finally c) when aerosol is also present (FULL). It is evident that in our case study the surface and molecular scattering are the dominant radiation sources. 10
Currently our modeling of the oceanic surface assumes that the sun glint pattern is independent on the wind direction. Comparisons with the 6S model indicate that this hypothesis gives an error in the range 10–20% of the signal for low solar zenith angles (Bozzo, 2009). In particular, in case of a zenith angle of 31◦ the up-welling radiation
is enhanced if the wind is blowing along the incident and reflected solar beam plane, 15
whereas it is reduced in case of a wind blowing orthogonal to the sun’s reflection plane. The wind’s azimuthal angle retrieved from the drop-sondes measurements is around 60◦, hence 36◦ from the sun’s reflection plane, which lies along the 24–204◦azimuthal line.
The OPAC standard Maritime tropical aerosol model is an external mixture of three 20
components, one of which, the sea salt coarse mode (SSCM) accounts for 1.4% of the mass of the mixture. The extinction optical depth has a maximum around 5 µm decreasing toward shorter wavelengths, markedly different from the sea salt accumu-lation mode component (SSAM) which has a maximum around 1 micron. Therefore one could devise a slightly different mixture, by increasing the mass of the SSCM and 25
ACPD
10, 7215–7264, 2010Combining visible and infrared radiometry and lidar
data
A. Bozzo et al.
Title Page
Abstract Introduction
Conclusions References
Tables Figures
◭ ◮
◭ ◮
Back Close
Full Screen / Esc
Printer-friendly Version
Interactive Discussion is so small in this case study that it is not necessary to dwell on the various sensitivity
tests performed.
In conclusion the overall agreement of LBLMS simulations to MAS data appears to be good (mostly within 20% in the SW and NIR and 2 K in the IR), and certainly consis-tent with the approximations used. The small underestimation of LBLMS simulations 5
with respect to MAS measurements in the SW can be related to the simplification of a wind direction independent bidirectional reflectance (BDRF).
In the next section we examine the same scenario, but from different viewing angles.
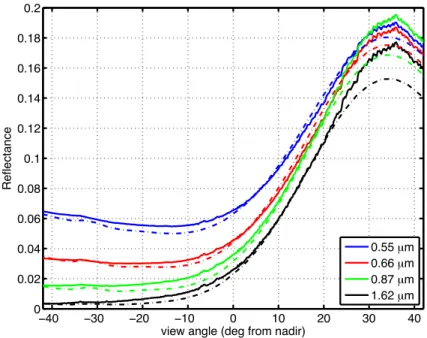
3.3 Results for the clear cross-track case
LBLMS is tested with a full MAS cross-track scan swinging in the analyzed scene from 10
the maximum to the minimum of the glint reflection region, along the reflection plane of the incoming solar radiation. Up-welling radiation at 20 km is simulated at 32 zenith angles for each hemisphere using 64 terms of the azimuthal-mode Fourier expansion. Pigment concentration, aerosol profile, model and relative humidity are same for the nadir case. Figure 6 shows the reflectance at 20 km for 4 MAS channels defined in 15
the previous section. The BDRF for various wavelengths is computed from averaged MAS data (full lines) inside the red box in Fig. 2, and from LBLMS simulations (dashed lines).
The peak in reflectance is reached for all the 4 curves at around 36◦, slightly shifted toward the horizon from the Fresnel reflection point that is supposed to be at the in-20
cidence angle of 31◦. The glint pattern appears to be less steep and slightly more skewed towards the horizon in the MAS observations: in fact some difference in the glint pattern is expected due to the assumption of a wind direction-independent BDRF in the simulations.
The relative difference are between −10 to +10% over the whole scan for the SW 25
ACPD
10, 7215–7264, 2010Combining visible and infrared radiometry and lidar
data
A. Bozzo et al.
Title Page
Abstract Introduction
Conclusions References
Tables Figures
◭ ◮
◭ ◮
Back Close
Full Screen / Esc
Printer-friendly Version
Interactive Discussion
4 Description of the cloudy cases and results
4.1 Measurement conditions for the three cloudy cases
As already mentioned the ER-2 did 4 segments and the middle and eastern end of the flight leg were characterized by an extended cirrus associated with the subtropical jet-stream. The transect crossed the jet at about 145◦W and 19–20◦N. The ER-2 made 5
two back and forth overpasses over the high, thick tropical cirrus.
As pointed out in the discussion of the clear cases, some assumptions adopted in the ocean’s reflectivity model implemented in LBLMS could lead to spurious effects in the interpretation of the upwelling radiance, especially at low sun zenith angles. For this reason all measurements between the ER-2 take offtime and 24:00 UTC (14:00 local 10
time) were disregarded. The chosen transect is located between 01:26–01:34 UTC and is characterized by a solar zenith angle of 57◦.
Thermal infrared and visible MAS imagery show (see Fig. 7) that the cloud is fairly homogeneous only in the optically thickest part and quite variable elsewhere. The thinnest part, located at the edge of the very extended cloud layer, is rather inhomoge-15
neous with many open gaps over the underlying ocean. Some small cumulus clouds can be spotted below the cirrus layer, although not directly beneath the flight line.
Being the flight of the NOAA G-4 much shorter than the ER-2’s mission, the drop-sonde spatially closest to the data analyzed was launched at 23:27 UTC, hence 2 h before the chosen ER-2 sector, but from satellite imagery there seem to be no im-20
portant cloud development in these two hours. In the humidity profile, the cloud layer position is characterized by a net increase of relative humidity between 200 hPa and 300 hPa up to a value of 60% in the middle of the layer for the section with the optically thickest cloud. As in the clear sky case, a sub-tropical climatological standard profile is used to fill the gap between the two aircrafts. As an estimate of the surface wind 25
ACPD
10, 7215–7264, 2010Combining visible and infrared radiometry and lidar
data
A. Bozzo et al.
Title Page
Abstract Introduction
Conclusions References
Tables Figures
◭ ◮
◭ ◮
Back Close
Full Screen / Esc
Printer-friendly Version
Interactive Discussion pigment concentration and the aerosol optical depth, profile and mixture are the same
adopted in the clear sky case.
For layers with optical depth at 532 nm less than 3, CPL data is used to characterize the internal cloud structure and to define top and bottom cloud levels. Figure 8 shows the extinction cross section at 532 nm at nadir for the flight stretch chosen for the com-5
parison. The cloud becomes thicker and the top height increases while flying from the edge of the cloud layer to the inner part.
The CPL optical depth at 532 nm is shown in Fig. 9 and it is seen that from 01:32 UTC the CPL signal is saturated, hence the cloud bottom information is not reliable. Three sectors are selected from the whole track: they are representative of a very thin (be-10
tween red lines in Fig. 9), a medium thin (green lines) and a moderately thick (blue lines) cirrus layer.
Cloud optical thickness (OT) and effective dimensionDeare retrieved using RT-RET , applied to averaged S-HIS data, collocated with MAS data, over each of the three sectors highlighted in Fig. 9.
15
The retrieval methodology RT-RET can be based on any ice crystal shape, but since no measured data is available from the field campaign about the micro-physical com-position of the cirrus layer, we have used MIXML, for reasons already discussed.
The size distribution is described by a Gamma with a value of µ=0. Cloud top and cloud bottom are the average in each sector of the values determined from CPL 20
measurements collocated with S-HIS FOVs. The ice mass (IWC) is assumed to be distributed uniformly over the whole depth of the cloud to match the integrated OT re-trieved by RT-RET. In regions where the CPL signal is not saturated, the extinction profile could be used to infer the IWC vertical distribution (assuming a vertically invari-ant constinvari-ant composition and size distribution). Comparisons (not shown) between the 25
ACPD
10, 7215–7264, 2010Combining visible and infrared radiometry and lidar
data
A. Bozzo et al.
Title Page
Abstract Introduction
Conclusions References
Tables Figures
◭ ◮
◭ ◮
Back Close
Full Screen / Esc
Printer-friendly Version
Interactive Discussion first 2 sectors), we decided to maintain a uniform IWC profile for all the simulations
performed.
Table 5 summarizes the characteristics of each cloud scene. The effective diameter retrieved by RT-RET is in the range 64 to 80 µm, therefore the bulk of the mixture is a combination of the optical properties of irregular aggregate of hexagonal columns and 5
3-dimensional bullet rosette. The retrieved OT in the IR range is used to determine the total ice mass for the whole depth of the cloud (IWP) and then used to compute the OT at 532 nm using the same PSD, type of mixture and optical properties database: such OT values agree within the natural variability of the OT values derived from CPL, also shown in Table 5, in the three sectors.
10
4.2 Results for the cloudy cases
LBLMS is used to simulate the upwelling radiance from the three sectors highlighted in Fig. 9 over the whole spectral range covered by MAS, using the same configuration as in the clear sky case.
As for the clear sky case, the MAS channel located at 1848 cm−1did not work prop-15
erly. In this case we substituted the biased MAS channel with the S-HIS data convolved with the MAS instrumental response function, since the agreement between the instru-ments is excellent, as shown in Fig. 10 throughout most of the IR spectrum.
Figures 11, 12 and 13 show the comparison between MAS measurements and LBLMS simulations in the three cloud sectors. Figure 14 shows the relative difference 20
between LBLMS simulations and MAS measurements.
Since the procedure RT-RET is based on an iterative least square fit of the S-HIS radiance between 820 and 980 cm−1 the agreement between the observations and the simulations in that range is obviously quite good. Agreement between data and simulations (accounting for one standard deviation of the MAS data) is in fact found 25
ACPD
10, 7215–7264, 2010Combining visible and infrared radiometry and lidar
data
A. Bozzo et al.
Title Page
Abstract Introduction
Conclusions References
Tables Figures
◭ ◮
◭ ◮
Back Close
Full Screen / Esc
Printer-friendly Version
Interactive Discussion scene, represented by one standard deviation of the MAS data around the mean value.
All the simulations show a narrow overestimation region at about 1050 cm−1 due to incomplete information about the O3atmospheric profile. For wavenumber greater than
1800 cm−1 the signal is the sum of the radiation emitted at terrestrial temperatures
and of the reflected solar radiation and the influence of the latter is evident in the 5
spectral ranges where the brightness temperature is higher than that observed in the IR window. LBLMS underestimates MAS in the red and green sectors between 2000 and 2200 cm−1, while overestimates in the blue sector between 2300 and 2700 cm−1
The SW upwelling radiance computed by LBLMS for the three cloudy sectors (Fig. 11, and top panel of Fig. 14) show a strong underestimation with respect to MAS. The dif-10
ference between LBLMS and MAS for the thick cloud is between 20 to 45% and the difference for the thin cloud is between 25 to 55% relative to MAS. A large underesti-mation is also seen in the NIR range (Fig. 12 and middle panel of Fig. 14), in all sectors at all wavelengths, ranging from 50 to 60%.
Small particles are strong scatterers of solar radiation, though they bring small con-15
tribution to the total PSD’s mass and one could imagine that one of the causes of the radiance underestimation is due to an improper treatment of the PSD in the small particle range.
There is in fact much discussion on the role of small ice particles (whose effective diameter is smaller than about 50 to 60 µm) and on the physical mechanisms that pro-20
duce and eventually maintain these particles inside cirrus clouds. Jensen et al. (2009) report on new aircraft measurements in anvil cirrus sampled during the Tropical Com-position, Cloud, and Climate Coupling (TC4) campaign with the 2-Dimensional Stereo (2D-S) probe, which can detect particles as small as 10 µm. They suggest that micro-physical measurements in tropical cirrus clouds obtained with the CAS (Cloud Aerosol 25
ACPD
10, 7215–7264, 2010Combining visible and infrared radiometry and lidar
data
A. Bozzo et al.
Title Page
Abstract Introduction
Conclusions References
Tables Figures
◭ ◮
◭ ◮
Back Close
Full Screen / Esc
Printer-friendly Version
Interactive Discussion play a significant role in the radiative properties of other types of cirrus, such as anvils
generated by continental convection, mid-latitude cirrus, or even anvil cirrus in other tropical regions. They also point out that small particles could persist in uppermost tropical tropopause which is often saturated with respect to ice.
We performed various simulations assuming PSD with over- and under- exponential 5
gamma types, both for the retrieval of the cloud optical depth and effective diameter and in the forward simulations. These tests, considering all spectral ranges from SW to IR, do not show any notable improvement on the results already presented since the observed underestimation in our simulation would be reduced only with the inclusion of a number of small particles that would definitely worsen the results in the IR range. 10
We also did tests using different PSDs, each composed of single ice habits (i.e. hollow columns, bullet rosettes, aggregates and plates), but the conclusion we reached were very similar to the one documented in the present study. Some of these sensitive studies can be found at Rizzi et al. (2007).
4.3 A MODIS case study: a cross check for the LBLMS results in the SW and
15
NIR
The MODerate resolution Imaging Spectroradiometer (MODIS) is on-board the NASA polar orbiting Satellites TERRA (EOS AM) and AQUA (EOS PM) (NASA-GSFC, cited 2008).
The scene over the Indian Ocean, observed by MODIS on Terra the 19 January 2009 20
(granule MOD021KM.A2009019.0320.005.2009019145552), is characterised by a large cirrus located SW of Australia, extending between latitude 40 and 45◦(see Fig. 15).
The MODIS cloud mask ensures the ice phase of the cloud. Only pixels with OT much larger than 1 are considered, in order to minimise the influence of the surface properties and of the atmospheric profile below the cloud layer, given the difficulty to 25
ACPD
10, 7215–7264, 2010Combining visible and infrared radiometry and lidar
data
A. Bozzo et al.
Title Page
Abstract Introduction
Conclusions References
Tables Figures
◭ ◮
◭ ◮
Back Close
Full Screen / Esc
Printer-friendly Version
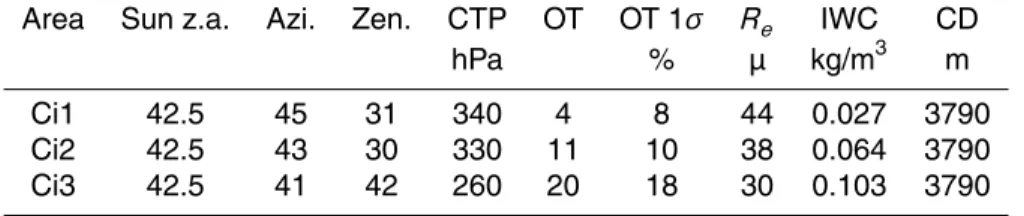
Interactive Discussion The relevant parameters of the three areas and the retrieved properties from MODIS,
used for the LBLMS computations, are summarised in Table 5, where the effective diameter is defined asDe=2Re and decreases as the cloud OT increases.
The columns labelled “Sun z.a”, “Azi” and “Zen” provide the mean values of the solar zenith angles, and of the azimuth and zenith observation angles used for the LBLMS 5
computations. All theDe values are quite similar to theDeused in the PTH simulation, hence the balance of the various components of the mixture MIXML and the PSD are compatible with the one used in the previous section. The column labelled OT 1σ
is the error estimate of the OT as given in the MODIS file, and it is understood to be comprehensive of all sources of errors in the retrieval of all parameters that are required 10
to the determination of the OT: cloud top level, cloud phase and effective radius. The database of ice crystals optical properties are SSP-SW and SSP-IR, same used for the simulations of the PTH case. The standard mid latitude summer profile (Ander-son et al., 1986) is used as input to LBLMS, with a surface wind of 5 m/s and an ocean pigment concentration of 0.07 mg/m3. Since cloud base height is not a MODIS 15
standard product, a cloud geometrical thickness of 3790 m has been assumed with a homogeneous IWC vertical distribution.
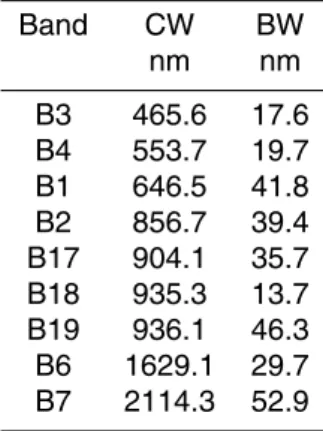
The test is done in 9 MODIS bands located in the SW and NIR, defined in Table 5. The results in the IR range would have been difficult to interpret due to the strong dependence of radiance on the accurate reconstruction of the temperature profile and 20
of cloud top height and thickness.
LBLMS computation are done using same technical choices already discussed, in the spectral ranges that cover the MODIS Terra Relative Spectral Response (RSR) for the selected MODIS bands. These RSR are computed as the average (over all channels) of the individual L1B in-band RSRs, that are available from the MODIS 25
ACPD
10, 7215–7264, 2010Combining visible and infrared radiometry and lidar
data
A. Bozzo et al.
Title Page
Abstract Introduction
Conclusions References
Tables Figures
◭ ◮
◭ ◮
Back Close
Full Screen / Esc
Printer-friendly Version
Interactive Discussion In these figures the upper panels are radiance differences and the lower panels
are the fractional radiance differences (expressed as percentage) that coincide with fractional reflectance differences. The blue bars denote the (2σ) variability around the mean measured radiance, that corresponds to same retrieved OT ( andRe), but slightly different Sun zenith angles and observation angles among the pixels whose radiance 5
is averaged.
Band-2 located at 856.7 nm is currently used for the retrieval of the cloud OT above the ocean (King et al., 1997) and the simulations are very close to measurements at this wavelength. This result would be quite obvious were the same procedure used for the forward and inverse computations. In the present case the result is not obvious 10
and in fact it demonstrates that the inverse (MODIS processing) and forward (LBLMS computations) procedures (single-scattering databases and PSDs) are compatible.
As we move to shorter wavelength some degradation is observed which is always within the stated 2σ uncertainty level, except for Band-3 in Area Ci1, the case of least opacity, where LBLMS overestimates the measured radiance by 20%. In all the cases 15
under study LBLMS overestimates the radiance measured in Bands-6 and 7, which are used to retrieve the effective radius. Although the relatively large relative discrepancies (lower panels) are associated to low radiance values, still they indicate that some of the assumptions on which the LBLMS simulations are based are different from the one used in MODIS retrievals; or that, perhaps,Re retrieved from band 7 is representative 20
of the top-to-middle part of the cloud and some of the difference could be related to inhomogeneous vertical distribution of particle sizes. We have no firm explanation of this discrepancy and further work is necessary.
5 Summary and conclusions
Measurements taken during the 2003 Pacific THORPEX Observing System Test by 25
ACPD
10, 7215–7264, 2010Combining visible and infrared radiometry and lidar
data
A. Bozzo et al.
Title Page
Abstract Introduction
Conclusions References
Tables Figures
◭ ◮
◭ ◮
Back Close
Full Screen / Esc
Printer-friendly Version
Interactive Discussion a line-by-line and multiple scattering modeling methodology (LBLMS). The extension
of LBLMS to the visible and near infrared and the treatment of the bi-directional re-flectance properties of the marine surface are discussed. A number of scenes are evaluated: two clear scenes, one with nadir geometry and one cross-track encompass-ing sun glint, and three cloudy scenes, all with nadir geometry. CPL data is used to 5
estimate the particulate optical depth at 532 nm for the clear and cloudy scenes. Cloud optical depth is also retrieved from S-HIS infrared window radiances, and compares well to CPL values. MAS data is simulated convolving high resolution radiances.
The paper discusses the results of the comparisons for the clear cases and for the three cloudy cases. The main (problematic) result is that the simulations in cloudy sky 10
conditions, using cloud parameters retrieved from infrared radiances, systematically underestimate the measured radiance in the visible and near infrared by nearly 50%, while cloud optical depths retrieved from infrared data agree, to within natural variability, with those derived from the lidar.
In order to understand the cause for the observed discrepancies, MODIS radiances 15
measured from Terra are also compared to LBLMS simulations in cloudy conditions using retrieved cloud optical depth and effective radius from MODIS. Three case stud-ies are selected corresponding to cloud decks of various opacity and the attention is focused on SW MODIS bands. The relative differences are lower than ±10% except for B3 for the least opaque cloud where the difference is+18%.
20
The paper provides evidence that 1) LBLMS simulations in clear conditions are close to (PTH) MAS measurements over the oceanic surface, under a number of diverse viewing geometries; 2) LBLMS simulations in cloudy conditions strongly underestimate MAS radiances in the SW and NIR when cloud parameters are derived from infrared retrievals or lidar measurements; 3) LBLMS simulations are in good agreement with 25
ACPD
10, 7215–7264, 2010Combining visible and infrared radiometry and lidar
data
A. Bozzo et al.
Title Page
Abstract Introduction
Conclusions References
Tables Figures
◭ ◮
◭ ◮
Back Close
Full Screen / Esc
Printer-friendly Version
Interactive Discussion The main difference between the results 2) and 3), presented in Sects. 4.2 and 4.3,
is that in the former the cloud properties used for the radiance simulation are retrieved from hyper spectral S-HIS measurements in the main IR window, while in the latter they are retrieved from MODIS short wave channels. The two retrieval types sense different properties to derive their product: the MODIS retrieval uses scattered radiation and a 5
realistic description of the phase function is thus fundamental. On the other hand RT-RET uses emitted and scattered radiation to infer the extinction OT. In this last case, scattering is a small fraction of the total signal observed, although it must, and is, fully accounted for by RT-RET. It is therefore expected that best results in the PTH cloudy case study are to be obtained in the IR, while we have found that the best results in the 10
MODIS case study are at wavelengths closest to the one used for the retrieval, i.e. at 856.7 nm.
The retrieval of optical thickness from lidar systems exploits shortwave (scattered) radiation, but generally no assumptions on the phase function is required in the retrieval procedure. Several studies in fact have shown that infrared retrieved optical depths well 15
agree with lidar OT (e.g. Maestri and Holz, 2009; Turner and Eloranta, 2008; DeSlover et al., 2003). In our study the good agreement between CPL OT and RT-RET OT im-plies that the angularly integrated properties (coefficients of scattering and extinction) are indeed coherent going from infrared to the short wave.
Hence the strong radiance (hence reflectance) underestimation in the SW and NIR 20
obtained in the PTH case studies seems likely caused by the structure of the phase function in the short-wave and the infrared domain. We have taken the utmost care to reconstruct the phase function as originally computed and distributed, therefore the problem lies in some lack of coherence between the original phase function as provided in SSP-SW and SSP-IR.
25
ACPD
10, 7215–7264, 2010Combining visible and infrared radiometry and lidar
data
A. Bozzo et al.
Title Page
Abstract Introduction
Conclusions References
Tables Figures
◭ ◮
◭ ◮
Back Close
Full Screen / Esc
Printer-friendly Version
Interactive Discussion the simulated reflectance in the 1.38 µm channel and a strong underestimation of the
brightness temperature in all IR channels. The discrepancy found in the IR channels, when the cloud optical properties are retrieved in the SW range, resembles the results from our PTH case study. In Ham et al. (2009) it is pointed out that a possible expla-nation (page 1603) could be an incorrect retrieval of the actual cloud top, leading to 5
errors in the positioning in the profile and hence in the emission temperature, but the cloud optical properties could also play a not negligible role. In our PTH case study a measurement of cloud top height is available, while it was decided not to model MODIS IR channels, for reasons explained in the main text.
The causes of our problematic results could be multiple and the authors do not have 10
the practical knowledge required to master the fine details of the computations that were required to generate the SSP-SW and SSP-IR databases. The use, in the two spectral ranges, of different methodologies to compute the volume and projected area, that define the geometry of an ice particle of same maximum dimension, could be one of the reasons for the observed discrepancies. A lot of effort is spent in improving the 15
optical properties of ice crystals: the effect of the inclusion of air bubbles inside ice particles is being studied (Xie et al., 2009) as well as changes to surface texture (Yang et al., 2008b) and roughness (Yang et al., 2008a).
In Zhang et al. (2009) it is shown that ice clouds OT inferred from POLDER are substantially smaller than the one inferred from collocated MODIS data, and it is stated 20
that this difference is due to the use of different ice particle scattering models and specifically to the different scattering phase functions. Our results are along the same line, but using a different dataset and simulation methodology. In the conclusion section of Zhang et al. (2009) it is suggested that a set of existing or newly developed ice particle models should be used as the common basis to derive climatologies from 25
ACPD
10, 7215–7264, 2010Combining visible and infrared radiometry and lidar
data
A. Bozzo et al.
Title Page
Abstract Introduction
Conclusions References
Tables Figures
◭ ◮
◭ ◮
Back Close
Full Screen / Esc
Printer-friendly Version
Interactive Discussion the first and most important step is to generate a database of ice particle properties
that describes consistently the cloud features that are observed from the SW to the IR.
Acknowledgements. Thanks to Enrico Rossi for his decisive contribution to the parallelisation
of the LBLMS code.
References
5
Amorati, R. and Rizzi, R.: Radiances simulated in the presence of clouds by use of a fast radiative transfer model and a multiple-scattering scheme, Appl. Optics, 41, 1604–1614, 2002. 7218
Anderson, G. P., Clough, S. A., Kneizys, F. X., Chetwynd, J. H., and Shettle, E. P.: AFGL Atmospheric constituent profiles (0–120 km), Tech. rep., Air Force Geophysics Laboratory,
10
Optical Physics Division, Hanscom AFB, aFGL-TR 86-0110, 1986. 7225, 7234
Baran, A. J.: A review of the light scattering properties of cirrus, J. Quant. Spectrosc. Ra., 110, 1239–1260, 2009. 7217
Baum, B. A., Heymsfield, A. J., Yang, P., and Bedka, S.: Bulk scattering properties for the remote sensing of ice clouds. Part I: Microphysical data and models, J. Appl. Meteorol., 44,
15
1885–1895, 2005. 7223
Bozzo, A.: Atmospheric radiative transfer in multiple scattering conditions. Application to NWP models, Ph.D. thesis, University of Bologna, Bologna, 2009. 7222, 7227
Bozzo, A., Maestri, T., Rizzi, R., and Tosi, E.: Parameterization of single scattering properties of mid-latitude cirrus clouds for fast radiative transfer models using particle mixtures, Geophys.
20
Res. Lett. 35, l16809, doi:10.1029/2008GL034695, 2008. 7222
Clough, S. A. and Iacono, M. J.: Line-by-line calculations of atmospheric fluxes and cooling rates II: Application to carbon dioxide, ozone, methane, nitrous oxide, and the halocarbons, J. Geophys. Res., 100, 519–535, 1995. 7221
Clough, S. A., Shephard, M. W., Mlawer, E. J., Delamere, J. S., Iacono, M. J., Cady-Pereira, K.,
25
Boukabara, S., and Brown, P. D.: Atmospheric radiative transfer modeling: a summary of the AER codes, J. Quant. Spectrosc. Ra., 91, 233–244, 2005. 7221
ACPD
10, 7215–7264, 2010Combining visible and infrared radiometry and lidar
data
A. Bozzo et al.
Title Page
Abstract Introduction
Conclusions References
Tables Figures
◭ ◮
◭ ◮
Back Close
Full Screen / Esc
Printer-friendly Version
Interactive Discussion
DeSlover, D. H., Turner, D. D., Whiteman, D. N., and Smith, W. L.: Ground-based measurement of cirrus cloud optical properties as validation to aircraft- and satellite-based cloud studies, Proc. SPIE, http://link.aip.org/link/?PSI/4882/205/1, 4882, 205–211, doi:10.1117/12.462372, 2003. 7237
Evans, K. F. and Stephens, G. L.: A new polarized atmospheric transfer model, J. Quant.
5
Spectrosc. Ra., 46, 412–423, 1991. 7221
Ham, S. H., Sohn, B. J., Yang, P., and Baum, B. A.: Assessment of the quality of MODIS cloud products from radiance simulations, J. Appl. Meteorol. Clim., 110, 1591–1612, doi: 10.1175/2009JAMC2121.1, 2009. 7217, 7237, 7238
Hess, M., Koepke, P., and Schult, I.: Optical properties of aerosols and clouds: The software
10
package OPAC, Bull. Am. Meteorol. Soc., 79, 831–844, 1998. 7222, 7225
Jensen, E. J., Lawson, P., Baker, B., Pilson, B., Mo, Q., Heymsfield, A. J., Bansemer, A., Bui, T. P., McGill, M., Hlavka, D., Heymsfield, G., Platnick, S., Arnold, G. T., and Tanelli, S.: On the importance of small ice crystals in tropical anvil cirrus, Atmos. Chem. Phys., 9, 5519–5537, 2009,
15
http://www.atmos-chem-phys.net/9/5519/2009/. 7232
Johnson, B. C., Fowler, J. B., and Cromer, C. L.: The SeaWiFS Transfer Radiometer (SXR), Tech. rep., edited by: Hooker, S. B. and Firestone, E. R., NASA Goddard Space Flight Center, Greenbelt, Maryland, NASA Tech. Memo. 1998–206892, Vol. 1, 1998. 7225
King, M. D., Menzel, W. P., Grant, P. S., Myers, J. S., Arnold, G. T., Platnick, S. E., Gumley,
20
L. E., Tsay, S.-C., Moeller, C. C., Fitzgerlad, M., Brown, K. S., and Osterwisch, F. G.: Air-borne scanning spectrometer for remote sensing of cloud, aerosol, water vapor, and surface properties, J. Atmos. Oceanic Technol., 13, 777–794, 1996. 7219
King, M. D., Tsay, S. C., Platnick, S. E., Wang, M., and Liou, K. N.: MODIS Algorithm Theoret-ical Basis Document, No. ATBD-MOD-05 MOD06 Cloud product, Tech. rep., NASA MODIS
25
Science Team, 1997. 7235
Lawson, R. P., Baker, B. A., Pilson, B., and Mo, Q.: In situ observations of the microphysical properties of wave, cirrus, and anvil clouds. Part II: Cirrus clouds, J. Atmos. Sci., 63, 3186– 3203, 2006. 7222
Maestri, T. and Holz, R. E.: Retrieval of cloud optical properties from multiple infrared
hyper-30
ACPD
10, 7215–7264, 2010Combining visible and infrared radiometry and lidar
data
A. Bozzo et al.
Title Page
Abstract Introduction
Conclusions References
Tables Figures
◭ ◮
◭ ◮
Back Close
Full Screen / Esc
Printer-friendly Version
Interactive Discussion
Maestri, T. and Rizzi, R.: A study of infrared diabatic forcing of ice clouds in the tropical atmo-sphere, J. Geophys. Res, 108, 4139–4154, 2003. 7218
Maestri, T., Rizzi, R., and Smith, J. A.: Spectral infrared analysis of a cirrus cloud based on Airborne Research Interferometer Evaluation System(ARIES) measurements, J. Geophys. Res.-Atmos., 110, D06111, doi:10.1029/2004JD005098, 2005. 7218
5
Maestri, T., Di Girolamo, P., Summa, D., and Rizzi, R.: Clear and cloudy sky investigations using RAMAN Lidar and airborne interferometric measures from the European AQUA Ther-modynamic Experiment, Atmos. Res., in review, 2010. 7222, 7223
Masuda, K., Takashima, T., and Takayama, Y.: Emissivity of pure and sea waters for the model sea surface in the infrared window regions, Remote Sens. Environ., 24, 313–329, 1988.
10
7221
McGill, M. J., Hlavka, D. L., Hart, W. D., Scott, V. S., Spinhirne, J. D., and Schmid, B.: The Cloud Physics Lidar: instrument description and initial measurement results, Appl. Opt., 41, 3725–3734, 2002. 7219
Moeller, C. C., Revercomb, H. E., Ackerman, S. A., Menzel, W. P., and Knuteson, R. O.:
Evalu-15
ation of MODIS thermal IR band L1B radiances during SAFARI 2000, J. Geophys. Res., 108, 1–12, 2003. 7220
NASA: MAS, available online at: http://mas.arc.nasa.gov/, last access: March 2010, 2008. 7222
NASA-GSFC: MODIS, available online at: http://modis.gsfc.nasa.gov/, last access: March
20
2010, 2008. 7233
Potter, J. F.: The delta function approximation in radiative transfer theory, J. Atmos. Sci., 27, 943–949, 1970. 7223
Revercomb, H. E., Walden, V. P., Tobin, D. C., Anderson, J., Best, F., Ciganovich, N. C., Dedecker, R. G., Dirkx, T., Ellington, S. C., Garcia, R. K., Herbsleb, R., Knuteson, R. O.,
25
LaPorte, D., McRae, D., and Werner, M.: Recent Results From Two New Aircraft-Based Fourier-Transform Interferometers: The Scanning High-resolution Interferometer Sounder and the NPOESS Atmospheric Sounder Testbed Interferometer, in: ASSFTS Conference, Toulouse, France, 1998. 7219
Rizzi, R. and Maestri, T.: Some considerations on far infrared emission in presence of clouds,
30
J. Geophys. Res, 108, 4403–4408, 2003. 7218
ACPD
10, 7215–7264, 2010Combining visible and infrared radiometry and lidar
data
A. Bozzo et al.
Title Page
Abstract Introduction
Conclusions References
Tables Figures
◭ ◮
◭ ◮
Back Close
Full Screen / Esc
Printer-friendly Version
Interactive Discussion
Rizzi, R., Maestri, T., and Bozzo, A.: Reference tool for simulation of VIS/NIR spectral radi-ances, Tech. rep., http://www.eumetsat.int/, EUMETSAT Contract EUM/CO/06/1529/PS, last access: March 2010, 2007. 7233
Rothman, L. S., Jacquemart, D., Barbe, A., Chris Benner, D., Birk, M., Brown, L. R., Carleer, M. R., Chackerian, C., Chance, K., Coudert, L. H., et al.: The HITRAN 2004 molecular
5
spectroscopic database, J. Quant. Spectrosc. Ra., 96, 139–204, 2005. 7221
Takano, Y. and Liou, K. N.: Solar radiative transfer in cirrus clouds. Part I: Theory and compu-tation of multiple scattering in anisotropic medium, J. Atmos. Sci., 46, 20–36, 1988. 7223 Tjemkes, S. A., Patterson, T., Rizzi, R., Shephard, M. W., Clough, S. A., Matricardi, M., Haigh,
J. D., H ¨opfner, M., Payan, S., Trotsenko, A., Scott, N., Rayer, P., Taylor, J., Clerbaux, C.,
10
Strow, L. L., DeSouza-Machado, S., Tobin, D., and Knuteson, R.: The ISSWG line-by-line inter-comparison experiment, J. Quant. Spectrosc. Ra., 77, 433–453, 2003. 7218
Turner, D. D. and Eloranta, E. W.: Validating mixed-phase cloud optical depth retrieved from infrared observations with high spectral resolution lidar, IEEE Geosci. Remote Sens., 5, 285–288, doi:10.1109/LGRS.2008.915940, 2008. 7237
15
Vermote, E. F., Tanr ´e, D., Deuz ´e, J. L., Herman, M., Morcrette, J. J., and Kotchenova, S. Y.: Second Simulation of a Satellite Signal in the Solar Spectrum-Vector (6SV), available at: http://6s.ltdri.org, last access: March 2010, 2006. 7222
Wendisch, M., Pilewskie, P., Pommier, J., Howard, S., Yang, P., Heymsfield, A. J., Schmitt, C. G., Baumgardner, D., and Mayer, B.: Impact of cirrus crystal shape on solar
spec-20
tral irradiance: A case study for subtropical cirrus, J. Geophys. Res., 110, d03202, doi:10.1029/2004JD005294, 2005. 7222
Wyser, K.: Ice crystal habits and solar radiation, Tellus A, 51, 937–950, 1999. 7222
Xie, Y., Yang, P., Kattawar, G. W., Minnis, P., and Hu, Y. X.: Effect of the inhomogeneity of ice crystals on retrieving ice cloud optical thickness and effective particle size, J. Geophys. Res,
25
114, D11203, doi:10.1029/2008JD011216, 2009. 7238
Yang, P. and Liou, K. N.: Single scattering properties of complex ice crystals in terrestrial atmosphere, Contrib. Atmos. Phys., 71, 223–248, 1998. 7222
Yang, P., Wei, H., Huang, H.-L., Baum, B. A., Hu, Y. X., Kattawar, G. W., Mishchenko, M. I., and Fu, Q.: Scattering and absorption property database for non-spherical ice particles in
30
ACPD
10, 7215–7264, 2010Combining visible and infrared radiometry and lidar
data
A. Bozzo et al.
Title Page
Abstract Introduction
Conclusions References
Tables Figures
◭ ◮
◭ ◮
Back Close
Full Screen / Esc
Printer-friendly Version
Interactive Discussion
Yang, P., Zhang, L., Hong, G., Nasiri, S. L., Baum, B. A., Huang, H., King, M. D., and Platnick, S. E.: Differences Between Collection 4 and 5 MODIS Ice Cloud Optical/Microphysical Prod-ucts and Their Impact on Radiative Forcing Simulations, IEEE T. Geosci. Remote, 45, 2886, doi:10.1109/TGRS.2007.898276, 2007. 7217
Yang, P., Hong, G., Kattawar, G. W., Minnis, P., and Hu, Y.: Uncertainties Associated With the
5
Surface Texture of Ice Particles in Satellite-Based Retrieval of Cirrus Clouds: Part II–Effect of Particle Surface Roughness on Retrieved Cloud Optical Thickness, IEEE T. Geosci. Remote, 46, 1948–1957, 2008a. 7238
Yang, P., Kattawar, G. W., Hong, G., Minnis, P., and Hu, Y.: Uncertainties Associated With the Surface Texture of Ice Particles in Satellite-Based Retrieval of Cirrus Clouds–Part I:
Single-10
Scattering Properties of Ice Crystals With Surface Roughness, IEEE T. Geosci. Remote, 46, 1940–1947, 2008b. 7238
Zhang, Z., Yang, P., Kattawar, G., Riedi, J., -Labonnote, L. C., Baum, B. A., Platnick, S., and Huang, H.-L.: Influence of ice particle model on satellite ice cloud retrieval: lessons learned from MODIS and POLDER cloud product comparison, Atmos. Chem. Phys., 9, 7115–7129,
15
2009,
ACPD
10, 7215–7264, 2010Combining visible and infrared radiometry and lidar
data
A. Bozzo et al.
Title Page
Abstract Introduction
Conclusions References
Tables Figures
◭ ◮
◭ ◮
Back Close
Full Screen / Esc
Printer-friendly Version
Interactive Discussion Table 1. Characteristics of the 3 cloudy sectors used for the comparisons. CPL OT is optical
thickness measured by CPL at 532 nm and CPL OT 1σis the standard deviation of measured CPL OT in each sector; RT-RET OT and effective diameter (De) are retrieved from S-HIS data averaged in each sector; CLT and CLB are cloud top and bottom height obtained from CPL.
Case CPL OT CPL OT RT-RET OT RT-RET OT De CLT CLB 532 nm 1σ 532 nm 1000 cm−1
µm km km
Sector 1 0.56 0.3 0.57 0.53 68 11.6 9.7
Sector 2 0.91 0.4 1.02 0.95 64 11.9 9.8
ACPD
10, 7215–7264, 2010Combining visible and infrared radiometry and lidar
data
A. Bozzo et al.
Title Page
Abstract Introduction
Conclusions References
Tables Figures
◭ ◮
◭ ◮
Back Close
Full Screen / Esc
Printer-friendly Version
Interactive Discussion Table 2.Relevant parameters and retrieved cloud properties for the three areas selected for the
MODIS case studies (the name is defined in column one) over the cirrus cloud of Fig. 15. SUN z.a. is the solar zenith angle; Azi. and Zen. are the azimuth and zenith observation angles; CTP, OT andRe are the MODIS retrieved cloud top pressure, optical thickness and effective radius; OT 1σ is estimated error on OT. IWC is cloud ice water content and CD is assumed cloud layer depth.
Area Sun z.a. Azi. Zen. CTP OT OT 1σ Re IWC CD
hPa % µ kg/m3 m
Ci1 42.5 45 31 340 4 8 44 0.027 3790
Ci2 42.5 43 30 330 11 10 38 0.064 3790
ACPD
10, 7215–7264, 2010Combining visible and infrared radiometry and lidar
data
A. Bozzo et al.
Title Page
Abstract Introduction
Conclusions References
Tables Figures
◭ ◮
◭ ◮
Back Close
Full Screen / Esc
Printer-friendly Version
Interactive Discussion Table 3. MODIS bands used for the comparison, listed for increasing wavelength. BW is the
bandwidth defined by the 1% points in the L1B in-band RSR.
Band CW BW
nm nm
ACPD
10, 7215–7264, 2010Combining visible and infrared radiometry and lidar
data
A. Bozzo et al.
Title Page
Abstract Introduction
Conclusions References
Tables Figures
◭ ◮
◭ ◮
Back Close
Full Screen / Esc
Printer-friendly Version
Interactive Discussion Fig. 1. GOES-10 visible channel image, 23 February 2003. ER-2 route and the drop-sondes
ACPD
10, 7215–7264, 2010Combining visible and infrared radiometry and lidar
data
A. Bozzo et al.
Title Page
Abstract Introduction
Conclusions References
Tables Figures
◭ ◮
◭ ◮
Back Close
Full Screen / Esc
Printer-friendly Version
Interactive Discussion Fig. 2. MAS imagery on Pacific Ocean SE from Hawaiian Islands on 22 February 2003, from
ACPD
10, 7215–7264, 2010Combining visible and infrared radiometry and lidar
data
A. Bozzo et al.
Title Page
Abstract Introduction
Conclusions References
Tables Figures
◭ ◮
◭ ◮
Back Close
Full Screen / Esc
Printer-friendly Version
Interactive Discussion
0.5 0.55 0.6 0.65 0.7 0.75 0.8 0.85 0.9 0.95
0 20 40 60
lungh. onda µm
radiance W/
µ
m m
2 sr
MAS LBLMS
1.6 1.7 1.8 1.9 2 2.1 2.2 2.3 2.4
0 1 2
lungh. onda µm
radiance W/
µ
m m
2 sr
800 1000 1200 1400 1600 1800 2000 2200 2400 2600 2800 220
240 260 280 300
wavenumber cm−1
brightness temperature K