www.atmos-meas-tech.net/9/3193/2016/ doi:10.5194/amt-9-3193-2016
© Author(s) 2016. CC Attribution 3.0 License.
Comparison of MODIS and VIIRS cloud properties with ARM
ground-based observations over Finland
Moa K. Sporre1, Ewan J. O’Connor2,3, Nina Håkansson4, Anke Thoss4, Erik Swietlicki1, and Tuukka Petäjä5 1Department of Physics, Lund University, Lund, Sweden
2Department of Meteorology, University of Reading, Reading, UK 3Finnish Meteorological Institute, Helsinki, Finland
4Swedish Meteorological and Hydrological Institute, Norrköping, Sweden 5Department of Physics, University of Helsinki, Helsinki, Finland
Correspondence to:Moa K. Sporre (moa.sporre@nuclear.lu.se)
Received: 27 January 2016 – Published in Atmos. Meas. Tech. Discuss.: 16 February 2016 Revised: 28 June 2016 – Accepted: 29 June 2016 – Published: 21 July 2016
Abstract. Cloud retrievals from the Moderate Resolution Imaging Spectroradiometer (MODIS) instruments aboard the satellites Terra and Aqua and the Visible Infrared Imag-ing Radiometer Suite (VIIRS) instrument aboard the Suomi-NPP satellite are evaluated using a combination of ground-based instruments providing vertical profiles of clouds. The ground-based measurements are obtained from the Atmo-spheric Radiation Measurement (ARM) programme mobile facility, which was deployed in Hyytiälä, Finland, between February and September 2014 for the Biogenic Aerosols – Effects on Clouds and Climate (BAECC) campaign. The satellite cloud parameters cloud top height (CTH) and liq-uid water path (LWP) are compared with ground-based CTH obtained from a cloud mask created using lidar and radar data and LWP acquired from a multi-channel microwave ra-diometer. Clouds from all altitudes in the atmosphere are in-vestigated. The clouds are diagnosed as single or multiple layer using the ground-based cloud mask. For single-layer clouds, satellites overestimated CTH by 326 m (14 %) on av-erage. When including multilayer clouds, satellites underes-timated CTH by on average 169 m (5.8 %). MODIS collec-tion 6 overestimated LWP by on average 13 g m−2(11 %).
Interestingly, LWP for MODIS collection 5.1 is slightly over-estimated by Aqua (4.56 %) but is underover-estimated by Terra (14.3 %). This underestimation may be attributed to a known issue with a drift in the reflectance bands of the MODIS in-strument on Terra. This evaluation indicates that the satellite cloud parameters selected show reasonable agreement with their ground-based counterparts over Finland, with minimal
influence from the large solar zenith angle experienced by the satellites in this high-latitude location.
1 Introduction
Clouds are a very important component of the Earth’s energy budget since they contribute to a large fraction of both the re-flected shortwave radiation and absorbed longwave radiation. The magnitude and sign of the cloud impact depends on the cloud altitude, and a correct representation of the cloud dis-tribution in the vertical is crucial to obtain a good estimate of the Earth’s energy budget. One of the largest uncertain-ties in the global climate models used to predict the future climate is the representation of clouds, their feedbacks and their interaction with short- and longwave radiation (Dolinar et al., 2015; IPCC, 2013). Satellite cloud retrievals provide cloud distributions on a global scale, which are used to assess global climate models (e.g. Dolinar et al., 2015). It is there-fore of great importance to evaluate the satellite-retrieved cloud properties and investigate whether they provide an ac-curate representation of the cloud fields.
(num-ber 6) of MODIS Level 2 products was released in 2014. Several updates to the cloud product were implemented for collection 6 (hereafter C6) compared to the previous collec-tion 5.1 (hereafter C5.1). The cloud top properties are now provided at 1 km spatial resolution along with new products, such as cloud top height (CTH) (Baum et al., 2012). Further-more, the cloud optical properties have been modified, in-cluding updates of the radiative transfer model and look-up tables (Platnick et al., 2014) and the thermodynamic phase retrievals (Baum et al., 2012).
The Visible Infrared Imaging Radiometer Suite (VIIRS) is carried aboard the Suomi-NPP satellite, which has been in orbit since October 2011 (Cao et al., 2013). Suomi-NPP is also a polar-orbiting satellite, and the VIIRS sensor is simi-lar to the MODIS sensor but has higher spatial resolution in the infrared bands used for cloud height retrievals. However, VIIRS has fewer bands available for CTH retrievals. Cloud products are also available from the VIIRS sensor.
In 1989 the U.S. Department of Energy initiated the At-mospheric Radiation Measurement (ARM) programme with the purpose of providing ground-based measurements of clouds, and later of aerosols and precipitation (Ackerman and Stokes, 2003). Several long-term measurement stations were implemented containing a comprehensive suite of in situ and passive and active remote sensing instruments. These long-term stations were later complemented with three mobile fa-cilities and one aerial facility (Mather and Voyles, 2012).
ARM data have previously been used to validate satellite retrievals. Mace et al. (2005) evaluated cirrus retrievals from MODIS and Clouds and the Earth’s Radiant Energy System (CERES) using ARM data from the Southern Great Plains Site (SGP). Data from this site were also used by Dong et al. (2008), who compared ARM low-level cloud properties with CERES-MODIS (CM) retrievals. One ARM mobile fa-cility (AMF) was deployed in the Azores (Atlantic Ocean) for 18 months, and these data were compared to CM data to validate the boundary-layer cloud retrievals (Xi et al., 2014). Other researchers have also used ground-based mea-surements to evaluate MODIS (Liu et al., 2013) and CM (Yan et al., 2015) cloud property retrievals over China. MODIS cloud properties have also been evaluated with other satellite instruments such as Cloud-Aerosol Lidar with Orthogonal Polarization (CALIOP) (Holz et al., 2008) and Multi-angle Imaging Spectroradiometer (MISR) (Naud et al., 2002).
This study uses ARM data from the AMF deployment in Hyytiälä, Finland, from February 2014 to September 2014 during the Biogenic Aerosols – Effects on Clouds and Cli-mate, (BAECC) campaign (Petäjä, 2013; Petäjä et al., 2016). The AMF data are used to evaluate the CTH from MODIS and VIIRS. The liquid water path (LWP) from MODIS C5.1 and C6 is also assessed to quantify the improvement of the updated C6 product. The investigation is not restricted to any particular cloud type but rather includes clouds from all al-titudes in the atmosphere. Because the measurement site is located at a relatively high latitude, the cloud parameters can
be investigated both at high and moderately high solar zenith angles (SZAs). This is useful since satellite cloud retrievals have previously been found to be affected by SZA (Vant-Hull et al., 2007; Grosvenor and Wood, 2014). This study does not provide a complete validation of the MODIS cloud prop-erties investigated, but rather provides insights into the per-formance of the satellite cloud retrievals. These insights can be used together with previous and future studies to improve satellite representation of cloud fields.
2 Method
2.1 Comparison methods
Passive instruments on orbiting satellites have a much wider field of view but lower temporal resolution than most ground-based measurements. Therefore, care must be taken when matching satellite and ground-based measurements to per-form an inter-comparison at a given location. Here, 1 h aver-aged ground-based data centred at the satellite overpass time have been matched against satellite pixels whose centre is at maximum 15 km away from the Hyytiälä measurement sta-tion, essentially creating a circle with a diameter of 30 km around the station. Similar averaging times and areas have been used in several previous studies (Cess et al., 1996; Dong et al., 2008; Xi et al., 2014; Yan et al., 2015).
2.2 MODIS
The MODIS instrument is carried aboard the polar-orbiting satellites Terra and Aqua. Terra was launched in 1999, Aqua in 2002, and both satellites are sun-synchronous with Terra in a descending orbit (equatorial crossing 10:30 local solar time) and Aqua in an ascending orbit (equatorial crossing 13:30 local solar time). MODIS is a whisk-broom scanning radiometer that scans the entire Earth every 2 days (Platnick et al., 2003). The visible and infrared spectrum is covered by 36 bands which have spatial resolution of 250 m (2 bands), 500 m (5 bands) and 1000 m (9 bands) at nadir. The MODIS data are open access and provided as calibrated data from the wavelength bands (level 1), instantaneous geophysical prod-ucts (level 2) as well as spatially and temporally averaged geophysical products (level 3).
CTH is a new C6 level 2 cloud product produced from MODIS level 1 data. Cloud top pressure (CTP) and temper-ature were provided in C5.1, at 5 km spatial resolution. In C6 the spatial resolution of the cloud top properties has been increased to 1 km, but they are also still available at 5 km res-olution. The 1 km resolution CTH will be used in this study. For high- and mid-level clouds, CTP is retrieved from 4 spec-tral bands within the 15 µm CO2absorption region using the
CO2 slicing method (Menzel et al., 2008). The absorption
by CO2makes the atmosphere increasingly opaque at
the atmosphere. Clear-sky radiances are subtracted from ob-served radiances, and ratios of these differences are used to retrieve CTP. The method uses a top-down approach, where the ratio of the bands sensitive to clouds at the highest alti-tudes is tested first. If this does not yield a solution, the bands sensitive to clouds at progressively lower altitudes are then tested. When a solution is found, CTH is calculated from the CTP product using gridded meteorological data from the Na-tional Centers for Environmental Prediction (NCEP) Global Forecast System.
If the CO2slicing method does not return a solution for
any of the bands in the 15 µm region, CTH is derived with the infrared window approach (IRW). The IRW method retrieves the cloud top temperature from the 11 µm brightness temper-ature (BT). Tempertemper-ature inversions in the lower atmosphere can create biases in the cloud top properties, and a new tech-nique to avoid this problem over ocean areas was developed for C6. Monthly average apparent 11 µm BT lapse rates are derived from collocated MODIS 11 µm BT, CALIOP cloud heights and modelled and atmospherically corrected surface temperatures. This aims to improve the representation of the lapse rates compared to the gridded meteorological data used to obtain CTP from BT in C5.1. Hence in C6, CTP and CTH are derived from observed cloudy 11 µm BT using the zonal monthly mean lapse rates over the ocean (Baum et al., 2012). The other parameter compared in this study, LWP, is avail-able in both C6 and C5.1 cloud products at 1 km spatial res-olution. LWP is derived from two other cloud products, the cloud optical thickness (COT) and the effective radius (re),
using the formula LWP=4reCOT/3Q (re), whereQ(re)is
the extinction efficiency (King et al., 2006). This retrieval has not changed between C5.1 and C6, but modifications in the COT and re retrievals will have a direct impact on the
de-rived LWP. The changes relevant to LWP in this study are the updates of the retrieval look-up tables for COT and re;
the thermodynamic phase retrieval being improved (Platnick et al., 2014); and improvements to the multilayer cloud de-tection (Platnick et al., 2014; Wind et al., 2010). The average LWP uncertainties for the pixels used in this study are 21 % (Aqua) and 23 % (Terra) for C6 and 36 % (Aqua) and 32 % (Terra) for C5.1.
2.3 VIIRS
VIIRS Suomi-NPP is a scanning radiometer flying aboard Suomi-NPP, a satellite in a sun-synchronous ascending orbit crossing the Equator at 13:30 local time. VIIRS has 16 M-bands with a nadir resolution of 750 m and 6 I-M-bands with a resolution of 375 m at nadir. It has channels both in the in-frared and the visible region of the electromagnetic spectrum. The level 1 data used in this investigation were produced at SMHI (Swedish Meteorological and Hydrological Insti-tute) from local reception of VIIRS data. The level 2 cloud products used here were produced with the Polar Platform System (PPS) software version 2014+patch20150327
de-veloped by the Satellite Application Facility on Support to Nowcasting & Very Short Range Forecasting (NWC SAF) (http://www.nwcsaf.org). The PPS cloud top temperature and height algorithm in PPS contains two different algorithms: one for opaque clouds and one for semi-transparent or sus-pected semi-transparent clouds. The 11–12 µm brightness temperature difference (BTD) determines which algorithm is used. For opaque clouds, the 11 µm BT is compared to numerical weather prediction (NWP) temperature profiles from the European Centre for Medium-Range Weather Fore-casts (ECMWF) corrected for atmospheric absorption to es-timate height. A more complex histogram method is used for semi-transparent clouds, utilizing the variation across neigh-bouring pixels to estimate the height. The assumption that all clouds in a 32×32 square set of pixels are at the same height is used to estimate the cloud temperature. The algo-rithm fits a curve to the 11–12 µm BTD as function of the 11 µm BT for the pixels. The cloud top temperature obtained from this fit is then compared to the model forecast tem-perature profile in the same manner as for opaque clouds. More algorithm details can be found in the Algorithm The-oretical Basis Document for Cloud Top Temperature, Pres-sure and Height from NWC/PPS 1.1 Edn., 2014 (available at http://www.nwcsaf.org).
Level 1 data were only received by SMHI until the be-ginning of May 2014, and hence the VIIRS data are only available during the first 3 months of the investigation.
2.4 AMF2 Hyytiälä
From February to September 2014, AMF2 was deployed at the Station for Measuring Ecosystem – Atmosphere Re-lations (SMEAR) II station (Hari and Kulmala, 2005) in Hyytiälä, Finland. The deployment was part of a campaign called the Biogenic Aerosols Effects on Clouds and Climate (BAECC) (Petäjä, 2013; Petäjä et al., 2016), a collaboration between University of Helsinki, Finnish Meteorological In-stitute, University of Eastern Finland and ARM. AMF2 con-tains a comprehensive suite of ground-based in situ instru-mentation together with active and passive remote sensing instruments to obtain numerous atmospheric properties with very high temporal and spatial resolution.
2.4.1 Cloud top height
by this target classification. The nominal vertical and tempo-ral resolution of CTH provided from this scheme is 30 m and 30 s.
The minimum reflectivity at 10 km is about −27 dBZ, which leads to a derived ice water content of about 5× 10⁻⁶kg m−3 when using a reflectivity–temperature-based relationship (e.g. Hogan et al., 2006). This corresponds to an optical depth of about 0.01 m−1 (e.g. Heymsfield et al., 2003) with an uncertainty of about a factor of 3 when con-sidering both potential biases in reflectivity and uncertainties in the ice water content retrieval.
2.4.2 Liquid water path
LWP is obtained from the Radiometrics microwave radiome-ter, MWR, a vertically pointing passive instrument measur-ing the microwave atmospheric BT at 23.8 and 31.4 GHz. A radiative transfer model with monthly regression coefficients (Liljegren, 1999) is used to obtain column-integrated water vapour and liquid water amounts. When properly calibrated, BTs are obtained with an absolute accuracy better than 0.5 K (Maschwitz et al., 2013), which corresponds to an LWP un-certainty of about 20 g m−2. MWR retrievals are limited to non-precipitating profiles (Crewell and Löhnert, 2003) but are not affected by ice cloud optical depth. LWP in super-cooled clouds can be retrieved reliably, although LWP values may be small and close to the instrument uncertainty.
2.5 Selection criteria
For the satellite scenes to be included in the study, the CTH retrievals had to be successful for at least 50 % of the pix-els inside a 30 km circle around the measurement station. To ensure a fair comparison, homogeneity was considered and only cases where at least 90 % of all pixels were within 1000 m of the median height were included in the analysis. If these criteria were met, the geometrical average height for the clouds within the circle was calculated as this type of av-eraging was most suitable.
The LWP comparison was performed where satellite CTH was successfully retrieved for more than 50 % of the pix-els inside the circle. Furthermore, the multilayer cloud prod-uct was used to remove pixels determined to contain several layers of clouds. Moreover, only pixels determined to con-tain liquid clouds by the satellite were included in the com-parison since the ground-based ARM microwave radiome-ter measures the LWP only for liquid clouds. Only the cases where 50 % of the pixels in the circle passed every step of the screening process were included in the LWP analysis.
For ground-based data, 1 h centred on the satellite over-pass time was selected for satellite overover-passes that met the selection criteria above. Similar criteria for CTH homogene-ity were applied: at least 90 % of the CTH values were within 1000 m of the median height, and more than 50 % of the profiles contained clouds. Again, a geometrical average
CTH was calculated for cases that passed the screening. The scenes were investigated for multiple cloud layers (distinct layers separated by more than 500 m) and the fraction of multilayer clouds for each case calculated. Considering the LWP comparison, multiple cloud layers were removed from the analysis, as was performed for the satellite LWP. At least 50 % of the pixels had to contain single-layer cloud only, for a geometrical average LWP to be calculated.
3 Results and discussion
There were 871 (Aqua) and 869 (Terra) satellite overpasses at Hyytiälä during the campaign. Of these, 322 (Aqua) and 264 (Terra) passed the selection criteria for the satellite scene CTH screening. From these scenes, 181 (Aqua) and 162 (Terra) passed the corresponding ground-based selection cri-teria for inclusion in the final analysis. The number of LWP cases that passed both satellite and ground-based selection is smaller since only daytime satellite data are used. There were fewer data available for the VIIRS intercomparison, with a total of 300 potential Hyytiälä overpasses, of which 127 passed the satellite CTH screening with 52 cases also meeting the ground-based selection criteria. There were not enough VIIRS cases that passed the LWP screening to enable an intercomparison because there were only data available during the winter months of the campaign; at high latitudes this precludes the use of visible/near-IR satellite retrievals since there is not enough light. Furthermore, during the pe-riod when there was sufficient light, most of the clouds in the VIIRS satellite scenes were classified as ice and no LWP was retrieved.
3.1 Cloud top height
The CTH retrievals are compared separately for daytime and nighttime conditions, where daytime conditions are defined as those that have a low enough SZA for the optical proper-ties to be retrieved. For the MODIS retrievals, the maximum SZA for optical properties is 81.4◦(King et al., 2006) while the VIIRS algorithm has the maximum SZA of 72◦(SMHI, 2015). During February in Finland, SZAs are higher than 72◦ at the daytime overpass and hence VIIRS data are classified as nighttime while MODIS data are classified as daytime.
to-0 5000 10
Figure 1. Scatterplots of satellite cloud top heights (CTH) versus ARM cloud top heights for nighttime cases for(a) MODIS Aqua, (b)MODIS Terra and(c)VIIRS. The colouring of the markers is according to solar zenith angle (SZA). For the MODIS plots, markers in the shape of circles indicate that the IRW retrieval of CTH was used while triangles indicate that the CO2slicing method has been used.
For VIIRS, the triangles represent cases where the CTH was retrieved using the transparent method while the circles represent cases for which the opaque method was used. Open symbols represent cases where multiple cloud layers are present in the ARM data and the filled symbols represent single-layer cases. Cases where most pixels contain ice clouds have a cross drawn behind them. The lines in the figures are 1 : 1 lines.
Table 1.Median and mean differences, standard deviations of the differences, correlation coefficients andpvalues between satellite and ARM cloud top heights (CTH) for single cases and all cases during nighttime.
Satellite CTH- No. of Median (mean) SD diff Median SD diff r p ARM CTH samples diff (m) (m) diff (%) (%)
Aqua single 35 316 (−88) 2200 13 92 0.69 0.00 Aqua all 89 −219 (−733) 2000 −4.66 42 0.79 0.00 Terra single 42 407 (134) 1800 15.5 69 0.61 0.00 Terra all 73 63 (−667) 2200 2.29 78 0.67 0.00 VIIRS single 24 309 (112) 1500 10.5 51 0.9 0.00 VIIRS all 56 −150 (−718) 1800 −2.54 31 0.83 0.00
gether. Both the median and mean differences are reported in the tables for completeness. However, only the medians will be discussed since the differences were generally not nor-mally distributed and often contained outliers which signifi-cantly affected the means. Moreover, cases where more than 50 % of the pixels are classified as ice have a cross drawn behind them (Fig. 1).
Most high-level cloud scenes contain multilayered clouds (Fig. 1). Between 39 and 57 % of the nighttime cases are classified as containing single-layer clouds (Table 1). For these, the median differences are positive between 309 and 407 m (10.5–16.3 %) indicating a satellite overestimate of CTH relative to the ground-based data. When multilayered cloud cases are included, the median difference decreases for all three datasets and becomes negative for Aqua and VIIRS (Table 1). There are several plausible causes for the decrease in the median differences. One is that many high cloud cases
are classified as multilayer clouds, and CTHs for high-level clouds are often underestimated by satellites (Holz et al., 2008). Another explanation is that the satellite retrievals un-derestimate CTH when several layers of clouds are present. The satellite retrievals obtain CTH from the cloud radiating height, which corresponds to a height below the CTH, at least for optically thin clouds. This is known and corrected for, but this procedure becomes more problematic when several cloud layers are present, which may have different optical thicknesses.
Figure 1 also shows which retrieval method is selected for each cloud type. For MODIS, the CO2slicing method is
only used on high clouds while the IRW method is used for both high- and low-level clouds. The CO2slicing method is
0 5000 10000
ARM CTH (m)
0 2000 4000 6000 8000 10000 12000
Aqua CTH (m)
Daytime data
IRW CO
2 slicing
(a)
40 50 60 70 80 SZA
0 5000 10000
ARM CTH (m)
0 2000 4000 6000 8000 10000 12000
Terra CTH (m)
Daytime data
IRW CO
2 slicing
(b)
40 50 60 70 80 SZA
0 5000 10000
ARM CTH (m)
0 2000 4000 6000 8000 10000 12000
VIIRS CTH (m)
Daytime data
Opaque
Transparent
(c)
40 50 60 70 80 SZA
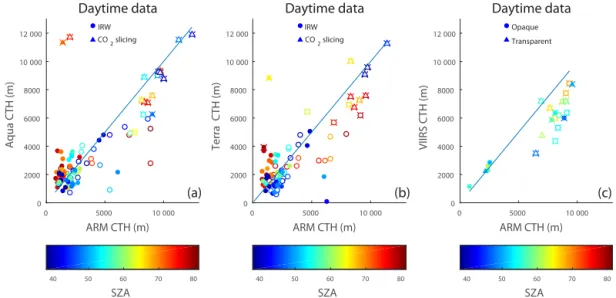
Figure 2.The same as Fig. 1 except for daytime cases.
Table 2.Same as in Table 1 except for daytime cases.
Satellite CTH- No. of Median (mean) SD diff Median SD diff r p ARM CTH samples diff (m) (m) diff (%) (%)
Aqua single 46 358 (403) 1800 19.3 99 0.35 0.02 Aqua all 92 −208 (−126) 2000 −8.92 87 0.76 0.00 Terra single 44 241 (214) 1900 13.7 107 0.03 0.87 Terra all 89 −332 (−264) 1600 −15.4 76 0.79 0.00 VIIRS single 9 −132 (−781) 1200 −4.88 45 0.98 0.00 VIIRS all 22 −1700 (−1480) 1200 −24.1 18 0.91 0.00
MODIS instrument aboard Terra. This band cannot be used in the CO2slicing algorithm, reducing the number of ratios
available to the algorithm (from 3 to 2) for finding a suc-cessful solution. In both the Terra and Aqua datasets, there is a significant group of IRW cases for which the satellite retrievals significantly underestimate CTH. This group con-tains both single- and multilayer cloud cases. Previous stud-ies (Holz et al., 2008; Naud et al., 2004) found large underes-timates of CTH when the CO2slicing method does not yield
a solution and the IRW method is used instead, particularly for optically thin cirrus. VIIRS data also display significant underestimates of CTH for high clouds (Fig. 1c). Neverthe-less, for VIIRS data, both CTH algorithms are used on clouds of varying altitude and there does not seem to be any partic-ular bias by either algorithm. The colour-coding of the cases according to SZA does not show any CTH dependency on SZA at night.
The results for the daytime CTH comparison are displayed in Fig. 2 and reported in Table 2. Approximately 50 % of the cases are single-layer clouds for all three datasets and, sim-ilar to nighttime cases, very few high clouds are defined as single-layer clouds. The Aqua (Terra) median difference be-tween the MODIS and ground-based CTH is 358 m (241 m)
for the single-layered clouds only and is reduced to−208 m (−332 m) when all cases are included – a response similar to that found for the nighttime cases. For VIIRS, the median differences are negative:−132 m for single-layer clouds and −1700 m when including multi-layer cases. For low-level clouds, CTH is very close to the 1 : 1 line but CTH for high cloud is underestimated by VIIRS. However, no general con-clusions regarding the performance of the algorithm should be drawn from this comparison since the number of daytime cases for VIIRS is low (Sect. 3).
The daytime results show a similar percentage to night-time in retrieval method selection, except that now Terra and Aqua have a similar percentage of cases where the CO2
slicing method is dominant. There are, as for the nighttime datasets, a few cases where IRW retrievals significantly un-derestimate CTH. Moreover, there are some cases in the day-time data, where satellite CTH is several thousands of me-tres higher than ground-based CTH. This may occur when thin cirrus is present over optically thick low-level clouds and only detected by satellite. Optically thin cirrus is not always detected by cloud radar and the lidar may not be able to pen-etrate through low-level clouds. The CO2slicing method is
Table 3.Median and mean differences, standard deviations of the differences, correlation coefficients andpvalues between satellite and ARM cloud top heights (CTH) for nighttime low and high cloud separately.
Satellite CTH- No. of Median (mean) SD diff Median SD diff r p ARM CTH samples diff (m) (m) diff (%) (%)
Aqua low 46 279 (234) 1200 10.7 47 0.43 0 Aqua high 43 −1290 (−1770) 2100 −16.6 26 0.47 0 Terra low 52 323 (289) 1300 13.4 53 0.29 0.03 Terra high 21 −2620 (−3040) 2100 −35.4 28 0.85 0 VIIRS low 27 468 (625) 1100 17.7 40 0.73 0 VIIRS high 29 −1820 (−1970) 1400 −24.1 19 0.61 0
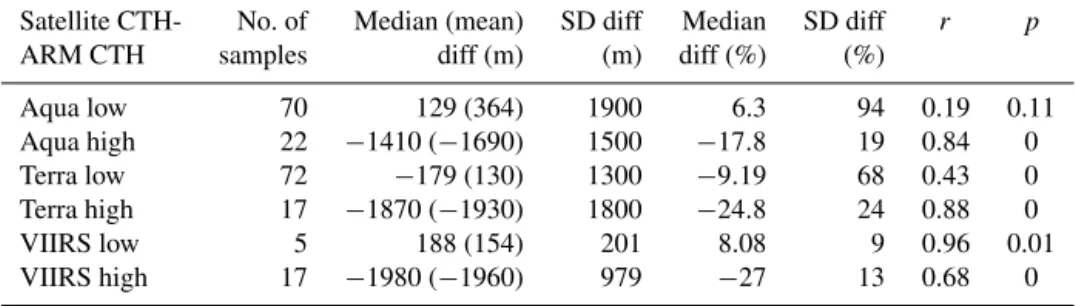
Table 4.Same as in Table 3 except for daytime cases.
Satellite CTH- No. of Median (mean) SD diff Median SD diff r p ARM CTH samples diff (m) (m) diff (%) (%)
Aqua low 70 129 (364) 1900 6.3 94 0.19 0.11 Aqua high 22 −1410 (−1690) 1500 −17.8 19 0.84 0 Terra low 72 −179 (130) 1300 −9.19 68 0.43 0 Terra high 17 −1870 (−1930) 1800 −24.8 24 0.88 0 VIIRS low 5 188 (154) 201 8.08 9 0.96 0.01 VIIRS high 17 −1980 (−1960) 979 −27 13 0.68 0
this method can successfully detect thin cirrus over low-level clouds. Another interesting feature in Fig. 2 is that MODIS CTH for single-layer low-level clouds seems to be somewhat overestimated at high SZA; all filled red-orange circles are above the 1 : 1 line (Fig. 2a and b). This is not caused by si-multaneously high viewing zenith angles of the MODIS sen-sors.
Since large errors in the CTH retrievals are a greater issue for low-level clouds than high-level clouds, we re-performed the analysis for all cases and divided them according to CTH measured from the ground with a limit between high and low clouds at 6000 m. The results are shown in Table 3 (nighttime cases) and Table 4 (daytime cases). For the low-level clouds, the CTH is overestimated by between 129 and 468 m, except for the Terra daytime cases for which the CTH is underesti-mated by 179 m. The CTH for the high-level clouds is under-estimated for all the datasets by between 1290 and 2610 m. Thus, the differences between the satellite and ground-based measurements of CTH are lower for the low-level clouds than the high-level clouds. Moreover, the CTH is generally over-estimated for low-level clouds and underover-estimated for high-level clouds, which may help explain the CTH results regard-ing sregard-ingle- and multilayer clouds.
There are, to our knowledge, no prior studies evaluating MODIS C6 CTH, but previous studies have investigated the performance of the earlier collections. Collection 4 (C4) CTP has been combined with ECMWF operational analysis pres-sure profiles and compared to ground-based radar (Naud et al., 2005) and lidar (Naud et al., 2004) data. MODIS CTH was then found to agree with radar CTH within 1 km for
mid-and high-level clouds mid-and within 3 km for low-level clouds (Naud et al., 2005). The comparison with the lidar showed somewhat smaller differences for the low-level clouds (−1.2 to 1.5 km) and larger differences for the high clouds (−1.4 to 2.7 km). These values are greater than the median differ-ences between ground-based and MODIS CTH found here, but less than the extreme values. Holz et al. (2008) combined collection 5 (C5) MODIS CTP with NCEP Global Forecast System model temperature profiles and compared the cal-culated CTH with the satellite-borne CALIOP instrument. The MODIS retrievals were found to underestimate CTH by 1.4±2.9 km and for high clouds as much as 4 km. These differences are larger than those found in this study and are likely due to the viewing directions relative to the clouds that ground-based and satellite active remote sensing instruments exhibit.
Both night- and daytime data were evaluated with respect to cloud fraction to determine the impact of this parameter. Cloud fraction does not appear to be associated with any spe-cific under-/overestimates or affect the magnitude of the dif-ferences. A few of the outliers do, however, have cloud frac-tions close to 0.5 (minimum cloud fraction, Sect. 2.5).
3.2 Liquid water path
0 100 200 300 400 500 600 700 ARM LWP (gm -2) 0
100 200 300 400 500 600 700
Aqua LWP (gm
-2 )
Collection 6
MODIS-ARM 14 gm -2, r = 0.75
(a)
40 45 50 55 60 65 70 75 80
SZA
0 100 200 300 400 500 600 700 ARM LWP (gm -2) 0
100 200 300 400 500 600 700
Terra LWP (gm
-2)
Collection 6
MODIS-ARM 12.5 gm -2, r = 0.53
(b)
40 45 50 55 60 65 70 75 80
SZA
0 100 200 300 400 500 600 700
ARM LWP (gm -2) 0
100 200 300 400 500 600 700
Aqua LWP (gm
-2 )
Collection 5.1
MODIS-ARM 5.03 gm -2, r = 0.68
(c)
40 45 50 55 60 65 70 75 80
SZA
0 100 200 300 400 500 600 700
ARM LWP (gm -2) 0
100 200 300 400 500 600 700
Terra LWP (gm
-2)
Collection 5.1
MODIS-ARM -12.1 gm -2, r = 0.75
(d)
40 45 50 55 60 65 70 75 80
SZA
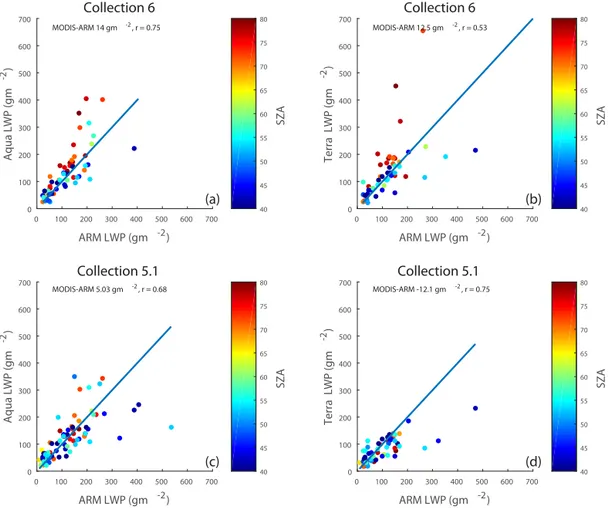
Figure 3.Scatterplots of MODIS liquid water path (LWP) versus ARM liquid water path. The two top subfigures contain data from the C6 dataset, while the bottom subfigures contain data C5.1. The colouring of the circles is according to solar zenith angle. The lines in the figures are 1 : 1 lines.
Table 5.Median and mean differences, standard deviations of the differences, correlation coefficients andp values between MODIS and ARM liquid water path (LWP).
LWP(MODIS)- No. of Median (mean) SD diff Median SD diff r p LWP(ARM) samples diff (g m−2) (g m−2) diff (%) (%)
Aqua collection 6 56 14 (15.2) 60 12 52 0.75 0.00 Terra collection 6 53 12.5 (23.8) 110 10.4 95 0.53 0.00 Aqua collection 5.1 76 5.03 (−4.96) 73 4.56 66 0.68 0.00 Terra collection 5.1 51 −12.1 (−22.6) 58 −14.3 69 0.75 0.00
C5.1. Figure 3 and Table 5 contain the results for all satel-lite scenes that passed the selection criteria, while Table 6 contains the results for the satellite scenes that passed the selection criteria for both collections, i.e. can be compared directly.
As can be seen in Table 5, there were more cases selected from C5.1 than from C6 for the Aqua data; whereas, for Terra, a similar number of cases from both collections were selected. The satellites slightly overestimate LWP for C6 rel-ative to the ground-based measurements with median differ-ences less than 12 % (Table 5). For C5.1, Aqua marginally
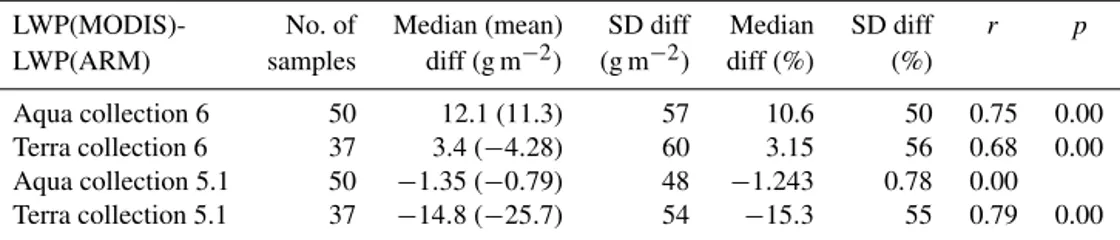
Table 6. Median and mean differences, standard deviations of the differences, correlation coefficients andp values between nighttime MODIS and ARM liquid water path (LWP). Only scenes approved in both the collection 5.1 and collection 6 screening are included in the table.
LWP(MODIS)- No. of Median (mean) SD diff Median SD diff r p LWP(ARM) samples diff (g m−2) (g m−2) diff (%) (%)
Aqua collection 6 50 12.1 (11.3) 57 10.6 50 0.75 0.00 Terra collection 6 37 3.4 (−4.28) 60 3.15 56 0.68 0.00 Aqua collection 5.1 50 −1.35 (−0.79) 48 −1.243 0.78 0.00 Terra collection 5.1 37 −14.8 (−25.7) 54 −15.3 55 0.79 0.00
For C5.1, differences in LWP from satellite and ground-based measurements do not appear to be affected by SZA (Fig. 3). For C6, however, there does appear to be some in-fluence with respect to SZA, with a possible bias towards a satellite overestimate at high SZA. A larger dataset is neces-sary to confirm if this is overestimation is systematic.
There are fewer LWP cases for the direct collection inter-comparison (Table 6). For Terra, 16 cases were classified as suitable in C6 but did not pass the selection criteria in C5, indicating that the changes in the algorithms made for C6 could have a significant impact. The change in the number of cases is likely a result of modifications in the cloud phase al-gorithm, changing how many pixels that are classified as liq-uid, but adjustments to the potential multilayer cloud flag and look-up tables will also affect which pixels pass the selection criteria. In general, the performance does improve when only cases where both collections pass the selection criteria (Ta-ble 6 compared to Ta(Ta-ble 5), except for the median difference in Terra C5.1 (the standard deviation does improve).
A previous study of LWP from MODIS C5 over China found that Terra and Aqua underestimated LWP by 43.3 and 33.6 g m−2compared to ground-based measurements (Liu et al., 2013). These values are larger than those found in this study and may result from very dissimilar meteorological conditions of the investigation sites. NASA provides a prod-uct where the MODIS data are combined with CERES data to obtain a better understanding of the connection between longwave radiation and clouds (Minnis et al., 2011), and this too has been compared to ground-based measurements. However, the CERES team uses different cloud retrieval al-gorithms to the MODIS team. A study over China found an overestimate of 30.2 g m−2for Terra CM (MODIS C5) LWP and an overestimate of 47.4 g m−2for the Aqua dataset (Yan et al., 2015). Moreover, Dong et al. (2008) compared ARM measurements at a continental US site to CM data (MODIS C4) and found an overestimate by Terra (Aqua) LWP of 0.6 g m−2 (28.1 g m−2). Over another ARM station, at the Azores, the CM (MODIS C5) LWP was underestimated by 13.5 g m−2(Xi et al., 2014). All three studies have only
in-vestigated overcast low-level clouds. Compared to the pre-vious studies the differences between the MODIS and ARM LWP in this study are quite low.
4 Conclusions
An ARM mobile facility was deployed in Hyytiälä, Finland, from February to September 2014 as part of the BAECC campaign and provided a suitable dataset for evaluating satel-lite cloud retrievals at high latitudes. Ground-based measure-ments of CTH, obtained from lidar and radar measuremeasure-ments, and LWP, from microwave radiometer measurements, are compared here to three satellite instruments: the MODIS in-struments aboard Terra and Aqua; and the VIIRS instrument aboard the Suomi-NPP satellite.
There are no restrictions on CTH but the data are divided into single- and multiple layers according to the cloud mask derived from the ground-based measurements. For single-layer clouds, MODIS CTH is, on average, 14 % higher than ground-based measurements. For multilayer clouds, how-ever, MODIS CTH is, on average, 5.8 % lower than ground-based measurements. Similar conclusions are made for the VIIRS intercomparisons during nighttime; during daytime there were not enough data to make any general conclusions, partly a result of the high-latitude location. The MODIS IRW method frequently overestimates CTH for high-level clouds. Single-layer cloud situations only were selected for the LWP intercomparison. Two different versions of MODIS products were evaluated: collections C6 and C5.1. The LWP for C6 shows an overestimate, relative to the ground-based measurements, of 14 % (12.5 %) for Aqua (Terra). For C5.1, there is a slight overestimate of LWP (< 5 %) by the MODIS instrument aboard Aqua, while Terra’s exhibits an underesti-mate of about 14 %. The underestimation by Terra in C5.1 is most likely caused by a known drift in the reflectance chan-nels, which has been corrected for in C6. Good agreement is shown between satellite and ground-based data for LWP below 200 g m−2, but there is less agreement for LWP above this value.
cloud parameters investigated here. Additional evaluations of satellite cloud products performed across the globe will be necessary to draw more general conclusions regarding the performance of the investigated satellite cloud products.
5 Data availability
The data from the MODIS sensors were provided by the US National Aeronautics and Space Agency through the Level 1 and Atmosphere Archive Distribu-tion System: doi:10.5067/MODIS/MOD06_L2.006 (Terra) doi:10.5067/MODIS/MYD06_L2.006 (Aqua). The VIIRS cloud data were provided by the SMHI. The LWP data from the ARM campaign were obtained from the ARM website, and the CTH data were obtained from the Cloudnet webpage (http://www.cloud-net.org/).
Acknowledgements. The deployment of AMF2 to Hyytiälä was
en-abled and supported by ARM. Argonne National Laboratory’s work was supported by the U.S. Department of Energy, Assistant Secre-tary for Environmental Management, Office of Science and Tech-nology, under contract DE-AC02-06CH11357. The authors grate-fully acknowledge the support of AMF2 (Nicki Hickmon, Michael Ritsche and others), SMEAR-II (Janne Levula and others) and the BAECC community for their support in initiating the BAECC cam-paign, its implementation and operation.
This work was carried out with the support of the Lund Centre for studies of Carbon Cycle and Climate Interaction, LUCCI; the European Seventh Framework Programme, ACTRIS (EU INFRA-2010-1.1.16-262254), Aerosols, Clouds, and Trace gases; Research Infra Structure Network; the Strategic Research Program MERGE, Modeling the Regional and Global Earth System; and the Swedish Research Council (diary no: 2010-4683). We are also grateful for the support by the Swedish Research Council and from the Nordic Council of Ministers for the Nordic Top-level Research initiative CRAICC: Cryosphere–atmosphere interactions in a changing Arctic climate. This work was partly supported by the Office of Science (BER), U.S. Department of Energy via BAECC (Petäjä), European Commission via projects ACTRIS-TNA, ACTRIS2, BACCHUS, PEGASOS, and Academy of Finland Centre of Excellence (project number 272041).
Edited by: A. Kokhanovsky
Reviewed by: three anonymous referees
References
Ackerman, T. P. and Stokes, G. M.: The Atmospheric Ra-diation Measurement Program, Physics Today, 56, 38–44, doi:10.1063/1.1554135, 2003.
Aisheng, W., Xiaoxiong, X., Doelling, D. R., Morstad, D., Angal, A., and Bhatt, R.: Characterization of Terra and Aqua MODIS VIS, NIR, and SWIR Spectral Bands’ Cali-bration Stability, IEEE T. Geosci. Remote., 51, 4330–4338, doi:10.1109/tgrs.2012.2226588, 2013.
Baum, B. A., Menzel, W. P., Frey, R. A., Tobin, D. C., Holz, R. E., Ackerman, S. A., Heidinger, A. K., and Yang, P.: MODIS Cloud-Top Property Refinements for Collection 6, J. Appl. Meteorol. Clim., 51, 1145–1163, 2012.
Cao, C., Xiong, J., Blonski, S., Liu, Q., Uprety, S., Shao, X., Bai, Y., and Weng, F.: Suomi NPP VIIRS sensor data record verification, validation, and long-term performance monitoring, J. Geophys. Res.-Atmos., 118, 11664–11678, doi:10.1002/2013jd020418, 2013.
Cess, R. D., Zhang, M. H., Zhou, Y., Jing, X., and Dvortsov, V.: Ab-sorption of solar radiation by clouds: Interpretations of satellite, surface, and aircraft measurements, J. Geophys. Res.-Atmos., 101, 23299–23309, 1996.
Crewell, S. and Löhnert, U.: Accuracy of cloud liquid wa-ter path from ground-based microwave radiometry 2. Sensor accuracy and synergy, Radio Science, 38, 8042, doi:10.1029/2002rs002634, 2003.
Dolinar, E. K., Dong, X. Q., Xi, B. K., Jiang, J. H., and Su, H.: Evaluation of CMIP5 simulated clouds and TOA radiation bud-gets using NASA satellite observations, Clim. Dynam., 44, 2229-2247, 2015.
Dong, X. Q., Minnis, P., Xi, B., Sun, S., and Chen, Y.: Comparison of CERES-MODIS stratus cloud properties with ground-based measurements at the DOE ARM southern great plains site, J. Geophys. Res.-Atmos., 113, D03204, doi:10.1029/2007JD008438, 2008.
Grosvenor, D. P. and Wood, R.: The effect of solar zenith angle on MODIS cloud optical and microphysical retrievals within ma-rine liquid water clouds, Atmos. Chem. Phys., 14, 7291–7321, doi:10.5194/acp-14-7291-2014, 2014.
Hari, P. and Kulmala, M.: Station for Measuring Ecosystem– Atmosphere Relations (SMEAR II), Boreal Environ. Res., 10, 315–322, 2005.
Heymsfield, A. J., Matrosov, S., and Baum, B.: Ice Water Path–Optical Depth Relationships for Cirrus and Deep Strat-iform Ice Cloud Layers, J. Appl. Meteorol., 42, 1369–1390, doi:10.1175/1520-0450(2003)042<1369:IWPDRF>2.0.CO;2, 2003.
Hogan, R. J., Mittermaier, M. P., and Illingworth, A. J.: The Retrieval of Ice Water Content from Radar Reflectiv-ity Factor and Temperature and Its Use in Evaluating a Mesoscale Model, J. Appl. Meteorol. Climatol., 45, 301–317, doi:10.1175/JAM2340.1, 2006.
Holz, R. E., Ackerman, S. A., Nagle, F. W., Frey, R., Dutcher, S., Kuehn, R. E., Vaughan, M. A., and Baum, B.: Global Moder-ate Resolution Imaging Spectroradiometer (MODIS) cloud de-tection and height evaluation using CALIOP, J. Geophys. Res.-Atmos., 113, D00A19, doi:10.1029/2008JD009837, 2008. Illingworth, A. J., Hogan, R. J., O’Connor, E. J., Bouniol, D.,
Brooks, M. E., Delanoe, J., Donovan, D. P., Eastment, J. D., Gaussiat, N., Goddard, J. W. F., Haeffelin, M., Baltink, H. K., Krasnov, O. A., Pelon, J., Piriou, J. M., Protat, A., Russchen-berg, H. W. J., Seifert, A., Tompkins, A. M., van Zadelhoff, G. J., Vinit, F., Willen, U., Wilson, D. R., and Wrench, C. L.: Cloud-net – Continuous evaluation of cloud profiles in seven operational models using ground-based observations, B. Am. Meteorol. Soc., 88, 883–898, 2007.
Fifth Assessment Report of the Intergovernmental Panel on Cli-mate Change, edited by: Stocker, T. F., Qin, D., Plattner, G.-K., Tignor, M., Allen, S. K., Boschung, J., Nauels, A., Xia, Y., Bex, V., and Midgley, P. M., Cambridge University Press, Cambridge, United Kingdom and New York, NY, USA, 2013.
King, M., Platnick, S., Hubanks, P., Arnold, G., Moody, E., Wind, G., and Wind, B.: Collection 005 change summary for the MODIS cloud optical property (06_OD) algorithm, avail-able at: http://modis-atmos.gsfc.nasa.gov/C005_Changes/C005_ CloudOpticalProperties_ver311.pdf, 2006.
Liljegren, J. C.: Automatic self-calibration of ARM microwave ra-diometers, in: Microwave Radiometry and Remote Sensing of the Earth’s Surface and Atmosphere, edited by: Pampaloni, P. and Paloscia, S., VSP Press, 433–443, 1999.
Liu, J. J., Li, Z. Q., Zheng, Y. F., Chiu, J. C., Zhao, F. S., Cadeddu, M., Weng, F. Z., and Cribb, M.: Cloud optical and microphysical properties derived from ground-based and satellite sensors over a site in the Yangtze Delta region, J. Geophys. Res.-Atmos., 118, 9141–9152, 2013.
Mace, G. G., Zhang, Y., Platnick, S., King, M. D., Minnis, P., and Yang, P.: Evaluation of Cirrus Cloud Properties Derived from MODIS Data Using Cloud Properties Derived from Ground-Based Observations Collected at the ARM SGP Site, J. Appl. Meteorol., 44, 221–240, doi:10.1175/jam2193.1, 2005. Maschwitz, G., Löhnert, U., Crewell, S., Rose, T., and Turner, D.
D.: Investigation of ground-based microwave radiometer calibra-tion techniques at 530 hPa, Atmos. Meas. Tech., 6, 2641–2658, doi:10.5194/amt-6-2641-2013, 2013.
Mather, J. H. and Voyles, J. W.: The Arm Climate Research Facility: A Review of Structure and Capabilities, B. Am. Meteorol. Soc., 94, 377–392, doi:10.1175/bams-d-11-00218.1, 2012.
Menzel, W. P., Frey, R. A., Zhang, H., Wylie, D. P., Moeller, C. C., Holz, R. E., Maddux, B., Baum, B. A., Strabala, K. I., and Gumley, L. E.: MODIS global cloud-top pressure and amount estimation: Algorithm description and results, J. Appl. Meteorol. Clim., 47, 1175–1198, 2008.
Minnis, P., Szedung, S.-M., Young, D. F., Heck, P. W., Garber, D. P., Yan, C., Spangenberg, D. A., Arduini, R. F., Trepte, Q. Z., Smith, W. L., Ayers, J. K., Gibson, S. C., Miller, W. F., Hong, G., Chakrapani, V., Takano, Y., Kuo-Nan, L., Yu, X., and Ping, Y.: CERES Edition-2 Cloud Property Retrievals Using TRMM VIRS and Terra and Aqua MODIS – Part I: Algorithms, IEEE T. Geosci. Remote, 49, 4374–4400, 10.1109/tgrs.2011.2144601, 2011.
Naud, C., Muller, J.-P., and Clothiaux, E. E.: Compari-son of cloud top heights derived from MISR stereo and MODIS CO2-slicing, Geophys. Res. Lett., 29, 42-41–42-44,
doi:10.1029/2002gl015460, 2002.
Naud, C., Muller, J. P., Haeffelin, M., Morille, Y., and Delaval, A.: Assessment of MISR and MODIS cloud top heights through inter-comparison with a back-scattering lidar at SIRTA, Geophys. Res. Lett., 31, L04114, doi:10.1029/2003GL018976, 2004.
Naud, C. M., Muller, J. P., Clothiaux, E. E., Baum, B. A., and Men-zel, W. P.: Intercomparison of multiple years of MODIS, MISR and radar cloud-top heights, Ann. Geophys.-Germany, 23, 2415– 2424, 2005.
Petäjä, T.: Science Plan: Biogenic Aerosols – Effects on Clouds and Climate (BAECC), US Department of Energy, Office of Science, Office of Biological and Environmental Research, DOE/SC-ARM-13-024, 2013
Petäjä, T., O’Connor, E. J., Moisseev, D., Sinclair, V. A., Manni-nen, A. J., VäänäManni-nen, R., von Lerber, A., Thornton, J. A., Nicoll, K., Petersen, W., Chandrasekar, V., Smith, J. N., Winkler, P. M., Hakola, H., Timonen, H., Brus, D., Laurila, T., Asmi, E., Riekkola, M.-L., Mona, L., Massoli, P., Engelmann, R., Komp-pula, M., Wang, J., Kuang, C., Bäck, J., Virtanen, A., Levula, J., Ritsche, M., and Hickmon, N.: A field campaign to elucidate the impact of Biogenic Aerosols on Clouds and Climate, B. Am. Meteorol. Soc., doi:10.1175/BAMS-D-14-00199.1, online first, 2016.
Platnick, S., King, M. D., Ackerman, S. A., Menzel, W. P., Baum, B. A., Riedi, J. C., and Frey, R. A.: The MODIS cloud products: Algorithms and examples from Terra, IEEE T. Geosci. Remote, 41, 459–473, doi:10.1109/Tgrs.2002.808301, 2003.
Platnick, S., King, M. D., Meyer, K. G., Wind, G., Amarasinghe, N., Marchant, B., Arnold, G. T., Zhang, Z., Hubanks, P. A., Ridgway, B., and Riedi, J.: MODIS cloud optical properties: User guide for the Collection 6 Level-2 MOD06/MYD06 product and asso-ciated Level-3 Datasets, Version 0.9 (beta), 2014.
SMHI: Scientific and Validation Report for the Cloud Product Pro-cessors of the NWC/PPS, 2015.
Vant-Hull, B., Marshak, A., Remer, L. A., and Li, Z. Q.: The ef-fects of scattering angle and cumulus cloud geometry on satellite retrievals of cloud droplet effective radius, IEEE T. Geosci. Re-mote, 45, 1039–1045, 2007.
Wind, G., Platnick, S., King, M. D., Hubanks, P. A., Pavolonis, M. J., Heidinger, A. K., Yang, P., and Baum, B. A.: Multilayer Cloud Detection with the MODIS Near-Infrared Water Vapor Absorp-tion Band, J. Appl. Meteorol. Clim., 49, 2315–2333, 2010. Xi, B. K., Dong, X. Q., Minnis, P., and Sun-Mack, S.: Comparison
of marine boundary layer cloud properties from CERES-MODIS Edition 4 and DOE ARM AMF measurements at the Azores, J. Geophys. Res.-Atmos., 119, 9509–9529, 2014.