Neuronal Expression of the Human
Neuropeptide S Receptor NPSR1 Identifies
NPS-Induced Calcium Signaling Pathways
Frank Erdmann1, Sebastian Kügler2, Peter Blaesse1, Maren D. Lange1, Boris V. Skryabin3, Hans-Christian Pape1, Kay Jüngling1*
1Institute of Physiology I, Neurophysiology, Westfälische Wilhelms-University Münster, Robert-Koch-Strasse, 27a, 48149, Münster, Germany,2Center of Molecular Physiology of the Brain (CMPB), Department of Neurology, University Medicine Göttingen, Waldweg, 33, 37073, Göttingen, Germany,3Institute of Experimental Pathology, ZMBE and Interdisciplinary Clinical Research Center, Westfälische Wilhelms-University Münster, Von-Esmarch-Str. 56, 48149, Münster, Germany
Abstract
The neuropeptide S (NPS) system was discovered as a novel neurotransmitter system a decade ago and has since been identified as a key player in the modulation of fear and anxi-ety. Genetic variations of the human NPS receptor (NPSR1) have been associated with pa-thologies like panic disorders. However, details on the molecular fundamentals of NPSR1 activity in neurons remained elusive. We expressed NPSR1 in primary hippocampal cul-tures. Using single-cell calcium imaging we found that NPSR1 stimulation induced calcium mobilization from the endoplasmic reticulum via activation of IP3and ryanodine receptors. Store-operated calcium channels were activated in a downstream process mediating entry of extracellular calcium. We provide the first detailed analysis of NPSR1 activity and the un-derlying intracellular pathways with respect to calcium mobilization in neurons.
Introduction
In 2004, the 20 amino acid neuropeptide S (NPS) has been identified as the ligand for the for-merly orphan g-protein coupled receptor GPR-154 (now NPS receptor, NPSR1) [1], with NPS/ NPSR1 forming a novel neurotransmitter system in the brain [2]. NPS is expressed in the brainstem and in endocrine tissue of rodents, while NPSR1 mRNA can be detected in various brain regions, mainly in the cortex, thalamus, hypothalamus, and in the amygdala [1,3].
Since its discovery, the NPS system has been found to modulate behavior in rodents, medi-ating anxiolytic effects [1,4–8], stimulating locomotion [1,6,9–11], increasing arousal [1,12], and decreasing food intake [13,14]. Human studies have linked the NPS system and single-nucleotide polymorphisms in theNPSR1gene to diseases like asthma and allergy [15,16], in-flammatory bowel disease [17], rheumatoid arthritis [18] and panic disorders [19–22].
Despite these numerous biological functions, little is known about the molecular mecha-nisms underlying NPS receptor activity. Application of NPS in HEK293 or CHO cells
OPEN ACCESS
Citation:Erdmann F, Kügler S, Blaesse P, Lange MD, Skryabin BV, Pape H-C, et al. (2015) Neuronal Expression of the Human Neuropeptide S Receptor NPSR1 Identifies NPS-Induced Calcium Signaling Pathways. PLoS ONE 10(2): e0117319. doi:10.1371/ journal.pone.0117319
Academic Editor:Brij Singh, School of Medicine and Health Sciences, University of North Dakota, UNITED STATES
Received:August 27, 2014
Accepted:December 22, 2014
Published:February 25, 2015
Copyright:© 2015 Erdmann et al. This is an open access article distributed under the terms of the
Creative Commons Attribution License, which permits unrestricted use, distribution, and reproduction in any medium, provided the original author and source are credited.
Data Availability Statement:All relevant data are within the paper.
expressing human NPSR1 variants has been found to elicit calcium mobilization and cAMP ac-cumulation [1,10,23–25], indicating that the receptor activates Gαqand Gαspathways, respec-tively. In Colo205 cells expressing NPSR1, NPS leads to dose-dependent stimulation of cell proliferation and MAP kinase phosphorylation [24]. However, the intracellular pathways downstream to NPSR1 activation have not been identified in detail.
In the present study we aimed to identify intracellular pathways activated following NPSR1 stimulation in neurons. The focus was on the mechanisms of intracellular calcium mobiliza-tion, in view of previous results obtained with NPSR1 stimulation in non-neuronal cells [1,24]. Rather than using stable transfected model cell lines, we made use of an adenoviral system to express NPSR1 in cultured mouse hippocampal neurons, combined with confocal calcium im-aging and pharmacology. Through this experimental design, we provide the first detailed char-acterization of NPSR1 function and intracellular signaling pathways in neurons.
Materials and Methods
Ethics statement
All experiments were carried out in accordance with the European Committees Council Direc-tive (86/609/EEC) for experimentation on animals. Protocols were approved by the Landesamt für Natur, Umwelt-und Verbraucherschutz NRW (AZ 8.87–51.05.20.10.114).
Vector production
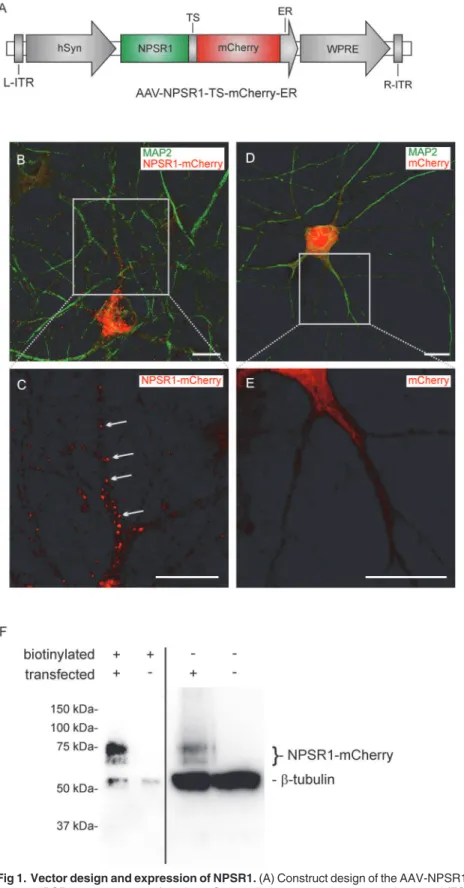
For viral transfection, DNA containing the coding sequences of the isoform A of the human neuropeptide S receptor (NPSR1, the amino acid sequence can be accessed through NCBI protein database under NCB accession # NP_997055), a plasma membrane targeting signal (TS), the red fluorescent protein mCherry and an ER export signal (ER) was commercially synthesized (Genscript, USA). This fragment was subcloned into an AAV vector containing ITRs of serotype 2, the human synapsin promoter (hSyn), the woodchuck hepatitis virus post-transcriptional regulatory element and a polyA site resulting in
AAV-NPSR1-TS-mCherry-ER (Fig. 1A). For control experiments, an AAV expressing mCherry under the control of
hSyn was used (AAV-mCherry). This vector contained ITRs of serotype 2, coding sequences for the human synapsin promoter, a 2A sequence, the red fluorescent protein mCherry, the woodchuck hepatitis virus posttranscriptional regulatory element, and a polyA site. To ex-press NPSR1 as a non-fusion protein, the human synapsin promoter, the coding sequences for a hemagglutinin signal sequence, NPSR1, an IRES sequence, and the red fluorescent pro-tein tdTomato were cloned into a pcDNA3.1 vector (NPSR1-IRES-tdTomato, Invitrogen, USA).
Virus production
Recombinant adeno-associated virus particles of serotype 6 (AAV6) were produced essentially as described [26]. AAV-mCherry was a kind gift from Dr. Stephan Guggenhuber and Prof. Dr. Beat Lutz (Institute of Physiological Chemistry, University Medical Center of the Johannes Gu-tenberg University Mainz, Mainz, Germany).
Animals
Animals were kept in temperature-controlled, air-filtered cages with 12h light-dark-cycle and unlimited access to water and food. Animals were controlled for signs of distress on a daily basis.
and analysis, decision to publish, or preparation of the manuscript.
Cell culture and transfection
P0–P2 C57BL/6 mice were sacrificed without anesthesia by decapitation. Hippocampal cul-tures were prepared as described elsewhere [27]. In brief, hippocampi were dissected and tryp-sinated (0.25%, Invitrogen, USA) for 15 min. Cells were triturated with fire-polished pasteur pipettes and plated on poly-D-lysine-coated coverslips (1 mg/ml, Invitrogen) in the presence of AraC (25μM, Invitrogen). After 24 h, Eagle’s basal medium (BME, Invitrogen) was
ex-changed to Neurobasal (Invitrogen), complemented with B27, Glutamax (Invitrogen), 1% fetal calf serum and 1% penicillin/streptomycin. 24–48 h after seeding, AAV-NPSR1-TS-mCherry-ER was added to the medium (4 x 10⁶transducing units in 2 ml). Half of the medium was re-placed by fresh Neurobasal every 3–4 days. Transfection of the NPSR1-IRES-tdTomato vector was done using Lipofectamin 2000 (Invitrogen) in serum-free Neurobasal following manufac-turer recommendations. In brief, 1μg vector DNA and 2μl LF2000 were used per coverslip
and incubated for 90 min. Neurons were transfected after 7 daysin vitro.
Surface biotinylation
Surface biotinylation was performed as described elsewhere [28]. 6 days after transfection with AAV-NPSR1-TS-mCherry-ER, hippocampal neurons were labeled with biotin (100μM,
Sigma-Aldrich, USA) in PBS on ice for 30 min. Cells were washed in 1 M glycine in PBS on ice for 10 min and homogenized in RIPA buffer (150 mM NaCl, 1% Triton X-100, 0.5% deoxy-cholic acid, 0.1% SDS, 50 mM Tris-Cl pH 8.0) supplemented with a protease inhibitor mixture (Complete Mini EDTA free protease inhibitor mixture, Roche). Biotinylated proteins were pu-rified with 50μl streptavidin agarose beads (Sigma-Aldrich) in RIPA buffer at 4°C overnight
and eluted in SDS-PAGE sample buffer containing 5%β-mercaptoethanol at room tempera-ture (RT).
SDS-PAGE and western blotting
The complete eluent from the agarose beads (membrane fraction) and 29% of the supernatant (unlabeled intracellular proteins) were separated in a 10% SDS-PAGE and subsequently blotted on nitrocellulose membranes (Perkin Elmer) in transfer buffer (25 mM Tris, 192 mM glycine, 10% methanol, pH 8.3). Membranes were blocked for 1h at RT in TBS-T (20 mM Tris, 150 mM NaCl, 0.1% Tween-20, pH 7.5) containing 4% non-fat dry milk (Fluka). Membranes were incubated with primary antibodies (rabbit anti-mCherry, 1 mg/ml, 1:1,000, ab167453, Abcam and rabbit anti-neuronal class IIIβ-tubulin, 1 mg/ml, 1: 40,000, PRB-435P, Covance) at 4°C overnight in blocking buffer. After washing, the secondary antibody (horseradish peroxidase-coupled goat anti-rabbit immunglobulins, 1:2,000, DAKO) was applied for 1h at RT in TBS-T/ 4% milk. After washing, immunosignals were detected using a supersignal western blot detec-tion kit (Thermo Scientific) and a Chemidoc MP imaging system (Biorad). Exposure time was 4 s for the biotinylated fraction and 0.45 s for the unlabeled fraction. Immunoblots were ana-lysed using the software ImageJ [29].
marked in (C). (D,E) Immunocytochemistry of cultured hippocampus neurons, 9 days after plating and 7 days after viral transfection with a control vector expressing mCherry but not NPSR1. Punctual localization of mCherry could not be detected. Scale bars indicate 10μm. (F) Surface expression of NPSR1-mCherry. Immunoblot with anti-mCherry and anti-neuronal class IIIβ-tubulin for the biotinylated plasma membrane fraction of proteins and the non-biotinylated intracellular fraction. Biotinylation of cultured hippocampus neurons was performed 6 days after transfection with AAV-NPSR1-TS-mCherry-ER and untransfected neurons were used as control. Exposure times were 4 s for the biotinylated fractions and 0.45 s for the unlabeled fractions.
Calcium imaging
If not stated otherwise, calcium imaging experiments were performed with extracellular solu-tion containing 125 mM NaCl, 2.5 mM KCl, 1.25 mM NaH2PO4, 30 mM HEPES, 10 mM Glu-cose, 3 mM CaCl2, 2 mM MgSO4, NaOH pH 7.35. For calcium-free measurements, CaCl2was substituted by MgCl2and 5 mM EGTA was added. Solutions were supplemented with 125 nM tetrodotoxin (TTX, Tocris, UK). 5 to 7 days (AAV) or 2 to 3 days (Lipofectamin2000) after transfection, cells were stained with 2μM Fluo4-AM (Molecular probes, USA) in extracellular
solution at RT for 23 min. Cells were continuously perfused (13 ml/min) with extracellular so-lution at RT and objected to imaging using the 488 nm line of a Nikon eC1 plus laser scanning confocal microscope (Nikon, Japan). A Nikon 16x/0.80w water immersion objective was used. Images were acquired every 2.5 sec using the software suite Nikon EZ-C1. NPS was custom-synthesized by Genscript (USA). Stock solutions were prepared in PBS and diluted to final con-centrations with extracellular solution. As a general rule, cells were stimulated for 90 s with 500 nM NPS if not indicated otherwise. Experiments with CPA, 2-APB, U73122, ryanodine and SHA68 started with the application of NPS to identify responsive neurons. NPS was al-lowed to wash out for at least 10 min, folal-lowed by drug application. NPS was applied once again to test for drug effects on NPSR1 activity. For reversible drugs, NPS was finally applied for a third time after drug wash out. Incubation times prior to NPS application were 300 s for 2-APB, U73122, ryanodine and SKF96365, 180 s for SHA68, 120 s for ML-9 and 600 s for the Cavblocker cocktail. Washout times were 900 s for 2-APB and SHA68. Neurons were incubat-ed with CPA for 500–650 s, until fluorescence reached baseline level. Blockers were used in the following concentrations: 30μM CPA (Tocris), 25μM 2-APB (Sigma-Aldrich), 10μM U73122
(Tocris), 50μM ryanodine (Tocris), 1μM SHA68 [10], 50–100μM ML-9 (Tocris) and 15μM
SKF96365 (Tocris). The cocktail used to block Cavs contained 4μM mibefradil, 5μM
nifedi-pine and 250 nM conotoxin MVIIC (all Tocris). For calcium-free measurements, neurons were incubated with calcium-free solution for 50 s prior to NPS-application. In order to discriminate neurons from other cell types, 300μM glutamate (Tocris) was applied for 1 s at the beginning
or end of each experiment.
Immunocytochemistry
Cultured neurons were fixed in ice-cold 4% paraformaldehyde for 20 min and incubated in 10% normal goat-serum, 1% BSA, 0.3% Saponine (blocking solution) in PBS for 1 hour at RT. Primary antibodies (mouse anti-mCherry, 1 mg/ml, 1:200, orb66657, Biorbyt, UK, guinea pig anti-MAP2, 1 mg/ml, 1:1000, 188004, Synaptic Systems, Germany) were diluted in blocking so-lution. Cells were incubated over night at 4°C. Secondary antibodies (goat anti-mouse
Alexa594, 2 mg/ml, 1:1000, A11032, Invitrogen, donkey anti-guinea pig Alexa488, 1 mg/ml, 1:1000, 706545148, Jackson Immuno Research, UK) were diluted in blocking solution, and cells were incubated for 90 minutes at RT. Stained cells were mounted using Immu-Mount (Fisher Scientific, USA) and analyzed with a laser scanning confocal microscope (Nikon eC1 plus, Nikon, USA) using a Leica 40x/1.25–0.75 HCX APO OIL objective. stacks (7 to 10 Z-frames, 0.5–1μm/step) were scanned with a resolution of 1024x1024 pixels.
Data analysis
Clampfit10 (Molecular Devices Corporation, USA). Fluorescence traces were averaged and plotted with Origin 9.0 (OriginLab, USA). Fluorescence amplitudes were calculated referring to baseline conditions. Amplitude values for baseline conditions represent maximum values within the baseline referring to the mean values of the baseline. Integration of the response am-plitude over time for slow component of the calcium signal was done in Clampfit10. Image se-quences from immunocytochemistry were volume rendered with EZ-C1 Viewer (Nikon). Prism (Graphpad, USA) was used for statistical analysis. One-way ANOVA with Tukey post-hoc tests or student’s t-tests were used as applicable. P values for Tukey post-hoc tests are given as multiplicity adjusted p values. Asterisks in figures indicate significant differences in the test-ed datasets (= p<0.05,= p<0.01,= p<0.001). Data are presented as mean with
stan-dard deviation if not indicated otherwise. All figures were prepared for presentation using CorelDraw Graphics Suite 12 (Corel Corporation, USA).
Results
Vector design and expression of NPSR1 in mouse neurons
In a first set of experiments we developed a protocol for the functional expression of NPSR1 in cultured mouse hippocampus neurons. We designed an adeno-associated viral expression vector (AAV-NPSR1-TS-mCherry-ER,Fig. 1A) that contained the coding sequences for NPSR1 and mCherry, separated by a plasma membrane targeting signal
Activation of NPSR1 in hippocampus neurons leads to calcium-release
from intracellular stores
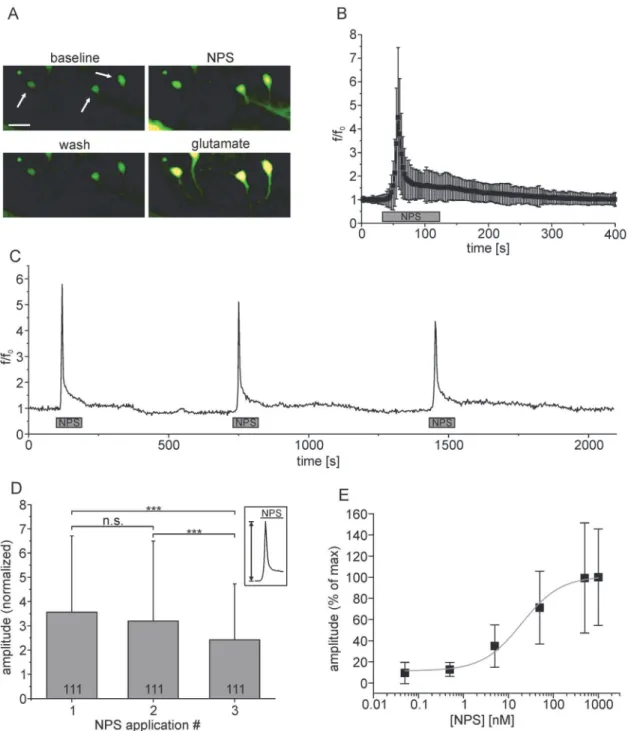
In view of previous findings in non-neuronal cell lines [1,24], we hypothesized that stimulation of NPSR1-expressing mouse hippocampus neurons with NPS induces an elevation of the cyto-solic calcium concentration ([Ca2+]cyt). After transfection, cell cultures were incubated with Fluo4-AM and subjected to calcium imaging. Application of NPS resulted in a transient rise in Fluo4 fluorescence (Fig. 2A). In 229 neurons, the normalized mean fluorescence (f/f0) in-creased by 3.5 ± 2.9 over baseline (Fig. 2B). The time course of NPSR1-dependent calcium sig-nals was characterized by an initial rapid component with a rise time of 9.47 ± 5.77 s (5–95% of max) followed by a slower recovery phase with a decay time (95–5% of max) of 132.71 ± 94.11 s. Repeated application of NPS resulted in a gradual decrease in response amplitude, measured as normalized mean fluorescence amplitude from 3.6 ± 3.1 for the 1stapplication to 3.2 ± 3.3 (2nd) and 2.4 ± 2.3 (3rd) in 111 neurons (675 s interval,Fig. 2C,D, ANOVA: F(2, 330)= 4.379, p = 0.0133). Application of varying NPS concentrations in a range of 50 pM to 1μM resulted
in a dose-response curve with an EC50of 19.8 ± 1.3 nM (SEM, n = 318 cells,Fig. 2E).
It has been shown that the NPSR1 antagonist SHA68 blocks NPS-mediated calcium mobili-zation in HEK293 cells expressing NPSR1 [10]. Here we used SHA68 to verify that recorded Ca2+signals resulted from activation of NPSR1. In 204 neurons, application of NPS [250 nM] resulted in an increase in Fluo4 fluorescence with normalized mean amplitude of 2.9 ± 1.8
(Fig. 3A). In the presence of SHA68 [1μM], NPS application failed to induce Ca2+signals in
the same neurons. The normalized mean amplitude was reduced to 0.5 ± 0.7, a level not signifi-cantly different from baseline (Tukey post- hoc test, p = 0.1815). After washout of SHA68, NPSR1 activity was partly restored, as indicated by NPS-evoked calcium responses with a nor-malized mean amplitude of 1.2 ± 1.6 (Fig. 3B, ANOVA: F(3, 812)= 170.5, p<0.0001).
In further control experiments, calcium responses could not be detected in 936 untrans-fected neurons after stimulation with NPS (Fig. 3C). Moreover, we tested if the C-terminal fu-sion of mCherry changes NPSR1-mediated calcium signals. When NPSR1 was expressed from a bicistronic vector as non-fusion protein, the evoked signals displayed a similar time course but reduced amplitude compared to the NPSR1-mCherry construct (Fig. 3D). In addition, NPSR1-mediated calcium signals were not affected when action potentials were suppressed by TTX [125 nM] (Fig. 3E).
To identify the source of calcium leading to an increase in [Ca2+]cytupon NPSR1 stimula-tion, we used cyclopiaconic acid (CPA) to inhibit SERCA-ATPases [32]. Under resting condi-tions, the concentration of free calcium in the cytosol is low while the concentration of free Ca2+in the ER lumen is high. This is due to the action of SERCA, which constantly compen-sates for passive Ca2+efflux from the ER (“calcium leakage”). In 397 neurons displaying intra-cellular calcium responses to NPS (mean fluorescence amplitude: 4.4 ± 2.69), subsequent application of CPA [30μM] resulted in a transient increase in cytosolic calcium (1.6 ± 1.17),
in-dicating calcium leakage from the ER upon blockade of SERCA (Fig. 4A). After decline of CPA-evoked calcium transients, i.e. the ER was devoid of calcium, application of NPS failed to evoke intracellular calcium responses with a normalized mean amplitude non-significantly different from baseline (0.27 ± 0.4, Tukey post-hoc test, p = 0.9992). CPA abolished NPSR1-mediated calcium signals in NPS-responsive neurons (Fig. 4B, n = 397, ANOVA: F(3, 1584)= 684.6, p<0.0001).
Fig 2. NPS-evoked calcium signals in hippocampus neurons expressing NPSR1.(A) Mean fluorescence images of Fluo4-stained hippocampus neurons transfected with AAV-NPSR1-TS-mCherry-ER during baseline-conditions, application of 500 nM NPS, washout and application of 300μM glutamate. Arrows mark NPS-responsive neurons. Mean fluorescence images were calculated from seven raw images each. Scale bar indicates 25μm. (B) Normalized mean fluorescence values for the first NPS-administration calculated from 229 individual neurons after peak alignment. (C) Fluorescence trace of a single NPSR1-expressing neuron stained with Fluo4-AM. NPS [500 nM] was applied for 90 seconds as indicated. (D) Comparison of normalized peak amplitudes for three consecutive applications of NPS. (E) Dose-response curve for NPSR1-mediated calcium mobilization in neurons, depicting an EC50of
19.8±1.3 (SEM, n = 318 neurons).
Application of the IP3R antagonist 2-APB [33] [25μM] prevented responses to NPS (Fig. 4C).
In 166 neurons, the normalized mean fluorescence amplitude evoked by NPS was reduced from 3.86 ± 2.34 for a first application to 0.39 ± 0.61 when NPS was applied in the presence of 2-APB, a level that was not significantly different from baseline (Tukey post-hoc test, p = 0.6122). The effect was reversible, with a normalized mean fluorescence amplitude of 2.2 ± 2.13 after 2-APB washout (Fig. 4D, ANOVA: F(3, 660)= 239.8, p<0.0001). We used the PLC inhibitor U73122 [34] [10μM] to block the generation of IP3upon NPSR1 stimulation. In 120 neurons, the drug abolished NPS-mediated calcium release (Fig. 4E). The mean fluorescence amplitude was re-duced from 3.44 ± 1.27 for a first application of NPS to 0.14 ± 0.14 when U73122 and NPS were co-applied, a level not significantly different from baseline (Tukey post-hoc test, p = 0.8935,
Fig. 4F, ANOVA: F(2, 357)= 758.3, p<0.0001).
Next, the possible contribution of ryanodine receptors (RyR) to NPSR1-mediated Ca2+ re-lease was tested. In the presence of ryanodine [50μM], the normalized mean fluorescence
am-plitude evoked by NPS was at 0.51 ± 0.37, a significant reduction compared to responses prior to ryanodine which were at 2.7 ± 1.48 (Fig. 5A-C, ANOVA: F(2, 405)= 337.0, p<0.0001). Control recordings from the same batch of neurons without ryanodine treatment showed that the normalized mean fluorescence amplitude was reduced from 2.35 ± 1.9 for a first appli-cation of NPS to 1.74 ± 1.4 when NPS was applied again (Fig. 5D,E, ANOVA: F(2, 462)= 111.4, Fig 3. NPS-dependent calcium signals are abolished by the NPSR1 antagonist SHA68.(A) Mean fluorescence values recorded from 397 hippocampus neurons. NPS [250 nM] and the NPSR1 blocker SHA68 [1μM] were applied as indicated. (B) Statistical comparison of mean fluorescence amplitudes from experiments shown in (A). SHA68 reduced the effect of NPS to a level non-significantly different from baseline (bl). (C-E) Control experiments. (C) In 936 untransfected hippocampus neurons, no increase in normalized mean fluorescence intensity could be detected when NPS was applied. (D) Normalized mean fluorescence values from 229 neurons expressing NPSR1 as a mCherry fusion protein from AAV-NPSR1-TS-mCherry-ER (black) and from 5 neurons expressing NPSR1 as non-fusion protein from NPSR1-IRES-tdTomato (grey). Please refer to the y-scale at the right-hand side (grey) for results from experiments with the non-fusion NPSR1. (E) Normalized mean fluorescence values from neurons expressing NPSR1 recorded in presence (n = 229, black, seeFig. 2B) or absence (n = 122, grey) of 125 nM TTX. NPS was used at 500 nM in the experiments,. if not indicated otherwise.
p<0.0001). Taken together, the amplitude of the response evoked by a second NPS
applica-tion reached 0.77 ± 0.35 when normalized to the first applicaapplica-tion, while this value was reduced to 0.24 ± 0.25 when RyRs were blocked (Fig. 5F, t-test: p<0.0001).
NPSR1 activation induces store-operated calcium entry
The biphasic time course of NPSR1-mediated calcium signals with a fast and a slow component suggested two major calcium routes. Therefore, the contribution of calcium influx via the
Fig 4. Calcium is released from the endoplasmic reticulum via IP3receptors upon NPSR1 activation.(A) Normalized mean fluorescence calculated from 397 neurons. NPS and CPA [30μM] were applied as indicated. CPA abolished NPS-evoked calcium signals. (B) Statistical analysis of peak amplitudes for baseline conditions (bl), NPS, CPA and NPS. (C) Mean fluorescence values from 166 cells treated with NPS and the IP3receptor antagonist 2-APB [25
μM] as indicated. APB abolished NPSR1-mediated calcium signals. (D) Peak amplitudes for baseline conditions, application of NPS, NPS in presence of 2-APB, and NPS after 2-APB washout calculated from the dataset shown in (C). (E) Mean fluorescence values from 120 cells treated with NPS and the PLC-blocker U73122 [10μM]. The drug abolished NPSR1-mediated calcium signals. (F) Peak amplitudes for baseline conditions, application of NPS, and NPS in presence of U73122 calculated from the dataset shown in (E). NPS was used at 500 nM in all experiments.
Fig 5. NPSR1-mediated IP3receptor activation triggers calcium-induced calcium release via ryanodine receptors.(A) Fluorescence recording from a single neuron treated with ryanodine [50μM] (black) and an untreated control (grey). (B) Mean fluorescence intensities calculated from 136 individual neurons. (C) Mean amplitudes calculated from the dataset shown in (B). (D) Fluorescence as averaged from 155 control neurons for two consecutive NPS applications in the absence of ryanodine. (E) Mean amplitudes calculated from the dataset shown in (D). (F) Mean amplitudes for the second application of NPS normalized to the preceding first NPS-administration in control cells (grey) and in the presence of ryanodine (black). NPS was used at 500 nM in all experiments.
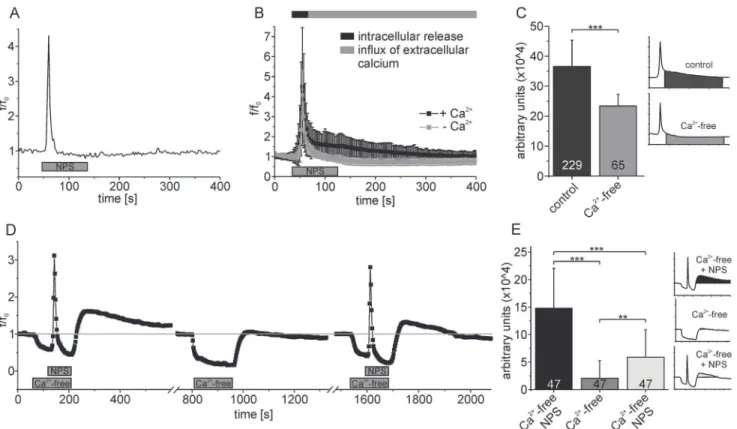
plasma membrane was tested in a nominally calcium-free solution. We found the amplitude of the initial fast component of the NPS-evoked calcium signal not to be significantly altered under calcium-free conditions, with values of 3.6 ± 2.9 and 2.9 ± 1.9, respectively (t-test: p = 0.1054). In contrast, the duration and amplitude of the slow component was drastically re-duced (Fig. 6A,B). This indicates that the initial rapid component in the NPSR1-mediated cal-cium signal could be attributed to mobilization of calcal-cium from the ER, while the long lasting slow component was caused by an influx of extracellular Ca2+. The response amplitude was in-tegrated over time for the slow component of the calcium signal in order to quantify the Ca2+ influx. The integral was significantly decreased from 36.6 ± 8.3 x 10⁴(arbitrary units) under control conditions to 23.4 ± 3.9 x 10⁴in Ca2+-free solution (Fig. 6C, t-test: p<0.0001).
These results suggested that calcium entry pathways located in the plasma membrane largely contributed to the second, slower component of NPSR1-evoked increases in cytosolic Ca2+. In most cells, calcium release from the ER and the according fall in ER-luminal Ca2+concentration subsequently activates calcium channels in the cell membrane in a process called store-operated calcium entry (SOCE) [35]. Next, we tested our hypothesis that NPSR activation induces SOCE in a downstream process. To further discriminate contributions of intra- and extracellular calci-um sources, we applied NPS in a nominally calcicalci-um-free solution to induce the fast, intracellular component of the NPSR1 dependent calcium signal. When the fluorescence was back to
Fig 6. NPS application triggers store-operated calcium entry (SOCE) in neurons expressing NPSR1.(A) Single-cell fluorescence recording performed in calcium-free solution. (B) Mean fluorescence values calculated from 65 neurons under Ca2+-free conditions (grey). For comparison, control data from 229
cells are shown (black, see alsoFig. 2B), unmasking proportionate contributions of intra- and extracellular calcium sources to the NPSR1-mediated calcium signal. (C) Statistical analysis of the data shown in (B). The response amplitude has been integrated over time and averaged for different experimental conditions as indicated. (D) Mean fluorescence values from 47 neurons with calcium free extracellular solution and NPS applied as indicated. Error bars have been omitted for clarification. Calcium mobilization from intracellular stores is a prerequisite for generation of the slow, extracellular component of NPSR1-mediated calcium signals. (E) Statistical analysis of the data shown in (D). The response amplitude has been integrated over time and averaged for different experimental conditions as indicated. NPS was used at 500 nM in all experiments.
baseline, we perfused the cells with standard extracellular solution containing Ca2+to initiate SOCE (Fig. 6D). To quantify the resulting calcium influx, we integrated the response amplitude over time after re-addition of Ca2+(Fig. 6E). We found that the integral was drastically reduced from 14.8 ± 7.2 x 10⁴(arbitrary units) for a first application of NPS under calcium-free condi-tions to 2.1 ± 3.2 x 10⁴for a control application of Ca2+-free extracellular solution without NPS. After applying NPS under Ca2+-free conditions once again, the integral was significantly in-creased to 5.9 ± 4.9 x 10⁴(n = 47 cells, ANOVA: F(2, 138)= 67.16, p<0.0001).
In previous studies, ML-9 and SKF96365 have been shown to inhibit SOCE in non-excitable cells [36–38] as well as in neurons [39]. In the present study, ML-9 [50μM] and SKF96365
[15μM] consistently reduced the duration and amplitude of the slow component of
NPSR1-evoked calcium signals (Fig. 7A,B), similar to the result obtained using calcium-free extracellu-lar solution (Fig. 7C). ML-9 significantly decreased the integral of the response amplitude of the slow component from 36.6 ± 8.3 x 10⁴(arbitrary units) for control conditions to 27.2 ± 5.7 x 10⁴in experiments with the drug (Fig. 7D, ANOVA: F(3, 520)= 87.46, p<0.0001). In presence of SKF96365, a reduction to 30.42 ± 3.8 x 10⁴could be observed (Fig. 7D). When NPS and ML-9 were washed out in parallel, we found that the fluorescence intensity was increasing to the same level as observed under control conditions (Fig. 7E). In summary, ML-9 and SKF96365 significantly reduced NPSR1-evoked influx of extracellular calcium.
Finally, a possible contribution of voltage activated calcium channels (Cav) to the NPS-evoked calcium response was tested. Using a combination of Cavantagonists (Mibefradil [4μM],
Nifedi-pine [5μM] and Conotoxin MVIIC [250 nM]), we found the NPS-triggered calcium signal
unaf-fected compared to control in 148 neurons (Fig. 7F). The integral of the response amplitude during the recovery phase did not change significantly (36.2 ± 7.5 x 10⁴(arbitrary units) for con-trol conditions and 37.4 ± 7.8 x 10⁴in presence of the Cavblockers, t-test: p = 0.2048).
Discussion
In this study, we used heterologous expression of the human NPS receptor in mouse neurons in vitroin order to study intracellular mechanisms triggered by NPSR1 activation. We provide evidence that (i) NPSR1 can be functionally expressed in mouse neurons, (ii) application of NPS leads to calcium release from the endoplasmic reticulum via IP3and ryanodine receptors in NPSR1 expressing neurons and (iii) these calcium release mechanisms in turn activate SOCE, thereby inducing influx of extracellular calcium.
Human NPSR1-mCherry expressed after adenoviral transfection displayed punctual locali-zation across the soma and dendrites of transfected neurons. A similar distribution has been shown for the G-protein coupled receptors (GPCRs) neurokinin1 and somatostatin receptor using immunohistochemistry [40,41]. In surface biotinylation assays, we found that a fraction of mCherry proteins was targeted to the plasma membrane. In immunoblots, NPSR1-mCherry appeared in two bands of 74 kDa and 67 kDa, resembling previously published find-ings where HA-tagged NPSR1 was identified in two bands of 52 kDa and 44 kDa [42]. It has been shown in the same study that the high MW band corresponds to the maturated fraction of NPS receptors. We detected predominantly the high MW form of NPSR1 in the plasma membrane fraction, indicating maturation along the secretory pathway for the membrane-integrated subset of expressed NPSR1-mCherry proteins. Moreover, calcium imaging revealed specific and reproducible responses to NPS application, proving that NPSR1-mCherry proteins were functionally active.
In previousin vitrostudies, NPSR1 has been expressed in HEK293 or CHO cells
cAMP production upon receptor stimulation, analyzing population responses from plate read-ers instead of confocal single-cell calcium imaging. The results of the present study extend these previous findings by providing a detailed characterization of the molecular signaling pathways and mechanisms underlying NPSR1-mediated Ca2+mobilization in individual neu-rons with single-cell resolution. The cultured hippocampal neuneu-rons used represent a well-established and well-characterized expression system. They seem particularly suited for our study since untransfected hippocampal neurons proved to be non-responsive to NPS in our control experiments. Based upon our results, a model of NPSR1-coupled signaling pathways can be constructed (Fig. 8), which incorporates NPSR1-dependent Ca2+release from the ER by IP3receptor activation. The findings that no significant rise in [Ca2+]cytcould be detected upon application of NPS in the presence of the PLC blocker U73122 [34] or the IP3R antagonist 2-APB [33] shows that IP3generation and IP3R activation are essential for the generation of NPSR1-mediated calcium signals, and exclude a significant contribution of other calcium channels directly activated following NPSR1 stimulation. Moreover, these results indicate that the proposed Gαsactivity of NPSR1 does not take part in Ca2+signal generation via a cAMP-dependent pathway. It is known that 2-APB not only inhibits IP3receptors but also modulates Fig 7. SOCE blockers inhibit the generation of the slow, extracellular component of NPSR1-mediated calcium signals.(A) Mean fluorescence values calculated from 103 NPSR1-expressing neurons recorded in the presence of ML-9 [50μM]. (B) Mean fluorescence values of 127 cells treated with
SKF96365 [15μM]. (C) Overlay of mean fluorescence values from 229 cells recorded under control conditions, i.e. extracellular solution supplemented with 3 mM CaCl2(black, see alsoFig. 2B), 103 neurons recorded in presence of ML-9 (grey, see alsoFig. 7A), 127 cells treated with SKF96365 (empty circles, see
alsoFig. 7B), and 65 neurons recorded under calcium-depleted conditions (empty squares, seeFig. 6B). (D) Statistical analysis of the data shown in (C). The response amplitude has been integrated over time and averaged for different experimental conditions as indicated. (E) Overlay of mean fluorescence of 15 cells treated with NPS and ML-9 [100μM] as indicated (grey) and 207 cells measured under control conditions (black). (F) Normalized mean fluorescence values from 148 neurons expressing NPSR1 from a first application of NPS and a consecutive second application of NPS in presence of Mibefradil [4μM], Nifedipine [5μM] and Conotoxin MVIIC [250 nM]. Standard deviations have been omitted for clarification in (C) and (E). Calcium signals were evoked with 500 nM NPS as indicated.
several members of the transient receptor potential channel family [44], which are located in the plasma membrane. Therefore it is important to point out that we can clearly associate the effect of the drug to calcium release from the ER because NPSR1-mediated calcium mobiliza-tion was abolished when neurons have been treated with CPA, i.e. when the ER was devoid of calcium. Moreover, calcium release was still present in experiments where Ca2+-free extracellu-lar solution was used that was supplemented with 5 mM EGTA.
In our experiments, blockade of RyRs by ryanodine significantly reduced the amplitude of the NPS-evoked calcium response, unmasking a second calcium release pathway from the en-doplasmic reticulum. When IP3Rs were blocked, no NPS-dependent elevation in cytosolic cal-cium could be detected. Moreover, the amplitude of NPSR1-mediated calcal-cium signals was not significantly decreased when calcium-free extracellular solution was used. This shows that NPSR1-dependent activation of RyRs strictly requires calcium release from the ER, a process previously described in neurons which is commonly referred to as calcium-induced calcium re-lease (CICR) [45]. Taken together, calcium release from the ER upon IP3receptor activation was amplified by subsequent activation of ryanodine receptors.
In many cell types, Gαq-mediated release of calcium from the endoplasmic reticulum is fol-lowed by the activation of calcium channels at the plasma membrane, known as store-operated
Fig 8. Model for the intracellular mechanisms underlying NPSR1 activation in cultured mouse hippocampus neurons.Calcium is released from the endoplasmic reticulum via IP3and ryanodine receptors, which can be blocked by U73122, 2-APB and ryanodine, respectively. This decrease in the ER
calcium content activates store-operated calcium entry (SOCE), which can be visualized by using Ca2+-free extracellular solution, the underlying signal
cascade can be blocked by ML-9 and SKF96365.
calcium entry (SOCE) [46]. We used a nominally Ca2+-free extracellular solution to isolate these calcium routes and found the fast component of the NPSR1-mediated calcium signal un-affected while the slow component was abolished under these conditions. Re-addition of Ca2+ restored the slow, extracellular component of the NPS-induced Ca2+signal while re-addition of Ca2+following application of Ca2+-free solution without co-application of NPS did not induce influx of extracellular Ca2+. These results show that Ca2+mobilization from intracellular stores, i.e. a decrease of the ER calcium content, was a prerequisite for generation of the slow compo-nent of NPSR1-mediated Ca2+signals, strongly suggesting that NPSR1 stimulation specifically activates SOCE in a downstream process.
Store-operated calcium channels (SOCs) responsible for SOCE are known to be composed by the calcium release-activated calcium modulator 1 (ORAI) [47] and members of the tran-sient receptor potential type c (TRPC) channel families [48]. Channel-activation is induced by interaction with the ER calcium sensor stromal interaction molecule (STIM) [48,49]. In previ-ous studies, ML-9 has been shown to block interaction of STIM and ORAI, thereby inhibiting SOCE in non-excitable cells [38] as well as in neurons [39]. SKF96365 has been shown to in-hibit STIM-mediated SOCE in HeLa cells overexpressing STIM1 [50]. In our experiments, Ca2+signals evoked by NPS application in the presence of ML-9 or SKF96365 were similar to those recorded under calcium-free conditions, abolishing calcium influx from the extracellular solution. An obvious explanation is that these drugs blocked signal transmission from the ER lumen to the plasma membrane via STIM, thereby inhibiting SOCE. In case of ML-9, washout of the drug increased the cytosolic calcium content to a level similar to control conditions, pre-sumably because the ML-9-blocked signal transmission from the ER lumen to the plasma membrane via STIM was restored, resulting in SOC activation and Ca2+influx from the extra-cellular solution. However, the question whether NPSR1-mediated SOCE comprises activation of ORAI or TRPC channels remains to be elucidated.
The NPS system is known as a key player in the modulation of fear and anxiety in both hu-mans and rodents [5,21]. The question arises how the results presented herein are connected to neuronal circuitry in fear related brain regions. In our previous study, we found that activation of NPS receptors increased glutamatergic transmission from principal neurons of the lateral amygdala to GABAergic paracapsular intercalated cells [5]. Presumably, NPSR1-mediated cal-cium mobilization up-regulates neurotransmitter release and thereby enhances synaptic trans-mission. However, NPSR1-triggered calcium release can also be envisioned to induce long term modulation of synaptic plasticity: It is well known that the intracellular calcium concen-tration in synaptic terminals also takes part in the early phase of long term potentiation (LTP) via CaM kinase or protein kinase c dependent phosphorylation, which in turn enhances recep-tor recruitment to the postsynaptic membrane or modulates receprecep-tor activity directly (re-viewed in [51]).
In human studies, it has been shown that a single-nucleotide polymorphism (A>T) of the
NPSR1, might provide new insights in the intracellular mechanisms involved in the generation of anxiety and anxiety disorders.
Acknowledgments
We would like to thank E. Nass, S. Kiesling and J. Akbari for expert technical assistance. We would especially like to thank Dr. Stephan Guggenhuber and Prof. Dr. Beat Lutz (Institute of Physiological Chemistry, University Medical Center of the Johannes Gutenberg University Mainz, Mainz, Germany) for kindly providing the AAV-mCherry virus.
Author Contributions
Conceived and designed the experiments: FE PB HCP KJ. Performed the experiments: FE KJ. Analyzed the data: FE KJ. Contributed reagents/materials/analysis tools: FE SK PB MDL BS KJ. Wrote the paper: FE SK PB HCP KJ.
References
1. Xu YL, Reinscheid RK, Huitron-Resendiz S, Clark SD, Wang Z, et al. (2004) Neuropeptide S: a neuro-peptide promoting arousal and anxiolytic-like effects. Neuron 43: 487–497. PMID:15312648
2. Pape HC, Jüngling K, Seidenbecher T, Lesting J, Reinscheid RK (2010) Neuropeptide S: a transmitter system in the brain regulating fear and anxiety. Neuropharmacology 58: 29–34. doi:10.1016/j. neuropharm.2009.06.001PMID:19523478
3. Xu YL, Gall CM, Jackson VR, Civelli O, Reinscheid RK (2007) Distribution of neuropeptide S receptor mRNA and neurochemical characteristics of neuropeptide S-expressing neurons in the rat brain. J Comp Neurol 500: 84–102. PMID:17099900
4. Chauveau F, Lange MD, Jungling K, Lesting J, Seidenbecher T, et al. (2012) Prevention of stress-impaired fear extinction through neuropeptide s action in the lateral amygdala. Neuropsychopharmacol-ogy 37: 1588–1599. doi:10.1038/npp.2012.3PMID:22298122
5. Jüngling K, Seidenbecher T, Sosulina L, Lesting J, Sangha S, et al. (2008) Neuropeptide S-mediated control of fear expression and extinction: role of intercalated GABAergic neurons in the amygdala. Neu-ron 59: 298–310. doi:10.1016/j.neuron.2008.07.002PMID:18667157
6. Leonard SK, Dwyer JM, Sukoff Rizzo SJ, Platt B, Logue SF, et al. (2008) Pharmacology of neuropep-tide S in mice: therapeutic relevance to anxiety disorders. Psychopharmacology 197: 601–611. doi: 10.1007/s00213-008-1080-4PMID:18311561
7. Meis S, Bergado-Acosta JR, Yanagawa Y, Obata K, Stork O, et al. (2008) Identification of a neuropep-tide S responsive circuitry shaping amygdala activity via the endopiriform nucleus. PLoS One 3: e2695. doi:10.1371/journal.pone.0002695PMID:18628994
8. Rizzi A, Vergura R, Marzola G, Ruzza C, Guerrini R, et al. (2008) Neuropeptide S is a stimulatory anxio-lytic agent: a behavioural study in mice. Br J Pharmacol 154: 471–479. doi:10.1038/bjp.2008.96 PMID:18376418
9. Castro AA, Moretti M, Casagrande TS, Martinello C, Petronilho F, et al. (2009) Neuropeptide S pro-duces hyperlocomotion and prevents oxidative stress damage in the mouse brain: a comparative study with amphetamine and diazepam. Pharmacol Biochem Behav 91: 636–642. doi:10.1016/j.pbb.2008. 10.015PMID:19022279
10. Okamura N, Habay SA, Zeng J, Chamberlin AR, Reinscheid RK (2008) Synthesis and pharmacological in vitro and in vivo profile of 3-oxo-1,1-diphenyl-tetrahydro-oxazolo[3,a]pyrazine-7-carboxylic acid 4-fluoro-benzylamide (SHA 68), a selective antagonist of the neuropeptide S receptor. J Pharmacol Exp Ther 325: 893–901. doi:10.1124/jpet.107.135103PMID:18337476
11. Paneda C, Huitron-Resendiz S, Frago LM, Chowen JA, Picetti R, et al. (2009) Neuropeptide S rein-states cocaine-seeking behavior and increases locomotor activity through corticotropin-releasing factor receptor 1 in mice. J Neurosci 29: 4155–4161. doi:10.1523/JNEUROSCI.5256-08.2009PMID: 19339610
12. Ahnaou A, Drinkenburg WH (2012) Neuropeptide-S evoked arousal with electroencephalogram slow-wave compensatory drive in rats. Neuropsychobiology 65: 195–205. doi:10.1159/000336998PMID: 22538299
14. Smith KL, Patterson M, Dhillo WS, Patel SR, Semjonous NM, et al. (2006) Neuropeptide S stimulates the hypothalamo-pituitary-adrenal axis and inhibits food intake. Endocrinology 147: 3510–3518. PMID: 16574794
15. Kormann MS, Carr D, Klopp N, Illig T, Leupold W, et al. (2005) G-Protein-coupled receptor polymor-phisms are associated with asthma in a large German population. Am J Respir Crit Care Med 171: 1358–1362. PMID:15764725
16. Malerba G, Lindgren CM, Xumerle L, Kiviluoma P, Trabetti E, et al. (2007) Chromosome 7p linkage and GPR154 gene association in Italian families with allergic asthma. Clin Exp Allergy 37: 83–89. PMID: 17210045
17. D’Amato M, Bruce S, Bresso F, Zucchelli M, Ezer S, et al. (2007) Neuropeptide s receptor 1 gene poly-morphism is associated with susceptibility to inflammatory bowel disease. Gastroenterology 133: 808–
817. PMID:17854592
18. D’Amato M, Zucchelli M, Seddighzadeh M, Anedda F, Lindblad S, et al. (2010) Analysis of neuropep-tide S receptor gene (NPSR1) polymorphism in rheumatoid arthritis. PLoS One 5: e9315. doi:10.1371/ journal.pone.0009315PMID:20179762
19. Domschke K, Reif A, Weber H, Richter J, Hohoff C, et al. (2011) Neuropeptide S receptor gene— con-verging evidence for a role in panic disorder. Mol Psychiatry 16: 938–948. doi:10.1038/mp.2010.81 PMID:20603625
20. Donner J, Haapakoski R, Ezer S, Melén E, Pirkola S, et al. (2010) Assessment of the neuropeptide S system in anxiety disorders. Biol Psychiatry 68: 474–483. doi:10.1016/j.biopsych.2010.05.039PMID: 20705147
21. Okamura N, Hashimoto K, Iyo M, Shimizu E, Dempfle A, et al. (2007) Gender-specific association of a functional coding polymorphism in the Neuropeptide S receptor gene with panic disorder but not with schizophrenia or attention-deficit/hyperactivity disorder. Prog Neuropsychopharmacol Biol Psychiatry 31: 1444–1448. PMID:17669576
22. Raczka KA, Gartmann N, Mechias ML, Reif A, Büchel C, et al. (2010) A neuropeptide S receptor variant associated with overinterpretation of fear reactions: a potential neurogenetic basis for catastrophizing. Mol Psychiatry 15: 1067–1074.
23. Anedda F, Zucchelli M, Schepis D, Hellquist A, Corrado L, et al. (2011) Multiple polymorphisms affect expression and function of the neuropeptide S receptor (NPSR1). PLoS One 6: e29523. doi:10.1371/ journal.pone.0029523PMID:22216302
24. Reinscheid RK, Xu YL, Okamura N, Zeng J, Chung S, et al. (2005) Pharmacological characterization of human and murine neuropeptide s receptor variants. J Pharmacol Exp Ther 315: 1338–1345. PMID: 16144971
25. Roth AL, Marzola E, Rizzi A, Arduin M, Trapella C, et al. (2006) Structure-activity studies on neuropep-tide S: identification of the amino acid residues crucial for receptor activation. J Biol Chem 281: 20809–
20816. PMID:16720571
26. Maddalena A, Tereshchenko J, Bahr M, Kügler S (2013) Adeno-associated Virus-mediated, Mifepris-tone-regulated Transgene Expression in the Brain. Mol Ther Nucleic Acids 2: e106. doi:10.1038/mtna. 2013.35PMID:23860550
27. Kaech S, Banker G (2006) Culturing hippocampal neurons. Nat Protoc 1: 2406–2415. PMID: 17406484
28. Khirug S, Ahmad F, Puskarjov M, Afzalov R, Kaila K, et al. (2010) A single seizure episode leads to rapid functional activation of KCC2 in the neonatal rat hippocampus. J Neurosci 30: 12028–12035. doi: 10.1523/JNEUROSCI.3154-10.2010PMID:20826666
29. Schneider CA, Rasband WS, Eliceiri KW (2012) NIH Image to ImageJ: 25 years of image analysis. Nat Methods 9: 671–675. PMID:22930834
30. Hofherr A, Fakler B, Klocker N (2005) Selective Golgi export of Kir2.1 controls the stoichiometry of func-tional Kir2.x channel heteromers. J Cell Sci 118: 1935–1943. PMID:15827083
31. Gradinaru V, Zhang F, Ramakrishnan C, Mattis J, Prakash R, et al. (2010) Molecular and cellular ap-proaches for diversifying and extending optogenetics. Cell 141: 154–165. doi:10.1016/j.cell.2010.02. 037PMID:20303157
32. Plenge-Tellechea F, Soler F, Fernandez-Belda F (1997) On the inhibition mechanism of sarcoplasmic or endoplasmic reticulum Ca2+-ATPases by cyclopiazonic acid. J Biol Chem 272: 2794–2800. PMID: 9006919
34. Bleasdale JE, Thakur NR, Gremban RS, Bundy GL, Fitzpatrick FA, et al. (1990) Selective inhibition of receptor-coupled phospholipase C-dependent processes in human platelets and polymorphonuclear neutrophils. J Pharmacol Exp Ther 255: 756–768. PMID:2147038
35. Várnai P, Hunyady L, Balla T (2009) STIM and Orai: the long-awaited constituents of store-operated calcium entry. Trends Pharmacol Sci 30: 118–128. doi:10.1016/j.tips.2008.11.005PMID:19187978
36. Kozak JA, Kerschbaum HH, Cahalan MD (2002) Distinct properties of CRAC and MIC channels in RBL cells. J Gen Physiol 120: 221–235. PMID:12149283
37. Merritt JE, Armstrong WP, Benham CD, Hallam TJ, Jacob R, et al. (1990) SK&F 96365, a novel inhibitor of receptor-mediated calcium entry. Biochem J 271: 515–522. PMID:2173565
38. Smyth JT, Dehaven WI, Bird GS (2008) Ca2+-store-dependent and -independent reversal of Stim1 lo-calization and function. J Cell Sci 121: 762–772. doi:10.1242/jcs.023903PMID:18285445
39. Gruszczynska-Biegala J, Pomorski P, Wisniewska MB (2011) Differential Roles for STIM1 and STIM2 in Store-Operated Calcium Entry in Rat Neurons. PLoS One 6: e19285. doi:10.1371/journal.pone. 0019285PMID:21541286
40. McConalogue K, Bunnett NW (1998) G protein-coupled receptors in gastrointestinal physiology. II. Regulation of neuropeptide receptors in enteric neurons. Am J Physiol 274: G792–G796. PMID: 9612257
41. Moller TC, Wirth VF, Roberts NI, Bender J, Bach A, et al. (2013) PDZ domain-mediated interactions of G protein-coupled receptors with postsynaptic density protein 95: quantitative characterization of inter-actions. PLoS One 8: e63352. doi:10.1371/journal.pone.0063352PMID:23691031
42. Clark SD, Tran HT, Zeng J, Reinscheid RK (2010) Importance of extracellular loop one of the neuropep-tide S receptor for biogenesis and function. Pepneuropep-tides 31: 130–138. doi:10.1016/j.peptides.2009.10. 015PMID:19874863
43. Bernier V, Stocco R, Bogusky MJ, Joyce JG, Parachoniak C, et al. (2006) Structure-function relation-ships in the neuropeptide S receptor: molecular consequences of the asthma-associated mutation N107I. J Biol Chem 281: 24704–24712. PMID:16790440
44. Kaneko Y, Szallasi A (2014) Transient receptor potential (TRP) channels: a clinical perspective. Br J Pharmacol 171: 2474–2507. doi:10.1111/bph.12414PMID:24102319
45. Verkhratsky A (2002) The endoplasmic reticulum and neuronal calcium signalling. Cell Calcium 32: 393–404. PMID:12543098
46. Parekh AB, Putney JW Jr (2005) Store-operated calcium channels. Physiol Rev 85: 757–810. PMID: 15788710
47. Yeromin AV, Zhang SL, Jiang W, Yu Y, Safrina O, et al. (2006) Molecular identification of the CRAC channel by altered ion selectivity in a mutant of Orai. Nature 443: 226–229. PMID:16921385
48. Lee KP, Choi S, Hong JH, Ahuja M, Graham S, et al. (2014) Molecular determinants mediating gating of Transient Receptor Potential Canonical (TRPC) channels by stromal interaction molecule 1 (STIM1). J Biol Chem 289: 6372–6382. doi:10.1074/jbc.M113.546556PMID:24464579
49. Luik RM, Wang B, Prakriya M, Wu MM, Lewis RS (2008) Oligomerization of STIM1 couples ER calcium depletion to CRAC channel activation. Nature 454: 538–542. doi:10.1038/nature07065PMID: 18596693
50. Liou J, Kim ML, Heo WD, Jones JT, Myers JW, et al. (2005) STIM is a Ca2+ sensor essential for Ca2 +-store-depletion-triggered Ca2+ influx. Curr Biol 15: 1235–1241. PMID:16005298
51. Malenka RC, Bear MF (2004) LTP and LTD: an embarrassment of riches. Neuron 44: 5–21. PMID: 15450156