Covered Temperate Ecosystems of Northern China
Xinyue Zhang1,2, Wei Wang1*, Weile Chen1, Naili Zhang3, Hui Zeng2
1Department of Ecology, College of Urban and Environmental Sciences and the Key Laboratory for Earth Surface Processes of the Ministry of Education, Peking University, Beijing, China,2Key Laboratory for Cyclic Economy, School of Urban Planning and Design, Shenzhen Graduate School, Peking University, Shenzhen, China,3State Key Laboratory of Vegetation and Environmental Change, Institute of Botany, Chinese Academy of Sciences, Beijing, China
Abstract
More than half of the earth’s terrestrial surface currently experiences seasonal snow cover and soil frost. Winter compositional and functional investigations in soil microbial community are frequently conducted in alpine tundra and boreal forest ecosystems. However, little information on winter microbial biogeochemistry is known from seasonally snow-covered temperate ecosystems. As decomposer microbes may differ in their ability/strategy to efficiently use soil organic carbon (SOC) within different phases of the year, understanding seasonal microbial process will increase our knowledge of biogeochemical cycling from the aspect of decomposition rates and corresponding nutrient dynamics. In this study, we measured soil microbial biomass, community composition and potential SOC mineralization rates in winter and summer, from six temperate ecosystems in northern China. Our results showed a clear pattern of increased microbial biomass C to nitrogen (N) ratio in most winter soils. Concurrently, a shift in soil microbial community composition occurred with higher fungal to bacterial biomass ratio and gram negative (G-) to gram positive (G+) bacterial biomass ratio in winter than in
summer. Furthermore, potential SOC mineralization rate was higher in winter than in summer. Our study demonstrated a distinct transition of microbial community structure and function from winter to summer in temperate snow-covered ecosystems. Microbial N immobilization in winter may not be the major contributor for plant growth in the following spring.
Citation:Zhang X, Wang W, Chen W, Zhang N, Zeng H (2014) Comparison of Seasonal Soil Microbial Process in Snow-Covered Temperate Ecosystems of Northern China. PLoS ONE 9(3): e92985. doi:10.1371/journal.pone.0092985
Editor:Jack Anthony Gilbert, Argonne National Laboratory, United States of America
ReceivedDecember 18, 2013;AcceptedFebruary 27, 2014;PublishedMarch 25, 2014
Copyright:ß2014 Zhang et al. This is an open-access article distributed under the terms of the Creative Commons Attribution License, which permits unrestricted use, distribution, and reproduction in any medium, provided the original author and source are credited.
Funding:This research was funded by grants from Projects of National Natural Science Foundation of China (31222011 and 31270363), National Basic Research Program of China (2010CB950604 and 2013CB956303), the Foundation for Innovative Research Groups of National Natural Science Foundation of China (31021001) and Construction Projects between Beijing City and the University in the Central Authorities. The funders had no role in study design, data collection and analysis, decision to publish, or preparation of the manuscript.
Competing Interests:The authors have declared that no competing interests exist.
* E-mail: [email protected]
Introduction
More than half of the earth’s terrestrial surface currently experiences seasonal snow cover and soil frost [1,2]. In these ecosystems, some soil microorganisms are likely protected by the snowpack during winter. With adequate depth and density [3,4], the heat-insulation snowpack creates a relatively warmer habitat with liquid water films around soil particles [5,6]. Other soil microorganisms may develop their physiological adaption to survive the chilly environments [7]. Therefore, despite the freezing air temperature, winter catabolic processes of the soil microbial community, detected through biogenic CO2production, can still
make a significant contribution to annual ecosystem fluxes across a wide variety of seasonally snow-covered ecosystems [8,9,10,11,12]. However, the influence of temporal variations in soil anabolic processes (i.e. microbial biomass accumulation) on annual N cycling is not well understood in these ecosystems [13,14,15].
Recent studies have reported peak microbial biomass C (MBC) and N (MBN) in late winter, followed by a quick decline when soil temperatures rise to 0uC at alpine and arctic sites [14,16,17,18]. An enlarged N pool was retained in the microbial biomass under the snowpack and subsequently released as a nutrient pulse when soils thawed, which may lead to an increase in N availability for plants at the start of the growing season [13,14,16,19]. The
microbial N immobilization observed during winter may play a crucial role in ecosystem function, since it could prevent dissolved N produced by fall litter degradation being lost from the ecosystem during a time when plants are mostly inactive [20]. Therefore, in these snow-covered ecosystems, N retained in the soil by microorganisms during winter may be vital for plant nutrient uptake in the following growing season [18,21,22,23,24,25].
categorized by their cell wall composition, were also found to have various substrate preferences and survival strategies [33]. There-fore, the relative dominance of G- to G+ bacteria may differ between winter and summer. However, it remains poorly understood about the links between the seasonal variation of microbial biomass and the relative abundances of fungi and bacteria in snow-covered temperate areas.
As various decomposer microbes differ in their ability/strategy to efficiently use soil organic matter [34,35,36,37], shifts within the community composition may affect decomposition rates. SOC decomposition is the primary pathway where plant fixed CO2is
released back into the atmosphere [38,39,40]. Along with frequently observed maximal microbial biomass in the winter of seasonally snow-covered ecosystems, the potential SOC mineral-ization rate (SOCMR, indicating intrinsic substrate use efficiency) may increase, releasing more CO2 into the atmosphere when
temperatures rise. However, winter potential SOCMR are seldom conducted [41,42].
Recent studies of winter soil microbial biogeochemical processes have mainly focused on alpine and tundra ecosystems. However, the wintertime conditions in snow-covered temperate areas could differ from those in alpine and tundra areas. In comparison with alpine and tundra, temperate ecosystems experience a shallower snowpack and shorter duration of snow cover [43,44], which may modify the extent of the N pool and the seasonal dynamics of its soil microbes. Moreover, temperate soil microbial communities are sensitive to climate changes, because the soil remains close to freezing throughout the winter [45], and small changes in winter temperatures may result in large changes in the amount and timing of snow cover [2]. More importantly, many temperate ecosystems are exposed to larger atmospheric N deposition as a result of increased emissions from industrial and agricultural activities [46]. Consequently, this may induce substantial changes in microbial N dynamics and ecosystem nutrient cycling. However, so far little investigation has been conducted on the winter biogeochemical process of soil microbes in temperate ecosystems [47]. Our study aims to explore the seasonal variation of microbial biomass, community composition and SOC miner-alization in temperate ecosystems. The following three questions were addressed: (1) what is the C and N retention capacity of the winter soil microbial community in seasonally snow-covered temperate ecosystems? (2) Does microbial community composition shift from summer to winter? (3) What is the microbial function (organic matter decomposition), as indicated by potential SOCMR, in winter? To answer these questions, summer and winter soil samples were collected from the top 10 cm mineral soil in six seasonally snow-covered temperate ecosystems in northern China. The MBC and MBN, microbial community composition and mineralization rate of SOC were determined. We predicted (1) increased MBN immobilization because of relatively low quality substrates in winter (decreased root exudates and increased autumn litter input) may lead to microbial immobilization of N for growth [23,48]; (2) bacterial PLFAs to dominate in summer and fungal PLFAs in winter because fungi were commonly reported with a higher C to N ratio (targeting recalcitrant substrates in winter) compared with bacteria (targeting labile substrates in summer); and (3) a higher potential SOCMR in winter than summer because fungi were reported to produce more b -1,4-glucosidase (BG) enzyme (involved in C metabolism) than bacteria [49].
Materials and Methods
Ethics Statement
The administration of the Saihanba Forestry Center gave permission for this research at each study site. We confirm that the field studies did not involve endangered or protected species.
Site information
Our study sites were situated at the Saihanba Forestry Center in Hebei Province, North China (117u129–117u309E, 42u109–42u509
N, 1400 m a.s.l.), which is a typical forest-steppe ecotone of a temperate area. The climate in this area is arid and semi-humid, with a long and cold freezing period (November-March) and relatively short growing season. Annual mean air temperature and precipitation between 1964 and 2004 were 21.4uC and 450 mm, respectively. The soils in the region are dominated by aeolian sandy soil, together with meadow and swamp soil. Soil has low nutrient content with SOC content ranging from 0.71 to 2.65% and soil total nitrogen (STN) ranging from 0.08 to 0.26%, respectively (Table 1). Soil bulk density (SBD) ranged from 0.65 to 1.06 g cm23; Soil pH varied from 5.8 to 6.5 and 6.0 to 6.6 in the summer and winter, respectively (Table 1). Soil moisture content was calculated on the gravimetric bias. Specifically, 10 g fresh soil samples were dried to a constant weight by an oven at a temperature of 105uC. All the soil and microbial properties were determined by the dry soil weight.
Primary forests were harvested via large scale industrial logging in the late 1900s and have been replaced by secondary forests and plantations. This site contains the largest area of plantation forests in China, the dominant species are Pinus sylvestris var. mongolica
(Mongolia pine) andLarix principis-rupprechtii (Prince Rupprecht’s larch). The Mongolia pine and larch herbaceous layers are similar, composed by Radix Sanguisorbae, Thalictrum aquilegifolium L.,
Agrimonia pilosa Ledeb, andCarex stenophylla Wahleub. The secondary forest mainly consists of Betula platyphylla (birch) with an herbaceous layer ofAgrimonia pilosa LedebandRadix Sanguisorbae. In addition, shrublands dominated byRosa bella Rehd. et Wils(solitary rose) and Malus baccata (Siberian crabapple) and meadow grasslands are also very common. The solitary rose herbaceous layer consists ofLeymus chinensis. The Siberian crabapple herba-ceous layer is dominated by Veronica linariifolia, Galium verum,
Heteropappus hispidus, Trollius chinensis, andBupleurum chinense. The meadow grassland is zonal vegetation dominated by L. chinensis. Due to the sparse understory species of the forest sites and simple species composition of the grasslands and shrublands, we did not consider the potential impacts of vegetation diversity on microbial processes. The distribution of sampling sites was shown in Fig. 1, which was drawn by ArcMap (ArcGIS 10.0, Esri Inc., California, USA) with ancillary site information.
Study design and methods
All experiments were performed on upper 10 cm mineral soils at five random locations from each plot in July 2010 and January 2011. The two months we chose had the highest (July) and lowest (January) air temperature according to the local climate records of recent decade, representing two most stable seasons of the years, namely summer and winter. This approach has been commonly applied to investigate seasonal dynamics [18,28,51]. Under this circumstance, we assumed that the two single months can represent their respective seasons, and that changes over these
two seasons in the soil microbial community may be of greater magnitude than differences within the same season or from year to year [52]. In summer, soil was taken by 5.8-cm diameter soil cores, passed through a 2-mm sieve to remove plant litter and roots and homogenized. In winter, after the thickness of snow cover measured by a steel ruler, snows were swept away with a shovel before sampling. The snow thickness varied from 4-16 cm in different sampling sites (data not shown). After that, frozen soils were collected using axe or drill and the upper materials were cut
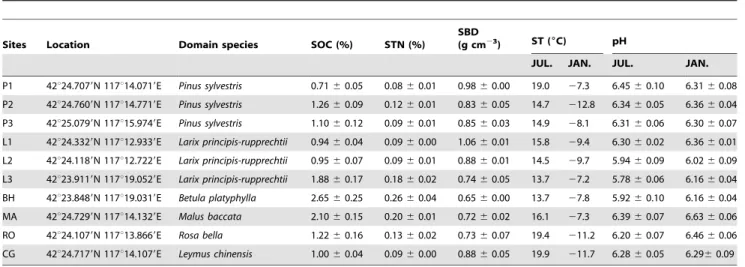
Table 1.Site information and soil properties of the ten sampling sites.
Sites Location Domain species SOC (%) STN (%)
SBD (g cm23
) ST (6C) pH
JUL. JAN. JUL. JAN.
P1 42u24.7079N 117u14.0719E Pinus sylvestris 0.7160.05 0.0860.01 0.9860.00 19.0 27.3 6.4560.10 6.3160.08
P2 42u24.7609N 117u14.7719E Pinus sylvestris 1.2660.09 0.1260.01 0.8360.05 14.7 212.8 6.3460.05 6.3660.04
P3 42u25.0799N 117u15.9749E Pinus sylvestris 1.1060.12 0.0960.01 0.8560.03 14.9 28.1 6.3160.06 6.3060.07
L1 42u24.3329N 117u12.9339E Larix principis-rupprechtii 0.9460.04 0.0960.00 1.0660.01 15.8 29.4 6.3060.02 6.3660.01
L2 42u24.1189N 117u12.7229E Larix principis-rupprechtii 0.9560.07 0.0960.01 0.8860.01 14.5 29.7 5.9460.09 6.0260.09
L3 42u23.9119N 117u19.0529E Larix principis-rupprechtii 1.8860.17 0.1860.02 0.7460.05 13.7 27.2 5.7860.06 6.1660.04
BH 42u23.8489N 117u19.0319E Betula platyphylla 2.6560.25 0.2660.04 0.6560.00 13.7 27.8 5.9260.10 6.1660.04
MA 42u24.7299N 117u14.1329E Malus baccata 2.1060.15 0.2060.01 0.7260.02 16.1 27.3 6.3960.07 6.6360.06
RO 42u24.1079N 117u13.8669E Rosa bella 1.2260.16 0.1360.02 0.7360.07 19.4 211.2 6.2060.07 6.4660.06
CG 42u24.7179N 117u14.1079E Leymus chinensis 1.0060.04 0.0960.00 0.8860.05 19.9 211.7 6.2860.05 6.2960.09
Values are presented as mean6standard errors. SOC = Soil Organic Carbon; STN = Soil totoal nitrogen; SBD = Soil Bulk Density; ST = Soil Temperature; JUL. = July; JAN. = January.
doi:10.1371/journal.pone.0092985.t001
Figure 1. The distribution of sampling sites.P1 =,15-year Mongolia pine; P2 =,25-year Mongolia pine; P3 = ,35-year Mongolia pine; L1 = ,15-year Prince Rupprecht’s larch; L2 = ,25-year larch; L3 = ,35-year larch; BH = Birch; MA = Siberian crabapple; RO = Solitary rose; CG =
Meadow grassland.
by knife. The processed soils were immediately transported to the laboratory (less than 30 min away) for subsequent analysis.
In situ continuous measurements of soil temperature were conducted at 30-min intervals with StowAway loggers (Onset Comp. Corp., Bourne, MA, USA) inserted into the soil at a depth of 5 cm. Extractable ammonium and nitrate nitrogen (NH4+and
NO32) were measured simultaneously in 2 mol/L KCl solution
(1:5 w/v) [53] using a Lachat Flow Injection Analyzer (Lachat Instruments, Milwaukee, WI). The amount of extractable ammo-nium and nitrate nitrogen were taken as total inorganic N. SOC was measured by the potassium dichromate oxidation method with ground air-dried soils [54] while STN was measured by Kjeldahl method [55]. Because of the minor variation of SOC and STN in our study sites over a year (data not shown), we only measured the values in summer time (July) and did not take the difference between summer and winter into consideration. Soil pH was determined using a pH meter (Denver, US) on a 1:1 (w/v) air-dried soil to distilled de-ionized water slurry.
MBN and MBN
MBC and MBN were measured by the chloroform fumigation extraction (CEF) method [56]. Two replicate samples, one un-fumigated and one un-fumigated with alcohol-free CHCl3 for 24 h
and then extracted with 0.5 mol/L K2SO4(1:2.5 w/v). MBC and
MBN were calculated as the difference of C and N between fumigated and un-fumigated soil extraction, which was estimated using the dichromate oxidation and titration method and Kjeldahl digestion, respectively. To avoid variations in CFE values due to the choice of conversion factor (corrects for the incomplete release and extraction of microbial biomass following CEF method), no conversion factor was used for fumigation efficiency as conducted by Edwards and Jefferies (2013) [18], since it could vary across different seasons as well as among different sampling sites [57]. Soil dissolved organic N (DON) was measured from the initial un-fumigated extraction [18].
Phospholipid fatty acid (PLFA) analysis
PLFA analysis was used to determine the total microbial biomass and assess microbial community composition. In brief, PLFAs were extracted by a mixture of chloroform-methanol-phosphate buffer (1:2:0.8) [58]. Polar lipids in the initial soil extracts were separated from neutral and glycolipids by elution with 5 ml chloroform and 10 ml acetone followed by 5 ml methanol. The polar lipid fraction was used to perform mild alkaline methanolysis. The peak area of each resulting fatty acid methyl ester was recorded on the chromatogram for each sample before identification. Peaks were identified by chromatographic retention time and a standard qualitative mix that ranged from C9 to C30 using a microbial identification system (Microbial ID Inc., Newark, DE). The fatty acid 18:2v6, 9 was recognized as the fungal biomarker [59]. Bacterial biomass was quantified as the sum of i14:0, i15:0, a15:0, 16:1v9, 16:1v7, i17:0, a17:0, cy17:0, 17:0, and cy19:0 [60]. G+bacteria were marked by i15:0, a15:0, i16:0, a16:0, i17:0, and a17:0 [59]. The mono-unsaturated and cyclopropyl saturated peaks 16:1v5, 16:1v9, 17:1v9, cy17:0, 18:1v11, and cy19:0 were used as indicators for G- bacteria [59,61,62]. We also calculated the total lipids as an indicator of microbial biomass [63].
Potential SOCMR
We used a laboratory incubation experiment to measure the SOCMR through detection of CO2 emission [41,64].
Approxi-mately 25 g of fresh soil were placed into 250 ml glass gas tight jars and incubated at 25uC for 3 d. Respired CO2was captured by
a connecting vial with 5 ml 1 mol/L NaOH and determined by titration with 1 mol/L HCl. Potential SOCMR were expressed as the amount of CO2-C released per hour per gram soil dry weight.
Because the winter soil temperature was below 0uC, it was unable to measure in situ mineralization activity using the laboratory incubation method. Thus, we conducted the potential SOCMR in winter using the same temperature as the summer (25uC, being the suitable condition for soil microbial growth in the field). Considering the condition for winter samples was quite different from the in situ environment, we indirectly estimated winter mineralization of SOC using the Q10 coefficient (increase in
reaction rate per 10uC increase in temperature) obtained from our previous research in the same study sites [12].
SOCMRin{situ~SOCMR25=Q10
(25{T)=10 ð1Þ
WhereSOCMRin-situwas the mineralization rate of SOC at anin situtemperature measured in winter,SOCMR25was the
mineral-ization rate of SOC at the room temperature of 25uC, andTwas the winter soil temperature at 5 cm depth.
Statistical analysis
We used the averaged value of the subsamples in each plot to conduct statistical analysis. Statistical analyses were performed using SPSS (ver. 18.0, SPSS Inc., Chicago, IL, USA). Repeated measures analysis of variance (ANOVA) was used to determine the effects of seasons and dominate vegetation types on soil N concentrations, microbial biomass, microbial community compo-sition and potential SOCMR. Besides, ANOVA was also used to determine the effect of stand age on above soil and microbial properties. Furthermore, simple correlation analysis was conduct-ed to explore the relationships between microbial community related parameters and soil physical and chemical properties. In all cases, differences of P , 0.05 were regarded as statistically significant. Results were displayed as mean6standard error.
Besides, we analyzed the PLFAs data by principal components analysis (PCA) to determine whether the PLFA signatures of microbial community varied between summer and winter. PCA was performed on 21 different PLFAs indentified from all the samples with concentration larger than 0.005 fraction (ratio of moles individual lipid to moles total lipid biomass) using R 3.0.1 (R Core Team, 2013). Statistical differences among PLFAs data were assessed using multi-response permutation procedures (MRPP) [65,66]. MRPP is a nonparametric procedure for testing the hypothesis of no differences between two or more pre-existing groups [67].P value evaluated the significant differences due to chance, where A value described within-group homogeneity compared to random expectation [67]. An A value equal to 1 was found when all items within a group are identical; when heterogeneity within groups equaled expectation by chance A = 0.
In addition, inverse Simpson index was calculated to describe the microbial diversity obtained from PLFAs data in different seasons as well as in different sampling sites. We preferred this index to other measures of alpha-diversity because it is an indication of the richness in a community with uniform evenness that would have the same level of diversity.
Results
Soil physical and chemical properties
Soil NH4+-N and NO32-N concentrations averaged 1.59 6
0.02 mg kg21 and 0.03 6 0.01 mg kg21 in July and 1.86 6
0.05 mg kg21and 0.0260.01 mg kg21in January, respectively (Table 2). Although total soil inorganic nitrogen (NO32-N +
NH4+-N) across all ecosystems was significantly higher in winter
than in summer at a statistical level (P,0.001), there was no large difference between them (1.8860.07 mg kg21in winter vs. 1.63
60.03 mg kg21in summer) (Table 3; Fig. 2A; Table S1). DON was significantly higher in summer than in winter, with average value decreasing from 4.7660.52 mg kg21in summer to 0.846
0.06 mg kg21in winter, respectively (Table 3; Fig. 2B; Table S1). Although DON significantly differed across different ecosystem types, no significant interaction between seasons and sampling sites was observed (Table 3; Fig. 2B).
Soil MBC and MBN
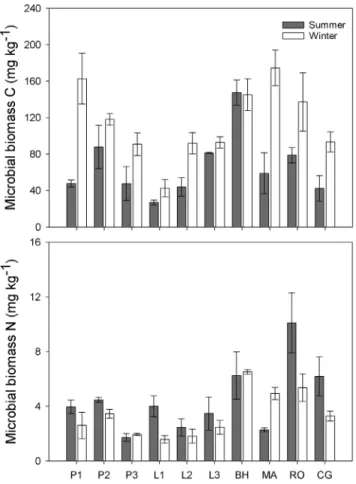
Across all the sampling sites, soil microbes showed a significantly higher MBC (P,0.001) while lower MBN (P = 0.015) in winter than in summer (Table 3; Fig. 3). MBC consistently increased from 66.167.4 mg kg21in summer to 112.168.5 mg kg21in winter on average, except for site BH. MBN in most of the sites were lower in winter than in summer (4.560.5 mg kg21in summer vs. 3.36
0.3 mg kg21in winter) (Table S1). Both MBC and MBN varied significantly across different sites as well as in different seasons (Table 3). Besides, the interaction between seasons and sampling sites also showed significant effect on MBC but not MBN (Table 3). MBC significantly correlated with MBN in both summer (R2 = 0.27,P= 0.020) and winter (R2= 0.52,P,0.001). MBC to MBN (MBC/N) ratio varied from 9.25 6 3.72 to 41.79 6 13.95 in
summer, and 31.4861.57 to 68.38616.33 in winter (Table 2). The MBC/N ratio consistently increased from summer to winter across all the sampling sites, except for site MA, where a slight decrease was found (Table 2). Stand age exhibited no significant influence on MBC/N ratio for both summer and winter.
Microbial community composition
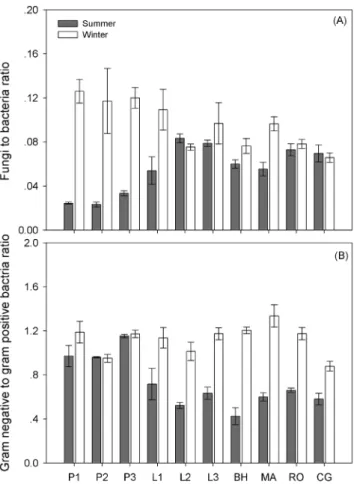
Microbial biomass indicated by total PLFAs showed no significant difference between summer and winter (P = 0.509), but varied significantly among different sampling sites (P,0.001) (Table 3; Fig. 4; Table S1). In addition, microbial community composition shifted with higher fungal biomass abundance in winter (Table 3; Fig. 5A). The bacterial community biomass was not significantly different between summer and winter (P = 0.802) across all the sites, as well as the G+bacterial community biomass (P = 0.050). However, G- bacterial biomass significantly increased in winter (P,0.001; varying from 1.9860.35 nmol PLFAs g dry soil21 in summer to 3.66 6 0.51 nmol PLFAs g dry soil21 in winter). Thus the G- to G+bacterial biomass (G2/G+) ratio also exhibited a significant increase in winter (Fig. 5B; Table S1). In summer, fungal to bacterial biomass (F/B) ratio was negatively correlated with soil pH value (R2 = 0.43,P = 0.036), whereas, in winter, F/B ratio was positively correlated with total microbial biomass indicated by PLFAs (R2 = 0.78,P = 0.001) (Table 4). G2/G+ratio was negatively correlated with soil temperature only in winter (R2 = 0.62,P = 0.007) (Table 4).
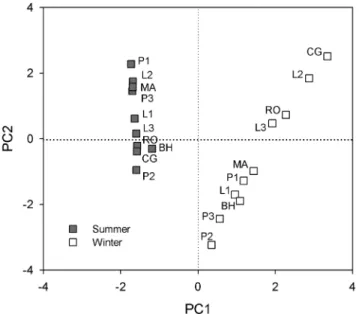
Principle component analysis (PCA) also showed the differen-tiation in microbial community structure between seasons (Fig. 6). The first principle component axis (PC1) alone could explain as
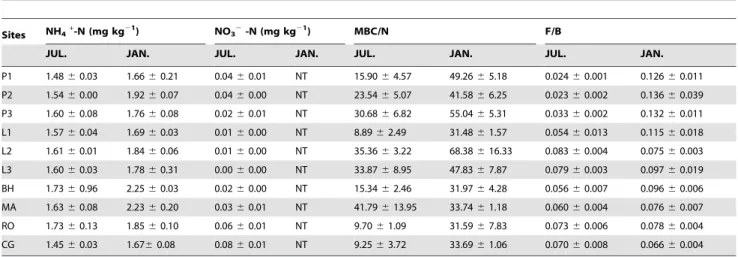
Table 2.Soil inorganic nitrogen (NH4+-N and NO32-N) concentrations, microbial biomass carbon to nitrogen (MBC/N) ratio and
fungi to bacteria biomass (F/B) ratio of the ten sampling sites.
Sites NH4+-N (mg kg21) NO32-N (mg kg21) MBC/N F/B
JUL. JAN. JUL. JAN. JUL. JAN. JUL. JAN.
P1 1.4860.03 1.6660.21 0.0460.01 NT 15.9064.57 49.2665.18 0.02460.001 0.12660.011
P2 1.5460.00 1.9260.07 0.0460.00 NT 23.5465.07 41.5866.25 0.02360.002 0.13660.039
P3 1.6060.08 1.7660.08 0.0260.01 NT 30.6866.82 55.0465.31 0.03360.002 0.13260.011
L1 1.5760.04 1.6960.03 0.0160.00 NT 8.8962.49 31.4861.57 0.05460.013 0.11560.018
L2 1.6160.01 1.8460.06 0.0160.00 NT 35.3663.22 68.38616.33 0.08360.004 0.07560.003
L3 1.6060.03 1.7860.31 0.0060.00 NT 33.8768.95 47.8367.87 0.07960.003 0.09760.019
BH 1.7360.96 2.2560.03 0.0260.00 NT 15.3462.46 31.9764.28 0.05660.007 0.09660.006
MA 1.6360.08 2.2360.20 0.0360.01 NT 41.79613.95 33.7461.18 0.06060.004 0.07660.007
RO 1.7360.13 1.8560.10 0.0660.01 NT 9.7061.09 31.5967.83 0.07360.006 0.07860.004
CG 1.4560.03 1.6760.08 0.0860.01 NT 9.2563.72 33.6961.06 0.07060.008 0.06660.004
Values are presented as mean6standard errors. NT = not detectable. doi:10.1371/journal.pone.0092985.t002
Table 3.The repeated measure ANOVA results of soil and microbial properties tested in this study.
ANOVA results IN DON MBC MBN MB F/B G2/G+ Potential SOCMR
Season P,0.001 P,0.001 P,0.001 P= 0.015 P = 0.509 P,0.001 P,0.001 P,0.001
Sites P = 0.044 P= 0.032 P,0.001 P= 0.002 P,0.001 P= 0.509 P,0.001 P,0.001
Interaction P = 0.297 P= 0.086 P = 0.048 P= 0.121 P = 0.390 P,0.001 P,0.001 P = 0.017
IN = inorganic nitrogen; DON = dissolved organic nitrogen; MB = microbial biomass; G2/G+= gram negative to positive bacteria biomass ratio; SOCMR = soil organic carbon mineralization rate.
much as 96% of the variance in the PLFAs data. There was no evidence of difference in PLFAs data among different sampling sites (MRPP:P= 0.693, A = 0), however, significant difference of PLFAs was observed between summer and winter (MRPP:P = 0.001, A = 0.56). Microbial diversity was significantly lower in winter (4.76) than that in summer (8.59) indicated by inverse Simpson index (P,0.001), and differed in each sampling site (P,
0.001). In all sampling sites, microbial diversity showed a decrease trend from summer to winter (Table S2). Stand age exerted no significant effect on microbial community composition or diversity.
Potential SOCMR
The C emission rate ranged from 5.3162.50 mg CO2-C d21g
dry soil21in summer to 63.2264.02 mg CO2–C d21g dry soil21
in winter under the same incubation temperature, showing a significantly higher potential SOCMR for winter microbes than summer ones (Table 3; Fig. 7; Table S1). However, when applied the Q10value to model thein situwinter SOCMR, the averagein situ mineralization rate was 0.26 mg CO2–C d21 g dry soil21,
quite lower than the averaged summer ones (12.57 mg CO2–C
d21g dry soil21). No significant effect of stand age was observed on potential SOCMR for both summer and winter.
Discussion
Multiple studies in alpine and arctic tundra ecosystems have reported active microbial metabolism under snow-cover during
winter [26,27,28,50,68,69]. However, until now little has been known about winter microbial biogeochemical processes in temperate areas. This study determined the soil microbial biomass, community composition and mineralization rate of SOC in a variety of seasonally snow-covered temperate ecosystems.
Figure 2. Inorganic nitrogen (N) (A) and dissolved organic N (B) across different sites in summer and winter.Results are presented as mean6stander error. Support information is presented in Table S1. doi:10.1371/journal.pone.0092985.g002
Figure 3. Microbial biomass carbon (C) (A) and nitrogen (N) (B) across different sites in summer and winter.Results are presented as mean6stander error. Support information is presented in Table S1. doi:10.1371/journal.pone.0092985.g003
It was commonly thought that relatively low quality substrates may lead to microbial immobilization of N for growth [23,48]. Therefore, we expected increased MBN immobilization because of
decreased root exudates and increased autumn litter input in winter when plants were inactive. However, in our study area, there existed a clear pattern of increased MBC to MBN ratio in winter across almost all of the ecosystems, mainly through increased MBC (Fig. 3A) and reduced MBN (Fig. 3B). Non-increased microbial N pool in winter was unexpected and contrasted with the findings from alpine and tundra areas [26] and corresponding to a temperate beech forest soil [20]. Exception was only found in site MA, where MBN obviously increased from summer to winter (Fig. 3B). However, there was no soil or microbial properties measured in this study seemed to explain this exception. The lower levels of microbial N immobilization in our temperate winter soils indicate a smaller or no nitrogen pulse from winter soil microbes in the following spring. The discrepancy may be due to the differences of snow cover depth and duration. Across our studied sites, the snowpack was as thin as 4–16 cm and the duration of snow cover was short. Snowpack less than 30 cm depth could not effectively decouple soil temperatures from the atmosphere [70,71,72], and thus resulting in lower microbial N immobilization.
As total microbial PLFAs changed negligibly (Fig. 4), the microbial biomass was stable across different seasons. However, the increased fungal dominance seemed to partly explain the increased C and decreased N uptake. The positive relationship between fungal abundance and the MBC to MBN ratio has been observed in a previous global analysis [73]. Fungi were commonly reported with a higher C to N ratio (targeting recalcitrant substrates) compared with bacteria (targeting labile substrates) [74,75]. In summer, warmer temperature can increase root exudates (labile substrates) than in winter [76] and fresh plant litter input had a relatively lower C to N ratio. Therefore, we expected bacterial PLFAs to dominate. In contrast, in winter, a lot of leaf litter with a relative high C to N ratio accumulated on the soil floor and likely became a major substrate source for fungi. We did observe increased fungal PLFAs (P,0.001), but no significant variation in bacterial PLFAs was found between summer and winter (P = 0.809). Because it is common for soil microbes to preferentially use simple organic compounds over complex polymers [77,78], winter substrate usage may be largely confined to microbial recycling of dead microbial cells and hyphae [79] or
Figure 5. Soil fungal to bacterial PLFAs ratio (A) and gram negative to gram positive bacterial PLFAs ratio (B) across different sites in summer and winter. Results are presented as mean6standard error. Support information is presented in Table S1. doi:10.1371/journal.pone.0092985.g005
Table 4.The correlation between soil properties (listed in the row) and microbial community parameters (listed in the line).
Correlation Matrix MBC/N MB F/B G2/G+
JUL. JAN. JUL. JAN. JUL. JAN. JUL. JAN.
ST R 20.508 0.183 20.508 0.134 20.015 0.075 0.076 0.790**
P 0.134 0.612 0.134 0.712 0.967 0.836 0.835 0.007
pH R 0.138 20.255 0.138 0.189 20.665** 0.340 0.595 0.033
P 0.704 0.477 0.704 0.601 0.036 0.337 0.070 0.928
SOC R 0.515 20.374 0.515 0.164 0.222 20.234 20.520 0.482
P 0.128 0.287 0.128 0.651 0.537 0.516 0.123 0.158
STN R 0.485 20.408 0.485 0.145 0.226 20.258 20.551 0.507
P 0.155 0.242 0.155 0.688 0.530 0.490 0.099 0.135
DON R 0.406 0.170 0.406 20.018 0.280 20.340 20.581 0.421
P 0.244 0.639 0.244 0.961 0.433 0.336 0.078 0.225
IN R 0.099 20.380 0.099 0.094 0.363 20.354 20.448 0.361
P 0.785 0.279 0.785 0.797 0.303 0.316 0.194 0.305
endogenous metabolism (the breakdown of living cell constituents/ storage compounds for maintenance). Therefore, the dominance of fungi in winter may be largely due to their resistance to freeze-thawing events [80], and not to substrate preference. Fungal to bacterial PLFA ratios increased in winter across all sites (Fig. 5A). This result was consistent with those obtained in alpine and tundra ecosystems [27,28,50,69]. As seasonal shifts in microbial species composition may also occur at fine taxonomic scales [81], further research into the finer microbial community composition is warranted.
Although no significant variation occurred in the common bacterial PLFAs, we observed a significant increase of G- bacteria in cold environments (P,0.001); in contrast, G+bacterial PLFAs did not change under winter conditions (P = 0.050), which was consistent with previous observation in late winter tussock tundra soil [82]. G- bacteria can more easily access the soil aqueous phase
[33], thus the structure of the cell wall may help it to survive and grow in lower temperatures. Although G- bacteria seemed to take advantage over G+ at colder temperature, correlation analysis across different sampling sites showed that G- to G+ bacterial biomass ratio positively related to winter soil temperature (Table 4). Researches also suggested that G+and G- bacteria differ in their patterns of substrate preference [83] with the former being dominant in soils with low substrate availability [60] and the latter in those with high availability of easily decomposable substrate [84]. Because the winter microbial substrate source was unknown, whether or not the increase in G- bacteria corresponds with the change of substrate preference across sites remains unclear.
A shift in microbial community composition along with fungal dominance in winter may subsequently change the enzyme production by the preference of different microbes and may ultimately influence the potential SOC mineralization rate. Fungi have been reported to produce more BG enzyme (involved in C metabolism) than bacteria [51]. As the BG enzyme was considered as an overall indicator of microbial activity [83,85], we expected a higher potential SOCMR in winter than summer. The result was consistent with our expectation, indicating without the tempera-ture constraints substrate use efficiency was higher for winter microbes than the summer ones. However,in situSOCMR was much lower in winter than in the summer. Although low winter temperature constrained the actual substrate mineralization rate, once temperature rise, the mineralization rate may experience a sharp increase, along with high C metabolism enzyme pool suggested by fungi dominance, and eventually leading to more CO2 released back to atmosphere. The rapid increase of soil
respiration from late winter to early spring has been observed in our previous field study conducted in the same ecosystems [12].
Conclusion
In summary, the trend of increased microbial C and decreased N uptake in winter dominate across all six seasonally snow-covered temperate ecosystems. Therefore, the N pool retained in the microbial biomass under the snowpack may not be major source for spring plant nutrient demand. The higher MBC to MBN ratio in winter was partly connected to the shift in microbial composition to fungal dominance in winter. Because there were significant differences in substrate use, nutrient limitation, and N storage capacity between fungi and bacteria, the changes in winter fungal to bacterial biomass ratios might substantially alter annual patterns of nitrogen cycling in seasonally snow-covered temperate ecosystems. Althoughin situC mineralization was low due to the temperature constraints in winter, greater potential SOCMR indicated a higher intrinsic substrate use efficiency of winter microbes than summer ones. Our results suggested significant differences in microbial community structure and function between summer and winter. Considering the future changes in winter climate and N deposition in temperate areas, more detailed investigations of seasonal dynamics in soil microbial biomass, community structure and function including spring and autumn are urgently needed in the scenario of global changes.
Supporting Information
Table S1 Detailed summer (JUL.) and winter (JAN.) values of soil and microbial properties in Figure 2; 3; 4; 5B; 7.P1 = ,15-year Mongolia pine; P2 = ,25-year Mongolia
pine; P3 = ,35-year Mongolia pine; L1 = ,15-year Prince
Rupprecht’s larch; L2 = ,25-year larch; L3 = ,35-year larch;
BH = Birch; MA = Siberian crabapple; RO = Solitary rose; CG = Meadow grassland. DON = dissolved organic nitrogen,
Figure 6. Principal component analysis (PCA) of PLFA signa-tures (mol percentages) from soil samples collected in summer and winter.PC1 and PC2 explained 96% and 2% variance of the PLFAs data, respectively.
doi:10.1371/journal.pone.0092985.g006
Figure 7. Potential carbon mineralization rates across different sites in summer and winter. Results are presented as mean 6
MBC = microbial biomass carbon, MBN = microbial biomass nitrogen, MB = microbial biomass.
(DOCX)
Table S2 The inverse Simpson index of summer (JUL.) and winter (JAN.) PLFAs data in each sampling site.
(DOCX)
Acknowledgments
We thanked two anonymous reviewers for their very constructive and valuable comments for its early version of our manuscript.
Author Contributions
Conceived and designed the experiments: WW. Performed the experi-ments: XZ WC. Analyzed the data: XZ NZ WC. Contributed reagents/ materials/analysis tools: HZ. Wrote the paper: XZ WW.
References
1. Zhang T, Barry RG, Armstrong RL (2004) Application of satellite remote sensing techniques to f rozen ground studies. Polar Geography 28: 63–196. 2. Brooks PD, Grogan P, Templer PH Groffman P, O¨ quist MG, et al. (2011)
Carbon and nitrogen cycling in snow-covered environments. Geography Compass 5: 682–699.
3. Aanderud ZT, Jones SE, Schoolmater DRJ, Fierer N, Lennon JT (2013) Sensitivity of soil respiration and microbial communities to altered snowfall. Soil Biology and Biochemistry 57: 217–227.
4. Robroek BJ, Heijboer A, Jassey VE, Hefting MM, Rouwenhorst TG, et al. (2013) Snow cover manipulation effects on microbial community structure and soil chemistry in a mountain bog. Plant and soil 369: 151–164.
5. Romanovsky VE, Osterkamp TE (2000) Effects of unfrozen water on heat and mass transport processes in the active layer and permafrost. Permafrost and Periglacial Processes 11: 219–239.
6. Price BP, Sowers T (2004) Temperature dependence of metabolic rates for microbial growth, maintenance, and survival. Proceedings of the National Academy of Sciences 101: 4631–4636.
7. Schimel J, Balser TC, Wallenstein M (2007) Microbial stress-response physiology and its implications for ecosystem function. Ecology 88: 1386–1394. 8. Brooks PD, Williams MW, Schmidt SK (1996) Microbial activity under alpine
snowpacks, Niwot Ridge, Colorado. Biogeochemistry 3: 93–113.
9. Grogan P, Jonasson S (2005) Temperature and substrate controls on intra-annual variation in ecosystem respiration in two sub-arctic vegetation-types. Global Change Biology 11: 465–475.
10. Groffman PM, Hardy JP, Driscoll CT, Fahey TJ (2006) Snow depth, soil freezing, and fluxes of carbon dioxide, nitrous oxide and methane in a northern hardwood forest. Global Change Biology 12: 1748–1760.
11. Monson RK, Lipson DL, Burns SP, Turnipseed AA, Delany AC, et al. (2006) Winter forest soil respiration controlled by climate and microbial community composition. Nature 439: 711–714.
12. Wang W, Peng S, Wang T, Fang J (2010) Winter soil CO2efflux and its contribution to annual soil respiration in different ecosystems of a forest-steppe ecotone, north China. Soil Biology and Biochemistry 42: 451–458.
13. Edwards KA, McCulloch J, Kershaw GP (2006) Soil microbial and nutrient dynamics in a wet Arctic sedge meadow in late winter and early spring. Soil Biology and Biochemistry 38: 2843–2851.
14. Buckeridge KM, Jefferies RL (2007) Vegetation loss alters soil nitrogen dynamics in an Arctic salt marsh. Journal of Ecology 95: 283–293.
15. Drotz SH, Saparrman T, Nilsson MB, Schleucher J, O¨ quist MG (2010) Both catabolic and anabolic heterotrophic microbial activity proceed in frozen soils. Proceedings of the National Academy of Sciences 107: 21046–21051. 16. Lipson DA, Schmidt SK, Monson RK (2000) Carbon availability and
temperature control the post-snowmelt decline in alpine soil microbial biomass. Soil Biology and Biochemistry 32: 441–448.
17. Larsen KS, Grogan P, Jonasson S, Michelsen A (2007) Respiration and microbial dynamics in two subarctic ecosystems during winter and spring thaw: effects of increased snow depth. Arctic, Antarctic, and Alpine Research 39: 268– 276.
18. Edwards KA, Jefferies RL (2013) Inter-annual and seasonal dynamics of soil microbial biomass and nutrients in wet and dry low-Arctic sedge meadows. Soil Biology and Biochemistry 57: 83–90.
19. Weintraub MN, Schimel JP (2005) The seasonal dynamics of amino acids and other nutrients in Alaskan Arctic tundra soils. Biogeochemistry 73: 359–380. 20. Kaiser C, Fuchslueger L, Koranda M, Gorfer M, Stange CF, et al. (2011) Plants
control the seasonal dynamics of microbial N cycling in a beech forest soil by belowground C allocation. Ecology 92: 1036–1051.
21. Nielsen CB, Groffman PM, Hamburg SP, Driscoll CT, Fahey TJ, et al. (2001) Freezing effects on carbon and nitrogen cycling in northern hardwood forest soils. Soil Science Society of America Journal 65: 1723–1730.
22. Judd KE, Liken GE, Groffman PM (2007) High nitrate retention during winter in soils of the Hubbard Brook experimental forest. Ecosystems 10: 217–225. 23. Buckeridge KM, Grogan P (2008) Deepened snow alters soil microbial nutrient
limitations in arctic birch hummock tundra. Applied Soil Ecology 39: 210–222. 24. Turner MM, Henry HAL (2010) Net nitrogen mineralization and leaching in response to warming and nitrogen deposition in a temperate old field: the importance of winter temperature. Oecologia 62: 227–236.
25. Larsen KS, Michelsen A, Jonasson S, Beier C, Grogan P (2012) Nitrogen uptake during fall, winter and spring differs among plant functional groups in a subarctic heath ecosystem. Ecosystems 15: 929–939.
26. Schmidt SK, Costello EK, Nemergut DR, Cleveland CC, Reed SC, et al. (2007) Biogeochemical consequences of rapid microbial turnover and seasonal succession in soil. Ecology 88: 1379–1385.
27. Lipson DA, Schadt CW, Schmidt SK (2002) Changes in soil microbial community structure and function in an alpine dry meadow following spring snow melt. Microbial Ecology 43: 307–314.
28. Schadt CW, Martin AP, Lipson DA, Schmidt SK (2003) Seasonal dynamics of previously unknown fungal lineages in tundra soils. Science 301: 1359–1361. 29. Waldrop M, Balser T, Firestone M (2000) Linking microbial community
composition to function in a tropical soil. Soil Biology and Biochemistry 32: 1837–1846.
30. Sinsabaugh RL, Carreiro MM, Repert DA (2002) Allocation of extracellular enzymatic activity in relation to litter composition, N deposition, and mass loss. Biogeochemistry 60: 1–24.
31. Walder F, Niemann H, Natarajan M, Lehmann MF, Boller T, et al. (2012) Mycorrhizal networks: common goods of plants shared under unequal terms of trade. Plant physiology 159: 789–797.
32. Pokarzhevskii AD, van Straalen NM, Zaboev DP, Zaitsev AS (2003) Microbial links and element flows in nested detrital food-webs. Pedobiologia 47: 213–224. 33. McMahon SK, Wallenstein MD, Schimel JP (2009) Microbial growth in Arctic
tundra soil at22uC. Environmental Microbial Reports 1: 162–166. 34. Balser TC, Wixon DL (2009) Investigating biological control over soil carbon
temperature sensitivity. Global Change Biology 15: 2935–2949.
35. Keiblinger KM, Hall EK, Wanek W, Szukics U, Ha¨mmerle I, et al. (2010) The effect of resource quantity and resource stoichiometry on microbial carbon-use-efficiency. FEMS Microbiology Ecology 73: 430–440.
36. Lipson DA, Monson RK, Schmidt SK, Weintraub MN (2009) The trade-off between growth rate and yield in microbial communities and the consequences for under-snow soil respiration in a high elevation coniferous forest. Biogeochemistry 95: 23–35.
37. Liptzin D, Silver WL (2009) Effects of carbon additions on iron reduction and phosphorus availability in a humid tropical forest soil. Soil Biology and Biochemistry 41: 1696–1702.
38. Bond-Lamberty B, Thomson A (2010) Temperature-associated increases in the global soil respiration record. Nature 464: 579–582.
39. Wang W, Chen W, Wang S (2010) Forest soil respiration and its heterotrophic and autotrophic components: Global patterns and responses to temperature and precipitation. Soil Biology and Biochemistry 42: 1236–1244.
40. Zhou YM, Li MH, Cheng XB, Wang CG, Fan AN, et al. (2010) Soil respiration in relation to photosynthesis of quercus mongolica trees at elevated CO2. Plos one 5:e15134.
41. Yao H, Bowman D, Shi W (2011) Seasonal variations of soil microbial biomass and activity in warm-and cool-season turfgrass systems. Soil Biology and Biochemistry 43: 1536–1543.
42. Baldrian P, Vetrovsky T, Cajthaml T, Dobia´sˇova´ P, Petra´nkova´ M, et al. (2013) Estimation of fungal biomass in forest litter and soil. Fungal Ecology 6: 1–11. 43. Hayhoe K, Wake CP, Huntington TG, Luo L, Schwartz MD, et al. (2007) Past
and future changes in climate and hydrological indicators in the US Northeast. Climate Dynamics 28: 381–407.
44. Huntington TG, Richardson AD, McGuire KJ, Hayhoe K (2009) Climate and hydrological changes in the northeastern United States: recent trends and implications for forested and aquatic ecosystems. Canadian Journal of Forest Research 39: 199–212.
45. Henry HAL (2008) Climate change and soil freezing dynamics: historical trends and projected changes. Climatic Change 87: 421–434.
46. Galloway JN, Dentener FJ, Capone DG, Boyer EW, Howarth RW, et al. (2004) Nitrogen cycles: past, present, and future. Biogeochemistry 70: 153–226. 47. Kreyling J (2010) Winter climate change: a critical factor for temperate
vegetation performance. Ecology 91: 1939–1948.
48. Pietika˚inen J, Pettersson M, Ba˚a˚th E (2005) Comparison of temperature effects on soil respiration and bacterial and fungal growth rates. FEMS Microbiology Ecology 52: 49–58.
49. Kramer C, Gleixner G (2006) Variable use of plant- and soil-derived carbon by microorganisms in agricultural soils. Soil Biology and Biochemistry 38: 3267– 3278.
51. Bjork RG, Bjorkman MP, Andersson MX, Klemedtsson L (2008) Temporal variation in soil microbial communities in Alpine tundra. Soil Biology and Biochemistry 40: 266–268.
52. Lipson DA, Schmidt SK (2004) Seasonal changes in an alpine soil bacterial community in the Colorado Rocky Mountains. Applied and environmental microbiology 70: 2867–2879.
53. Bradley RL, Fyles JW (1995) Growth of paper birch (Betula papyrifera) seedling increases soil available C and microbial acquisition of soil nutrients. Soil Biology and Biochemistry 27: 1565–1571.
54. Schumacher BA (2002) Methods for the determination of the total organic carbon (TOC) in soils and sediments. National ESD, ed. U.S. Environmental Protection Agency, Washington DC.
55. Ruzicka J (1983) Flow Injection Analysis – From Test Tube to Integrated Microconduits. Analytical Chemistry 55: 1040A–1053A.
56. Brookes PC, Landman A, Pruden G, Jenkinson DS (1985) Chloroform fumigation and the release of soil nitrogen- A rapid direct extraction method to measure microbial biomass nitrogen in soil. Soil Biology and Biochemistry 17: 837–842.
57. Ross DJ (1990) Estimation of soil microbial C by a fumigation-extraction method: influence of seasons, soils and calibration with the fumigation-incubation procedure. Soil Biology and Biochemistry 22: 295–300.
58. Bossio DA, Scow KM (1998) Impacts of carbon and flooding on soil microbial communities: phospholipid fatty acid profiles and substrate utilization patterns. Microbial Ecology 35: 265–278.
59. Zelles L (1997) Phospholipid fatty acid profiles in selected members of soil microbial communities. Chemosphere 35: 275–294.
60. Fierer N, Schimel JP, Holden PA (2003) Variations in microbial community composition through two soil depth profiles. Soil Biology and Biochemistry 35: 167–176.
61. Frostega˚rd A˚ , Ba˚a˚th E, Tunlio A (1993) Shifts in the structure of soil microbial communities in limed forests as revealed by phospholipid fatty acid analysis. Soil Biology and Biochemistry 25: 723–730.
62. Zogg GP, Zak DR, Ringelberg DB, White DC, MacDonald NW, et al. (1997) Compositional and functional shifts in microbial communities due to soil warming. Soil Science Society of America Journal 61: 475–481.
63. Gutknecht JL, Field CB, Balser TC (2012) Microbial communities and their responses to simulated global change fluctuate greatly over multiple years. Global Change Biology 18: 2256–2269.
64. Winkler JP, Cherry RS, Schlesinger WH (1996) The Q10 relationship of microbial respiration in a temperate forest soil. Soil Biology and Biochemistry 28: 1067–1072.
65. Anderson JPE (1982) Soil respiration, In Methods of Soil Analysis, Part 2. Chemical and Microbiological Properties. Soil Science Society of America, Madison: 831–871.
66. Mielke PW (1984) Meterological applications of permutation techniques based on distance functions. In: Krishnaiah PR, Sen PK (eds) Handbook of statistics, vol 4New YorkElsevier Science Publishers
67. Mielke PW, Berry KJ (2001) Permutation methods: a distance function approach. Springer, Berlin Heidelberg New York.
68. Schimel JP, Bilbrough C, Welker JM (2004) Increased snow depth affects microbial activity and nitrogen mineralization in two Arctic tundra communi-ties. Soil Biology and Biochemistry 36: 217–227.
69. Schimel J P, Weintraub M N (2003) The implications of exoenzyme activity on microbial carbon and nitrogen limitation in soil: a theoretical model. Soil Biology and Biochemistry 35: 549–563.
70. Mariko S, Nishimura N, Mo W (2000) Winter CO2flux from soil and snow surfaces in a cool-temperate deciduous forest, Japan. Ecological Research 15: 363–372.
71. Uchida M, Mo W, Nakatsubo T (2005) Microbial activity and litter decomposition under snow cover in a cool-temperate broad-leaved deciduous forest. Agricultural and Forest Meteorology 134: 102–109.
72. Schimel JP, Fahnestock J, Michaelson G (2006) Cold-season production of CO2 in arctic soils: can laboratory and field estimates be reconciled through a simple modeling approach? Arctic, Antarctic and Alpine Research 38: 249–256. 73. Fierer N, Strickland MS, Liptzin D, Bradford MA, Cleveland CC (2009) Global
patterns in belowground communities. Ecology Letters 12: 1238–1249. 74. Cleveland CC, Liptzin D (2007) C: N: P stoichiometry in soil: is there a
‘‘Redfield ratio’’ for the microbial biomass? Biogeochemistry 85: 235–252. 75. Rovira AD (1969) Plant root exudates. The Botanical Review 35: 35–57. 76. Strickland MS, Rousk J (2010) Considering fungal: bacterial dominance in soils–
Methods, controls, and ecosystem implications. Soil Biology and Biochemistry 42: 1385–1395.
77. Cardon ZG, Hungate BA, Cambardella CA, Chapin III FS, Field CB, et al. (2001) Contrasting effects of elevated CO2 on old and new soil pools. Soil Biology and Biochemistry 33: 365–373.
78. Liu LL, Kong JS, Booker FL, Giardina CP, Lee AH, et al. (2009) Enhanced litter input rather than changes in litter chemistry drive soil carbon and nitrogen cycles under elevated CO2: a microcosm study. Global Change Biology 15: 441– 453.
79. Schimel JP, Mikan C (2005) Changing microbial substrate use in Arctic tundra soils through a freeze-thaw cycle. Soil Biology and Biochemistry 37: 1411–1418. 80. Haei M, Rousk J, Ilstedt U, O¨ quist M, Ba˚a˚th E, et al. (2011) Effects of soil frost on growth, composition and respiration of the soil microbial decomposer community. Soil Biology and Biochemistry 43: 2069–2077.
81. Wallenstein MD, McMahon S, Schimel J (2007) Bacterial and fungal community structure in Arctic tundra tussock and shrub soils. FEMS Microbiology Ecology 59: 428–435.
82. Wallenstein MD, McMahon SK, Schimel JP (2009) Seasonal variation in enzyme activities and temperature sensitivities in Arctic tundra soils. Global Change Biology 15: 1631–1639.
83. Schindlbacher A, Rodler A, Kuffner M, Kitzler B, Sessitsch A, et al. (2011) Experimental warming effects on the microbial community of a temperate mountain forest soil. Soil Biology and Biochemistry 43: 1417–1425. 84. Boer WD, Folman LB, Summerbell RC, Boddy L (2005) Living in a fungal
world: impact of fungi on soil bacterial niche development. FEMS microbiology reviews 29: 795–811.