The Antipsychotic Olanzapine Interacts
with the Gut Microbiome to Cause Weight
Gain in Mouse
Andrew P. Morgan1,5., James J. Crowley1., Randal J. Nonneman1
,
Corey R. Quackenbush1, Cheryl N. Miller2, Allison K. Ryan1, Molly A. Bogue6, Sur Herrera Paredes3,5, Scott Yourstone3,5, Ian M. Carroll4,7, Thomas H. Kawula2, Maureen A. Bower7, R. Balfour Sartor4,7, Patrick F. Sullivan1,8*
1.Departments of Genetics, University of North Carolina at Chapel Hill, Chapel Hill, North Carolina, United States of America,2.Department of Microbiology and Immunology, University of North Carolina at Chapel Hill, Chapel Hill, North Carolina, United States of America,3.Department of Biology, University of North Carolina at Chapel Hill, Chapel Hill, North Carolina, United States of America,4.Department of Medicine, University of North Carolina at Chapel Hill, Chapel Hill, North Carolina, United States of America,5.Curriculum in Bioinformatics and Computational Biology, University of North Carolina at Chapel Hill, Chapel Hill, North Carolina, United States of America,6.The Jackson Laboratory, Bar Harbor, Maine, United States of America, 7.Center for Gastrointestinal Biology and Disease, University of North Carolina at Chapel Hill, Chapel Hill, North Carolina, United States of America,8.Department of Psychiatry, University of North Carolina at Chapel Hill, Chapel Hill, North Carolina, United States of America
.These authors contributed equally to this work.
Abstract
The second-generation antipsychotic olanzapine is effective in reducing psychotic symptoms but can cause extreme weight gain in human patients. We investigated the role of the gut microbiota in this adverse drug effect using a mouse model. First, we used germ-free C57BL/6J mice to demonstrate that gut bacteria are necessary and sufficient for weight gain caused by oral delivery of olanzapine. Second, we surveyed fecal microbiota before, during, and after treatment and found that olanzapine potentiated a shift towards an ‘‘obesogenic’’ bacterial profile. Finally, we demonstrated that olanzapine has antimicrobial activityin vitro against resident enteric bacterial strains. These results collectively provide strong evidence for a mechanism underlying olanzapine-induced weight gain in mouse and a hypothesis for clinical translation in human patients.
OPEN ACCESS
Citation:Morgan AP, Crowley JJ, Nonneman RJ, Quackenbush CR, Miller CN, et al. (2014) The Antipsychotic Olanzapine Interacts with the Gut Microbiome to Cause Weight Gain in Mouse. PLoS ONE 9(12): e115225. doi:10.1371/journal.pone. 0115225
Editor:Markus M. Heimesaat, Charite´, Campus Benjamin Franklin, Germany
Received:September 3, 2014
Accepted:November 20, 2014
Published:December 15, 2014
Copyright:ß2014 Morgan et al. This is an open-access article distributed under the terms of the Creative Commons Attribution License, which permits unrestricted use, distribution, and repro-duction in any medium, provided the original author and source are credited.
Data Availability:The authors confirm that all data underlying the findings are fully available without restriction. Sequencing data have been deposited in the NCBI Short Read Archive under BioProject PRJNA264871.
Funding:The work was supported by the following: National Institute of Mental Health #R21MH097173 (JJC, PFS), #K01MH094406 (JJC); National Institute of Diabetes, Digestive and Kidney Diseases #P30DK034987, P40OD010995, P30DK056350 (RBS); National Institute of General Medical Sciences #T32GM067553, T32GM008719 (APM); and Howard Hughes Medical Institute International Student Research Fellowship (SHP). URLs: NIMHhttp://www.nimh.nih.gov/; NIDDK http://www.niddk.nih.gov/; NIGMShttp://www. nigms.nih.gov/; HHMIhttps://www.hhmi.org/. The funders had no role in study design, data collection and analysis, decision to publish, or preparation of the manuscript.
Introduction
The second-generation (‘‘atypical’’) antipsychotic drug olanzapine is commonly prescribed as a first-line treatment for schizophrenia, bipolar disorder, and other psychotic disorders. Since their introduction in the 1990s, olanzapine and other atypical antipsychotics have come into widespread clinical use because they are efficacious and usually lack the extrapyramidal adverse drug reactions associated with older, ‘‘typical’’ antipsychotics like haloperidol [1,2]. However, atypical antipsychotics can induce dramatic weight gain: 11–17 kg in a systematic review of treatment-nai¨ve adults [3] and 7–9 kg in adolescents over short-term treatment [4]. Olanzapine in particular is associated with a deterioration of metabolic parameters and development of a syndrome resembling type 2 diabetes [3–6].
Individuals with schizophrenia are less physically healthy than the general population, with life expectancy reduced by as much as 25 years [3,7–9]. Cardiovascular disease is a leading cause of death in schizophrenia [3,9]: tobacco use, poor diet, and socioeconomic disparities conspire to create a profoundly unfavorable cardiovascular risk profile that is compounded by weight gain and the metabolic side effects of antipsychotic drugs. Understanding the mechanisms [10– 13] of these adverse drug reactions and developing mitigating strategies are of considerable clinical importance [14].
The role of the commensal microbiome of the mammalian gut in health and disease has become a topic of intense study. Bacterial concentrations can be as high as 1011 cells/mL in the distal gut, encompassing a gene repertoire 150 times larger than that of the human host [15] with broad-ranging metabolic capacity [16,17]. Millions of years of coevolution have shaped the metabolic capacity of the gut microbiome and its human host [18]. Recent studies in animal models and humans have demonstrated a causal role for the gut microbiome in obesity [19–24], which is mediated by complex interactions with host environment [25,26], diet [21,27] and genetics [25,28].
Materials and Methods
Olanzapine administration
Olanzapine was compounded into high fat (45 kcal%) food (diet D09092903) at a concentration of 50 mg/kg of diet by Research Diets, Inc (New Brunswick, NJ). This dose was selected following a four-week dose-ranging study in C57BL/6J mice (0, 12.5, 25, 50, 100 mg/kg), since it produced steady-state plasma levels (21¡5 ng/ml) closest to the clinically relevant range (10–50 ng/mL; seeS2 Figure and [32]). Plasma olanzapine levels were measured using the liquid chromato-graphy/tandem mass spectrometry (LC-MS/MS) method of Zhang et al. [33]. Placebo-treated animals received the same high fat diet (D09092903), minus olanzapine, prepared in parallel to control for batch effects.
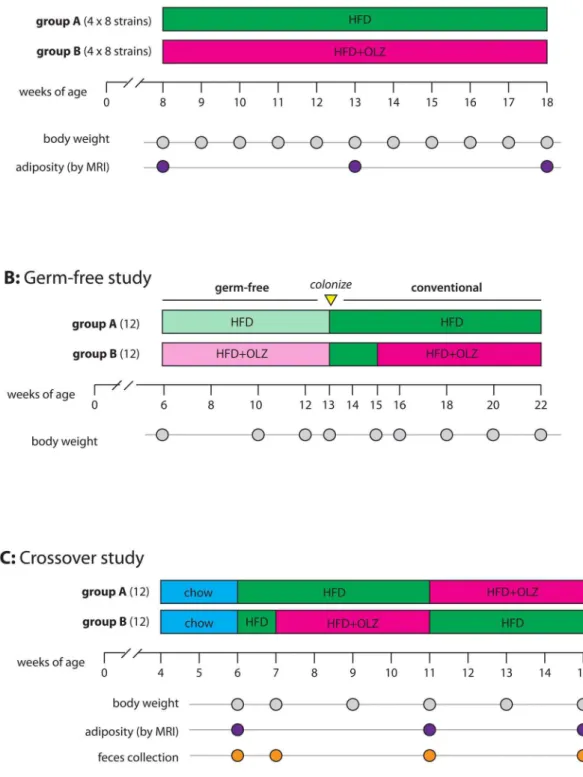
Strain survey
For the strain survey (Fig. 1A), n58 female mice (aged 6 weeks) from each of eight inbred strains (A/J, C57BL/6J, 129S1SvlmJ, NOD/ShiLtJ, NZO/HlLtJ, CAST/ EiJ, PWK/PhJ, WSB/EiJ) were acquired from the Jackson Laboratory (Bar Harbor, ME). All mice were maintained on standard chow (Purina Prolab RMH3000, 14 kcal% fat) until 8 weeks of age and then switched to high fat diet¡olanzapine for 10 weeks. There was one cage of olanzapine-treated mice (n54) and one cage of placebo-treated mice (n54) for each strain. Animals were maintained on a 14-hour light, 10-14-hour dark schedule with lights on at 0600. The housing room was maintained at 20–24
˚
C with 40–50% relative humidity. Mice were group-housed (4 per cage) in standard 20 cm630 cm ventilated polysulfone cages with laboratory grade Bed-O-Cob bedding. Water and feed were available ad libitumthroughout the experiment.
Germ-free study
Crossover study
For the crossover study (Fig. 1C), n524 female C57BL/6J mice (aged 4 weeks) were acquired from the Jackson Laboratory. Upon arrival in the facility, animals were randomly assigned to cages (4 mice per cage), and cages randomized to study arms (group A or group A; 3 cages per group). Both groups were fed standard chow from 4–6 weeks of age, then both groups were switched to high-fat diet for 1 week. For weeks 8–11, group A received placebo and group B received olanzapine. During weeks 12–15, groups were swapped so that group A received olanzapine and group B received no drug. All mice received the high-fat diet from week 7 to the conclusion of the study.
Collection of metabolic phenotypes
Body weight (¡0.1 g) was measured weekly for the strain survey, biweekly in the germ-free isolator, and biweekly for the crossover study, always between the hours of 0800–1000. Body composition (fat, lean, and water mass ¡0.01 g) was measured in un-anaesthetized mice using a quantitative magnetic resonance body composition analyzer [35] (EchoMRI, Houston, TX, USA). Adiposity (% body fat) was calculated as 1006 (fat weight)/(total body weight).
Ethics statement
This study was carried out in strict accordance with the recommendations in the Guide for the Care and Use of Laboratory Animals of the National Institutes of Health. The protocols were approved by the Institutional Animal Care and Use Committee of the University of North Carolina at Chapel Hill (protocol numbers: 11–318.0, 11–320.0).
Bacterial growth-inhibition assays
Escherichia coli NC101 and Enterococcus fecalis OGIRF were grown shaking overnight at 37
˚
C in brain heart infusion (BHI) broth supplemented with 1% IsoVitalex (Becton-Dickson). Overnight cultures were resuspended in phosphate-buffered saline (PBS) to a Klett reading of 100 (approximately 16109 CFU/ml). Resuspended cultures were diluted 1:20 in a 96 well plate with a range of olanzapine concentrations (0–580 mg ml21). Olanzapine is insoluble in BHI so DMSO was added and used as a control (17.5% of the culture volume). Growth curves were performed at 37˚
C while shaking in an Infinite M200 (Tecan) apparatus in 96-well microtiter plates with absorbance (optical density at 600 nm, OD600) monitored every 15 min. Minimal inhibitory concentrations were For weeks 8–11, group A was maintained on high-fat diet and group B was switched to HFD plus OLZ. For weeks 12–15, groups were swapped so that group A received OLZ and group B received no drug. Body weight and adiposity phenotypes were collected at the indicated time points. Fecal pellets were collected for microbiome profiling at time points indicated by orange dots.determined by identifying the lowest concentration of olanzapine that inhibited growth and did not exceed an OD600of 0.2.
Gut microbiome sampling
Fecal samples were collected from the 24 mice in the crossover at 4 different time points (Fig. 1C, a total of 96 samples), in order to follow individual changes in the microbiome resulting from diet and drug treatment. Fresh fecal pellets were collected by transferring an individual mouse to a clean cage for 5 minutes, collecting 3–5 pellets into a microcentrifuge tube with sterile forceps, snap freezing on dry ice and storing at 280
˚
C. Bacterial DNA was extracted using a PowerSoil 96-well DNA isolation kit (MO BIO Laboratories, Inc; Carlsbad, CA) on an automated pipetting system (epMotion 5075; Eppendorf AG; Hamburg, Germany).Hypervariable region 4 (V4) of the 16S ribosomal RNA subunit gene was amplified by the molecule-tagged PCR method [36] Briefly, this technique adds a unique oligonucleotide sequence (the ‘‘molecular tag’’) to each template molecule in the first round of amplification so that PCR artifacts are readily identified and corrected in downstream analyses. A 96-plex barcoded library was prepared using the Illumina Nextera chemistry (Illumina Inc; San Diego, CA). Samples were randomly allocated to barcodes. The library was sequenced in a single 26250 bp paired-end run on the Illumina MiSeq platform. Standard preprocessing and demultiplexing of sequence reads was performed using the CASAVA v1.8.2 software from Illumina. Library preparation, sequencing and preprocessing were performed by staff at the University of North Carolina High-Throughput Sequencing Facility. Raw sequence reads have been deposited in the NCBI Short Read Archiveunder BioProject PRJNA264871.
Sequence reads were processed using the MT_MTToobox software of Lundberg
et al. (https://sites.google.com/site/moleculetagtoolbox). This pipeline merges raw reads into consensus sequences representing a single template (via its molecular tag), thus detecting and removing PCR chimeras and amplification artifacts; counts read abundance within each consensus group; and bins consensus sequences into operational taxonomic units (OTUs) at a 97% sequence similarity threshold. OTUs were assigned a taxonomic identity with the RDP classifier [37] trained on the most recent release (4 February 2011) of the Los Alamos National Laboratory’s GreenGenes taxonomic reference (gg_97_otus_4feb2011), using the scripts in the QIIME v1.5.0 package [38]. Consensus sequences for the OTUs were aligned using PyNAST [39] (via QIIME) guided by the aforementioned
Statistical analysis
In order to account for the several levels of correlation present in this experiment, we analyzed changes in body weight, adiposity and microbial parameters using generalized linear mixed models (GLMMs) as implemented in the R package lme4 (http://lme4.r-forge.r-project.org). Between-group differences in overall micro-biota composition were assessed by PERMANOVA [42] as implemented in the R package vegan (http://vegan.r-forge.r-project.org), and visualized using non-metric multidimensional scaling as implemented in the R package MASS [43]. Further details regarding statistical methods are provided in S1 Notes.
Results
Olanzapine potentiates weight gain on high-fat diet
To develop a model for olanzapine-induced weight gain in mouse, we surveyed eight inbred strains (A/J, C57BL/6J, 129S1SvlmJ, NOD/ShiLtJ, NZO/HlLtJ, CAST/ EiJ, PWK/PhJ, WSB/EiJ) which are the founder strains of the Collaborative Cross population [44]. Eight females from each strain were randomized to receive either olanzapine (compounded into feed at 50 mg/kg) or placebo and were fed a high-fat diet ad libitum(Fig. 1A). The rate of weight gain and the effect of olanzapine were highly variable between strains (S1A Figure). Plasma olanzapine levels were measured after 18 weeks of treatment (S1B Figure). C57BL/6J mice were highly susceptible to olanzapine-induced weight gain, gaining a mean of 17.1% over
Fig. 2. Effect of high-fat diet plus olanzapine (OLZ; filled circles) versus placebo (PLA; open circles) on body weight in germ-free mice.Points in the left-hand third represent observations under germ-free conditions. The first dashed line marks the beginning of the drug-free conventionalization period (with colonization by gavage) and the second dashed line marks the resumption of treatment under conventional conditions. Each point represents the mean across 12 mice; error bars are¡2 standard error.
initial body weight (95% CI 13.6–20.6%, p51.0661025) and were therefore selected for further study. A dose-response study was conducted in C57BL/6J mice order to titrate drug dosage to a clinically-relevant level (S2 Figure). The plasma concentration in which olanzapine has the greatest effect on body weight and adiposity (10–25 ng/mL) corresponds with the therapeutic range in human patients [32].
Gut microbiota is necessary and sufficient for olanzapine-induced
weight gain
To investigate the role of the gut microbiota in olanzapine-induced weight gain, 24 female C57BL/6J mice were raised in germ-free conditions (Fig. 1B). At 6 weeks of age, 12 mice were randomized to high-fat diet plus olanzapine (50 mg/ kg) and 12 to high fat diet alone. After 7 weeks of treatment in germ-free conditions, no significant difference in body weight was observed between groups (Fig. 2; 95% CI for difference20.75–1.61 grams;p50.478). Under conventional conditions in the strain survey (S1A Figure), olanzapine-treated C57BL/6J females had gained 4.6 grams more than untreated mice (95% CI for difference 1.67–7.48 grams; p58.8161023) during the first 7 weeks of treatment. Mice were then transferred to conventional housing and gavaged with a slurry of cecal contents from a female C57BL/6J donor mouse. Following a 2-week acclimation period, treatment was resumed for another 7 weeks, during which the olanzapine group gained significantly more weight than placebo group (Fig. 2; 95% CI for
difference 1.33–5.75 grams; p54.961023). These results demonstrate that gut microbiota are both necessary and sufficient for weight gain induced by olanzapine in the context of a high-fat diet.
Interrogating the gut microbiota and weight using a crossover
design
To study the effects of olanzapine on the gut microbiome, 24 six-week-old female C57BL/6J mice raised on regular mouse chow in conventional conditions consumed a high-fat diet for 2 weeks, and then randomized to receive either 4 weeks of high-fat diet plus placebo (group A) or 4 weeks of high-fat diet plus olanzapine (group B). After 4 weeks the treatments were switched. Total body weight and adiposity were measured periodically throughout (Fig. 1C). Weight gain during the olanzapine phase (shaded interval inS3A Figure) was more rapid than during the placebo phase (95% CI 2.9–10.9% increase over initial weight,
Fecal pellets were collected from each mouse before, during and after initiation of the high-fat diet and olanzapine treatment (4 temporally-matched samples per mouse, Fig. 1C). Gut microbiota were surveyed by high-throughput sequencing of the bacterial 16S ribosomal RNA gene, a widely-used marker gene in microbial ecology. The resulting sequences were clustered into a total of 8067 operational taxonomic units (OTUs) and were identified and classified at the family level, of which a median of 612 were present per individual sample. Further details of the
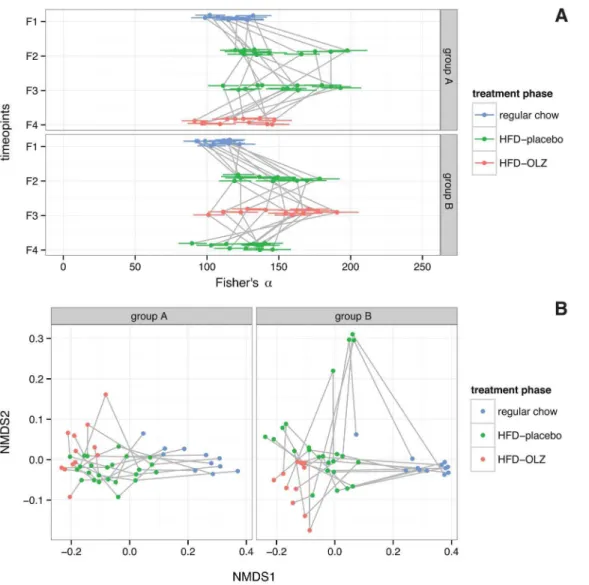
Fig. 3. Effect of high-fat diet (HFD) and olanzapine (OLZ) treatment on diversity of gut microbiota during crossover study.(A) Within-subject (a) diversity, quantified by Fisher’sa[45]; larger values indicate greater diversity (n595 samples54 time points624 subjects – 1 failed sample). Panels are split by study arm (seeError! Reference source not found.) and points are colored according to diet and treatment status: on regular chow prior to initiation of HFD (regular), during treatment with placebo (HFD-placebo) or during treatment with OLZ (HFD-OLZ). Each point represents a single individual and bars indicate 95% confidence intervals about the point estimates; observations on the same subject are connected by a grey line. (B) Between-subjects (b) diversity (n595 samples54 time points624 subjects – 1 failed sample). Pairwise distances between samples were calculated using weighted UniFrac and
visualized using non-metric multidimensional scaling along two axes, which together explain 98% of between-subjects variance. Observations on the same subject are connected by a grey line.
Table 1.PERMANOVA decomposition ofb-diversity as measured by UniFrac.
Term df SS‘ F# R2 p-value
Weighted UniFrac cage 5 0.3537 3.843 0.0728 0.0004
diet 1 2.2813 123.94 0.46954 ,1.0061024
time point 2 0.5435 14.762 0.11185 ,1.0061024
drug 1 0.1156 6.278 0.02378 0.0028
Residuals 85 1.5646 0.32202
Total 94 4.8586
Unweighted UniFrac cage 5 1.279 1.944 0.07742 ,1.0061024
diet 1 2.7293 20.7412 0.16519 ,1.0061024
time point 2 1.096 4.1644 0.06634 ,1.0061024
drug 1 0.2325 1.767 0.01407 0.021
Residuals 85 11.1849 0.67698
Total 94 16.5217
*df, degrees of freedom;‘SS, Sum of squares;#F, pseudo-F-statistic.
doi:10.1371/journal.pone.0115225.t001
Fig. 4. Compositional shifts in gut microbiota induced by high-fat diet (HFD) and olanzapine (OLZ) during crossover study.(A) Colored blocks show relative abundance of specific bacterial classes during treatment with OLZ (HFD-OLZ) or placebo (HFD-placebo), pooled across individuals in each of the two study arms (n53 time points624 subjects). (B) Effect of OLZ on relative abundance of specific taxa, expressed as confidence intervals (at nominal
significance levela50.05) about the mean fold-change in relative abundance. Taxa with a statistically-significant increase are shown in red, and those with a significant decrease in blue. (C) Effect of relative abundance of specific taxa on weight gain, expressed as confidence intervals (at nominal significance level
sequencing protocol, analysis, and bioinformatics are provided in supplementary material.
Olanzapine and high-fat diet act synergistically on gut microbiota
The switch to high-fat diet was associated with a modest increase in within-sample microbial diversity (a-diversity) after adjusting for temporal and co-housing effects (Fisher’s a[45], 95% CI 23.5–43.1 additional units, p54.0261028), but this effect varied between mice (Fig. 3A). Olanzapine treatment decreased a -diversity, but the effect was not significant after adjusting for temporal and co-housing effects (p50.449).Between-samples (b) diversity was measured by weighted and unweighted UniFrac metrics, complementary phylogenetically-scaled multivariate distance metrics [41]. In the weighted UniFrac analysis (Fig. 3B, which is sensitive to the presence/absence of OTUs and differences in abundance between samples, the high-fat diet effect accounts for 46.9% of variance (permutation p,1.0061024; Table 1), while the olanzapine treatment effect explains 2.4% (permutation
p50.0028). Within-groups dispersion was not different in the regular chowvs. high-fat diet or high-fat diet-placebo vs. high-fat diet-olanzapine comparisons. Unweighted UniFrac results are presented in S5 Figure and discussed in supplementary material.
Fig. 5. Effect of olanzapine (OLZ) on growth ofEscherichia coliNC101 andEnteroccoccus faecalis
OGIRFin vitro.Bacterial growth is measured as optical density at 600 nm wavelength. Measurements of growth in rich medium (brain heart infusion, BHI) plus vehicle (dimethylsulfoxide) only is included as a control. Each line represents the mean of three independent experiments.
Gut microbiota composition for mice treated with olanzapine or placebo while receiving a high-fat diet is presented inFig. 4A(in aggregate) andS6 Figure(per individual). Olanzapine treatment induced an increase in the relative abundance of members of class Erysipelotrichi from phylum Firmicutes (95% CI 1.7–3.4%, adjusted p52.6361026) and class Gammaproteobacteria from phylum
Proteobacteria (95% CI 0.079–0.45%, adjustedp53.1161022), and a decrease in class Bacteroidia from phylum Bacteroidetes (95% CI 25.3–21.2%, adjusted
p52.0661022) (Fig. 4B). This pattern has previously been associated with obesity in mouse and human [19,24].
Gut microbiota composition is correlated with weight gain
Relationship between relative abundance of specific bacterial taxa and weight gain during olanzapine treatment was assessed using linear mixed-effects models (Fig. 4C). The relative abundance of members of class Erysipelotrichi increased with olanzapine treatment and was associated with more rapid weight gain (0.71% increase in weight per 1% increase in abundance, 95% CI 0.33–1.10,
p55.4561023). Class Actinobacteria, for which a drug effect was not noted, was also associated with weight gain (4.9% increase in weight per 1% increase in abundance, 95% CI 2.3–7.7, p55.4461023).
Olanzapine has direct and specific antimicrobial action
in vitro
We tested the effects of olanzapine on growth of two commensal enteric bacterial strains (Escherichia coliNC101 andEnterococcus faecalisOGIRF) across a range of supraphysiologic concentrations (280 mg/mL to 560 mg/mL) in vitro. These two strains were chosen because they represent highly abundant species from two of the dominant phyla (E. coli: Proteobacteria; E. faecalis: Firmicutes) of the mammalian gut. Susceptibility to olanzapine differs between the two species as shown in Fig. 5. Growth of E. coli is completely inhibited by 537mg/mlolanzapine, while growth ofE. faecalisshows a delay in reaching log-phase growth but not complete growth arrest.
Discussion
weight gain. Finally and surprisingly, we find that olanzapine has antibiotic activity for two common resident bacterial species in vitro. To our knowledge, these results provide the first description of an adverse drug effect mediated by the commensal microbiome.
Weight gain was initially measured in the eight inbred mouse strains that are the founders of the Collaborative Cross [44,46]. Consistent with observations in human studies, the survey revealed variation in both magnitude and reprodu-cibility of olanzapine-induced weight gain between strains during high-fat feeding, independent of steady-state drug concentrations. This indicates that susceptibility to weight gain has a genetic component amenable to dissection via the
Collaborative Cross or its sister resource, the Diversity Outbred stock [47]. The composition of the gut microbiota has been shown to be heritable and genetically complex [28]. In contrast to previous experiments in outbred rats [11,30,31], we studied isogenic mice. The degree of inter-individual variability observed in changes to the gut microbiota is therefore striking (Fig. 3, S6 Figure). A portion of this variability is probably technical artifact, [48] but true stochastic effects almost certainly make important additional contributions [49], which we detect as temporal and cage effects (Table 1). The large bloom in
Verrucomicrobiae in three cages at the fourth fecal-sampling time point (S6 Figure) may be an example and is consistent with observations that the microbiota of co-housed mice tend to converge over time [25,49]. Finally, the maternal microbiota and the post-weaning environment can influence the composition of the gut microbiota during the initial period of colonization [50]. Although we do not directly control for maternal effects, our use of careful randomization of mice to cages and to study arms minimized confounding due to early-life exposures.
The specific alterations in gut community composition that we attribute to olanzapine are similar to those attributed to high-fat diet [19,21,22,30,31]. This is immediately evident from the NMDS plot in Fig. 3: observations during placebo and olanzapine treatment phases vary along the same dimension as observations during feeding with regular chow and observations during high-fat feeding, although the effect of diet appears to predominate. That the effect sizes for both high-fat diet (46.9%vs.16.5% variance explained) and olanzapine (2.4%
vs.1.4%) are greater in the weighted than unweighted UniFrac analyses (Table 1) suggests that drug- and diet-induced alterations in community structure are more quantitative than qualitative. Relative abundance of class Erysipelotrichi (phylum Firmicutes) and class Gammaproteobacteria (phylum Proteobacteria) increased during olanzapine treatment, while relative abundance of members of class Bacteroidia (phylum Bacteroidetes) decreased. An identical pattern has previously been associated with the switch from low-fat chow to a high-fat ‘‘Western diet’’ in mice with humanized gut microbiota [22]. Both Erysipelotrichi and
Gammaproteobacteria have been associated with non-alcoholic fatty liver disease independently of weight gain in human [51,52] and mouse [53]. Class
to be enriched in lean members of twin pairs discordant for obesity, and its leanness-promoting effects were transmissible [24]. Collectively these associations indicate that olanzapine induces a shift towards a microbiota that has been demonstrated in both mouse and human to promote weight gain. However, we note that the composition of gut bacterial communities is an imperfect proxy for their metabolic capacity [50]; further studies will be required to elucidate functional consequences of olanzapine treatment.
Finally we demonstrate that olanzapine has direct antibacterial activityin vitro
against two bacterial isolates (E. coli NC101 andE. faecalisOGIRF) derived from the mammalian gut (Fig. 5). Olanzapine undergoes enterohepatic recycling, and an autopsy report found that olanzapine was concentrated by one to two orders of magnitude in bile relative to the blood [54]. Local concentrations along the gut lumen – from the duodenum to the distal colon – may thus far exceed steady-state plasma levels. Although the microbial ecology of the gut is far too complex to allow robust predictions from experiments with two bacterial strains tested in isolation, our data supply proof of principle for the idea that olanzapine may directly perturb the luminal enteric community. The EC50 metric is suited to attempts to eradicate microbial pathogens; we hypothesize that therapeutic doses of olanzapine, while well below estimated EC50, still provide a subtle selective pressure that nudges the ecology of the gut towards an obesogenic composition. Indeed, other antipsychotic drugs and their metabolites have antimicrobial activity in vitro: for instance, chlorpromazine against Mycobacterium tuberculosis
[55] and thioridazine against a methicillin-resistant Staphylococcus aureus isolate [56].
Germ-free animals provide a means for establishing causality in microbiome studies. The absence of excess weight gain with olanzapine administration under germ-free conditions demonstrates that the gut microbiota are required for this drug effect. The rapid appearance of a weight gap in the olanzapine-treated group following inoculation of all mice with cecal contents from a single donor demonstrates that the gut microbiota are sufficient for the drug effect. Complex bidirectional interactions occur between the brain, endocrine system, enteric nervous system, gut epithelium and microbiota in both rodents and humans [57], and olanzapine may perturb this ‘‘brain-gut-enteric microbiota’’ axis.
Nonetheless, whether the causal pathway is direct or indirect, the enteric microbiota must mediate the effects of olanzapine on body weight.
which undergo enterohepatic circulation. The gut microbiota represents both a biomarker and potential therapeutic target for drug-induced weight gain.
Supporting Information
S1 Figure. Survey of effects of orally-administered olanzapine (OLZ) on eight inbred mouse strains. (A) Weight gain during 80 days of OLZ treatment versus placebo in female mice from eight inbred laboratory strains (n54 OLZ-treated and 4 placebo-treated mice per panel). OLZ was compounded into mouse feed at 50 mg/kg, and all mice were fed a high-fat diet ad libitum. (B) Plasma OLZ levels after 18 weeks of treatment, by strain.
doi:10.1371/journal.pone.0115225.s001 (EPS)
S2 Figure. Dose titration for oral administration of olanzapine in female C57BL/6J mice. (A) Plasma olanzapine (OLZ) concentration measured by LC-MS/MS (49)vs.concentration in mouse food (n55 subjects). Grey shaded region indicates target dose in human patients. (B) Dose-response relationship for OLZ and two metabolic parameters, body weight (in grams) and adiposity (fat mass as percentage of total body weight). Points indicate rate of increase per day in each metabolic parameter, estimated by ordinary least-squares regression. Vertical bars represent 95% confidence intervals (obtained by likelihood profiling) for the drug-effect estimates.
doi:10.1371/journal.pone.0115225.s002 (EPS)
S3 Figure. Effects of olanzapine (OLZ) treatment on weight gain and adiposity. (A) Weight gain over 9 weeks in female C57BL/6J mice fed a high-fat diet (HFD)
ad libitum. Each line represents a single mouse (n524 subjects); mice were 6 weeks of age at initiation of HFD. Grey shaded intervals indicate period of OLZ treatment. (B) Adiposity (percent body fat) during OLZ versus HFD-placebo phase at matched time points (n548 or 2 observations624 subjects). (C) Adiposity (percent body fat) versus body weight during HFD-placebo (open circles) or HFD-OLZ (filled circles) phase. Pearson’s r50.819 (95% CI 0.697– 0.895) on n572 (3 observations624 subjects).
doi:10.1371/journal.pone.0115225.s003 (EPS)
S4 Figure. Inter-individual variability in effect of olanzapine (OLZ) on weight gain (n524 subjects).At left, confidence intervals for posterior mode of subject-specific offset (eg. baseline weight differences); at right, confidence intervals for subject-specific OLZ effect, which represent deviations from the overall mean OLZ effect.
doi:10.1371/journal.pone.0115225.s004 (EPS)
S5 Figure. Between-subjects (b) diversity by unweighted UniFrac (n595 samples54 time points624 subjects – 1 failed sample), visualized using non-metric multidimensional scaling.Panels are split by study arm (seeFig. 1C) and observations on the same subject are connected by a grey line.
S6 Figure. Time series of gut microbiota composition at the individual level. Colored regions show relative abundance, per subject, of specific bacterial classes at each of the experiment’s four time points (seeFig. 1C). Subjects are grouped by study arm (left, A; right, B) and cage (numbered sequentially, 1–6) as indicated in the bar above each panel.
doi:10.1371/journal.pone.0115225.s006 (EPS)
S7 Figure. Rarefaction curves for assessing coverage of 16S rRNA sequencing. Each curve plots the number of OTUs discovered (species richness; y-axis) as a function of sequencing depth (reads per sample; x-axis) in a single sample (n595 samples 54 time points624 subjects – 1 failed sample). Curves are grouped by feces-collection time point (see Fig. 1C) and treatment status.
doi:10.1371/journal.pone.0115225.s007 (EPS)
S8 Figure. Maximum-likelihood phylogeny of operational taxonomic units (OTUs) identified by 16S rDNA sequencing, unrooted (n58067 OTUs). Scale for branch lengths is indicated by scale bar at lower-right, in units of nucleotide substitutions per site.
doi:10.1371/journal.pone.0115225.s008 (EPS)
S9 Figure. Heatmap of (Pearson’s r) correlation matrix for 500 most-variable OTUs, colored from blue (r5+1) through white (r50) to red (r521). Rows
and columns are hierarchically clustered in order to reveal block structure. doi:10.1371/journal.pone.0115225.s009 (PNG)
S1 Table. Sample metadata for 96 fecal samples. Timepoints are coded in order according to Fig. 1C.
doi:10.1371/journal.pone.0115225.s010 (XLSX)
S2 Table. Raw operational taxonomic unit (OTU) abundance table. Sample identifiers follow those in S1 Table.
doi:10.1371/journal.pone.0115225.s011 (XLSX)
S3 Table. Taxonomic identification of operational taxonomic units (OTUs) to the rank of family.Missing data are coded as ‘‘NA.’’ OTU identifiers follow those in S2 Table.
doi:10.1371/journal.pone.0115225.s012 (XLSX)
S4 Table. Coefficient estimates for effect of olanzapine and high-fat diet on abundance of specific operational taxonomic units (OTUs). OTU identifiers follow those inS2 Table. Columns are as follows: Beta, the estimated effect on the log scale (see S1 Notes); 95% CI, confidence bounds for the effect at nominal significance level a50.05; Term, the effect being tested (drug or diet); p-value, nominalp-value from likelihood-ratio test of null hypothesis that the true effect is zero; FDR-adjusted p-value, nominalp-value adjusted for multiple-testing by the method of Benjamini and Hochberg.
doi:10.1371/journal.pone.0115225.s013 (XLSX)
Acknowledgments
Mice for the strain survey were provided on behalf of the Mouse Phenome Project (http://www.phenome.jax.org). Three core facilities at the University of North Carolina provided experimental support: germ-free experiments were performed in the National Gnotobiotic Resource Center; body composition analyses were performed in the Animal Metabolism Phenotyping Core within the Nutrition and Obesity Research Center; and 16s rRNA sequencing was performed by the High-Throughput Sequencing Facility. We thank HTSF’s Drs Piotr Mieczkowski, Ewa Malc, and Derek Lundberg for technical assistance.
Author Contributions
Conceived and designed the experiments: PFS JJC APM M. Bower. Performed the experiments: JJC RJN AKR CRQ CNM M. Bower. Analyzed the data: JJC APM PFS. Contributed reagents/materials/analysis tools: SHP SY M. Bower M. Bogue. Wrote the paper: APM JJC RJN CRQ CNM SHP SY IMC THK RBS.
References
1. Lieberman JA, Stroup TS, McEvoy JP, Swartz MS, Rosenheck RA, et al.(2005) Effectiveness of antipsychotic drugs in patients with chronic schizophrenia. N Engl J Med 353: 1209–1223. doi:10.1056/ NEJMoa051688.
2. Lieberman JA(2006) Comparative effectiveness of antipsychotic drugs. A commentary on: Cost Utility Of The Latest Antipsychotic Drugs In Schizophrenia Study (CUtLASS 1) and Clinical Antipsychotic Trials Of Intervention Effectiveness (CATIE). Arch Gen Psychiatry 63: 1069–1072. doi:10.1001/
archpsyc.63.10.1069.
3. Foley DL, Morley KI(2011) Systematic review of early cardiometabolic outcomes of the first treated episode of psychosis. Arch Gen Psychiatry 68: 609–616. doi:10.1001/archgenpsychiatry.2011.2.
4. Correll CU, Manu P, Olshanskiy V, Napolitano B, Kane JM, et al.(2009) Cardiometabolic risk of second-generation antipsychotic medications during first-time use in children and adolescents. JAMA 302: 1765–1773. doi:10.1001/jama.2009.1549.
5. Farwell WR, Stump TE, Wang J, Tafesse E, L9Italien G, et al.(2004) Weight gain and new onset diabetes associated with olanzapine and risperidone. J Gen Intern Med 19: 1200–1205. doi:10.1111/ j.1525-1497.2004.40126.x.
6. Wang C, Zhang Z, Sun J, Zhang X, Mou X, et al. (2006) Serum free Fatty acids and glucose metabolism, insulin resistance in schizophrenia with chronic antipsychotics. Biol Psychiatry 60: 1309– 1313. doi:10.1016/j.biopsych.2006.03.014.
7. Jeste DV, Gladsjo Ja, Lindamer La, Lacro JP(1996) Medical comorbidity in schizophrenia. Schizophr Bull 22: 413–430.
8. Capasso RM, Lineberry TW, Bostwick JM, Decker PA, St Sauver J(2008) Mortality in schizophrenia and schizoaffective disorder: an Olmsted County, Minnesota cohort: 1950–2005. Schizophr Res 98: 287–294. doi:10.1016/j.schres.2007.10.005.
9. Tiihonen J, Lo¨nnqvist J, Wahlbeck K, Klaukka T, Niskanen L, et al.(2009) 11-year follow-up of mortality in patients with schizophrenia: a population-based cohort study (FIN11 study). Lancet 374: 620–627. doi:10.1016/S0140-6736(09)60742-X.
11. Minet-Ringuet J, Even PC, Goubern M, Tome´ D, de Beaurepaire R(2006) Long term treatment with olanzapine mixed with the food in male rats induces body fat deposition with no increase in body weight and no thermogenic alteration. Appetite 46: 254–262. doi:10.1016/j.appet.2006.01.008.
12. Albaugh VL, Judson JG, She P, Lang CH, Maresca KP, et al. (2011) Olanzapine promotes fat accumulation in male rats by decreasing physical activity, repartitioning energy and increasing adipose tissue lipogenesis while impairing lipolysis. Mol Psychiatry 16: 569–581. doi:10.1038/mp.2010.33.
13. Teff KL, Rickels MR, Grudziak J, Fuller C, Nguyen H-L, et al.(2013) Antipsychotic-induced insulin resistance and postprandial hormonal dysregulation independent of weight gain or psychiatric disease. Diabetes 62: 3232–3240. doi:10.2337/db13-0430.
14. Tiihonen J, Lo¨nnqvist J, Wahlbeck K, Klaukka T, Niskanen L, et al.(2011) No mental health without physical health. Lancet 377: 611. doi:10.1016/S0140-6736(11)60211-0.
15. Walter J, Ley R(2011) The human gut microbiome: ecology and recent evolutionary changes. Annu Rev Microbiol 65: 411–429. doi:10.1146/annurev-micro-090110-102830.
16. Qin J, Li R, Raes J, Arumugam M, Burgdorf KS, et al.(2010) A human gut microbial gene catalogue established by metagenomic sequencing. Nature 464: 59–65. doi:10.1038/nature08821.
17. Maurice CF, Haiser HJ, Turnbaugh PJ(2013) Xenobiotics shape the physiology and gene expression of the active human gut microbiome. Cell 152: 39–50. doi:10.1016/j.cell.2012.10.052.
18. Carroll IM, Threadgill DW, Threadgill DS(2009) The gastrointestinal microbiome: a malleable, third genome of mammals. Mamm Genome 20: 395–403. doi:10.1007/s00335-009-9204-7.
19. Ley RE, Turnbaugh PJ, Klein S, Gordon JI(2006) Microbial ecology: human gut microbes associated with obesity. Nature 444: 1022–1023. doi:10.1038/4441022a.
20. Turnbaugh PJ, Ley RE, Mahowald MA, Magrini V, Mardis ER, et al.(2006) An obesity-associated gut microbiome with increased capacity for energy harvest. Nature 444: 1027–1031. doi:10.1038/ nature05414.
21. Ba¨ckhed F, Manchester JK, Semenkovich CF, Gordon JI (2007) Mechanisms underlying the resistance to diet-induced obesity in germ-free mice. Proc Natl Acad Sci USA 104: 979–984. doi:10.1073/pnas.0605374104.
22. Turnbaugh PJ, Ridaura VK, Faith JJ, Rey FE, Knight R, et al.(2009) The effect of diet on the human gut microbiome: a metagenomic analysis in humanized gnotobiotic mice. Sci Transl Med 1: 6ra14. doi:10.1126/scitranslmed.3000322.
23. Cho I, Yamanishi S, Cox L, Methe´ BA, Zavadil J, et al.(2012) Antibiotics in early life alter the murine colonic microbiome and adiposity. Nature 488: 621–626. doi:10.1038/nature11400.
24. Ridaura VK, Faith JJ, Rey FE, Cheng J, Duncan AE, et al. (2013) Gut microbiota from twins discordant for obesity modulate metabolism in mice. Science (80-) 341: 1241214. doi:10.1126/ science.1241214.
25. Campbell JH, Foster CM, Vishnivetskaya T, Campbell AG, Yang ZK, et al.(2012) Host genetic and environmental effects on mouse intestinal microbiota. ISME J 6: 2033–2044. doi:10.1038/ismej.2012.54.
26. Schloissnig S, Arumugam M, Sunagawa S, Mitreva M, Tap J, et al. (2013) Genomic variation landscape of the human gut microbiome. Nature 493: 45–50. doi:10.1038/nature11711.
27. Zhang C, Li S, Yang L, Huang P, Li W, et al.(2013) Structural modulation of gut microbiota in life-long calorie-restricted mice. Nat Commun 4: 2163. doi:10.1038/ncomms3163.
28. Benson AK, Kelly SA, Legge R, Ma F, Low SJ, et al.(2010) Individuality in gut microbiota composition is a complex polygenic trait shaped by multiple environmental and host genetic factors. Proc Natl Acad Sci USA 107: 18933–18938. doi:10.1073/pnas.1007028107.
29. Callaghan JT, Bergstrom RF, Ptak LR, Beasley CM (1999) Olanzapine. Pharmacokinetic and pharmacodynamic profile. Clin Pharmacokinet 37: 177–193. doi:10.2165/00003088-199937030-00001.
31. Davey KJ, Cotter PD, O9Sullivan O, Crispie F, Dinan TG, et al.(2013) Antipsychotics and the gut microbiome: olanzapine-induced metabolic dysfunction is attenuated by antibiotic administration in the rat. Transl Psychiatry 3: e309. doi:10.1038/tp.2013.83.
32. Perry PJ, Lund BC, Sanger T, Beasley C (2001) Olanzapine plasma concentrations and clinical response: acute phase results of the North American Olanzapine Trial. J Clin Psychopharmacol 21: 14– 20.
33. Zhang G, Terry A V, Bartlett MG(2007) Sensitive liquid chromatography/tandem mass spectrometry method for the simultaneous determination of olanzapine, risperidone, 9-hydroxyrisperidone, clozapine, haloperidol and ziprasidone in rat brain tissue. J Chromatogr B Anal Technol Biomed Life Sci 858: 276– 281. doi:10.1016/j.jchromb.2007.08.007.
34. Simon GM, Cheng J, Gordon JI(2012) Quantitative assessment of the impact of the gut microbiota on lysine epsilon-acetylation of host proteins using gnotobiotic mice. Proc Natl Acad Sci USA 109: 11133– 11138. doi:10.1073/pnas.1208669109.
35. Nixon JP, Zhang M, Wang C, Kuskowski MA, Novak CM, et al.(2010) Evaluation of a quantitative magnetic resonance imaging system for whole body composition analysis in rodents. Obesity 18: 1652– 1659. doi:10.1038/oby.2009.471.
36. Lundberg DS, Yourstone S, Mieczkowski P, Jones CD, Dangl JL(2013) Practical innovations for high-throughput amplicon sequencing. Nat Methods 10: 999–1002. doi:10.1038/nmeth.2634.
37. Wang Q, Garrity GM, Tiedje JM, Cole JR(2007) Naive Bayesian classifier for rapid assignment of rRNA sequences into the new bacterial taxonomy. Appl Env Microbiol 73: 5261–5267. doi:10.1128/ AEM.00062-07.
38. Caporaso JG, Kuczynski J, Stombaugh J, Bittinger K, Bushman FD, et al.(2010) QIIME allows analysis of high-throughput community sequencing data. Nat Methods 7: 335–336. doi:10.1038/ nmeth.f.303.
39. Caporaso JG, Bittinger K, Bushman FD, DeSantis TZ, Andersen GL, et al.(2010) PyNAST: a flexible tool for aligning sequences to a template alignment. Bioinformatics 26: 266–267. doi:10.1093/ bioinformatics/btp636.
40. Price MN, Dehal PS, Arkin AP(2009) FastTree: computing large minimum evolution trees with profiles instead of a distance matrix. Mol Biol Evol 26: 1641–1650. doi:10.1093/molbev/msp077.
41. Lozupone C, Knight R (2005) UniFrac: a New Phylogenetic Method for Comparing Microbial Communities. Appl Env Microbiol 71: 8228–8235. doi:10.1128/AEM.71.12.8228.
42. Anderson MJ(2001) A new method for non-parametric multivariate analysis of variance. Austral Ecol 26: 32–46.
43. Venables WN, Ripley BD(2002) Modern Applied Statistics with S. Fourth. New York: Springer.
44. Collaborative Cross Consortium(2012) The genome architecture of the Collaborative Cross mouse genetic reference population. Genetics 190: 389–401. doi:10.1534/genetics.111.132639.
45. Fisher RA, Corbett AS, Williams CB(1943) The Relation Between the Number of Species and the Number of Individuals in a Random Sample of an Animal Population. J Anim Ecol 12: 42–58.
46. Chesler EJ, Miller DR, Branstetter LR, Galloway LD, Jackson BL, et al.(2008) The Collaborative Cross at Oak Ridge National Laboratory: developing a powerful resource for systems genetics. Mamm Genome 19: 382–389. doi:10.1007/s00335-008-9135-8.
47. Svenson KL, Gatti DM, Valdar W, Welsh CE, Cheng R, et al.(2012) High-resolution genetic mapping using the Mouse Diversity outbred population. Genetics 190: 437–447. doi:10.1534/
genetics.111.132597.
48. Jumpstart Consortium Human Microbiome Project Data Generation Working Group (2012) Evaluation of 16S rDNA-based community profiling for human microbiome research. PLoS One 7: e39315. doi:10.1371/journal.pone.0039315.
49. McCafferty J, Mu¨hlbauer M, Gharaibeh RZ, Arthur JC, Perez-Chanona E, et al.(2013) Stochastic changes over time and not founder effects drive cage effects in microbial community assembly in a mouse model. ISME J 7: 2116–2125. doi:10.1038/ismej.2013.106.
51. Spencer MD, Hamp TJ, Reid RW, Fischer LM, Zeisel SH, et al. (2011) Association between composition of the human gastrointestinal microbiome and development of fatty liver with choline deficiency. Gastroenterology 140: 976–986. doi:10.1053/j.gastro.2010.11.049.
52. Raman M, Ahmed I, Gillevet PM, Probert CS, Ratcliffe NM, et al.(2013) Fecal microbiome and volatile organic compound metabolome in obese humans with nonalcoholic fatty liver disease. Clin
Gastroenterol Hepatol 11: 868–75.e1–3. doi:10.1016/j.cgh.2013.02.015.
53. Henao-Mejia J, Elinav E, Jin C, Hao L, Mehal WZ, et al.(2012) Inflammasome-mediated dysbiosis regulates progression of NAFLD and obesity. Nature 482: 179–185. doi:10.1038/nature10809.
54. Jenkins AJ, Sarconi KM, Raaf HN(1998) Determination of olanzapine in a postmortem case. J Anal Toxicol 22: 605–609.
55. Kristiansen JE(1979) Experiments to illustrate the effect of chlorpromazine on the permeability of the bacterial cell wall. Acta Pathol Microbiol Scand B 87: 317–319.
56. Thorsing M, Klitgaard JK, Atilano ML, Skov MN, Kolmos HJ, et al.(2013) Thioridazine induces major changes in global gene expression and cell wall composition in methicillin-resistant Staphylococcus aureus USA300. PLoS One 8: e64518. doi:10.1371/journal.pone.0064518.
57. Rhee SH, Pothoulakis C, Mayer EA(2009) Principles and clinical implications of the brain-gut-enteric microbiota axis. Nat Rev Gastroenterol Hepatol 6: 306–314. doi:10.1038/nrgastro.2009.35.