1091
ANALYSIS OF BONE MINERAL DENSITY AND RELEVANT FACTORS IN PATIENTS WITH TYPE 1 DIABETES
PENG DUAN, PING TU, HEPING WU, XUN DING, JIANG LIU and BO DENG
Department of Endocrinology, the hird Hospital of Nanchang/Nanchang Key Laboratory of Diabetes, Nanchang 330009, China
Corresponding author: [email protected]
Abstract – We investigated changes in bone mineral density (BMD) and relevant factors of BMD in patients with type 1 diabetes (T1D).Atotal of 47 patients with T1D and 40 healthy controls participated in this study. he waist-to-hip ratio (WHR) and body mass index (BMI) were calculated ater physical examination. he lumbar spine (L2-L4) BMD and let femoral neck BMD were examined. Blood samples were collected. he BMI, WHR, fasting C peptide (FCP), postprandial C peptide (2hCP), lumbar spine and let femoral neck BMD of the patients with T1D were signiicantly lower than those of healthy controls, while the fasting plasma glucose (FPG), postprandial plasma glucose (2hPG) and hemoglobin A1c (HbA1c) were higher (P <0.05). Duration of T1D and HbA1c were negatively correlated with lumbar spine and let femo-ral neck BMD. he FCP and 2hCP were positively correlated with lumbar spine and let femofemo-ral neck BMD.
Key words: Bone mineral density; body mass index; type 1 diabetes
INTRODUCTION
he incidences of diabetes and osteoporosis have in-creased and diabetic patients with a high prevalence of osteoporosis are gradually attracting more atten-tion (Watanabe and Okazaki, 2012). here are com-plex relationships between diabetes and osteoporosis. Patients with T1D have a greater risk of fracture since they cannot reach their potential peak bone mass (Sealand et al., 2013). he change in the bone min-eral density (BMD) of patients with T1D has always been disputed. It has been reported that the patients with type 2 diabetes (T2D) have reduced, increased or unchanged BMD (Brown SA, 2004; Abdulameer et al., 2012; Chen et al., 2013). Several studies have reported that patients with T1D have increased bone fracture risk and decreased BMD (Vestergaard, 2007; Eller-Vainicher et al., 2011).
he increased risk of osteoporotic fracture is re-lated to the history of diabetes, diabetes duration and chronic complications (Rakic et al., 2006; Schneider et al., 2012). Meanwhile the risk of bone fracture is related to glycemic control, and the etiologies remain elusive (Neumann et al., 2011; Simmons et al., 2011). What’s more, hyperglycemia, autoimmune inlam-mation, hyperinsulinemia, hypoamylinemia, deicit of insulin-like growth factors-I (IGF-I) and vitamin D may be the potential pathogenic mechanisms of T1D (Moyer-Mileur et al., 2008; Coe et al., 2011; Takeuchi, 2012). Although osteoporosis is one of the complications of T1D, there are few studies about the BMD of patients with T1D in China.
T1D. he aim of this study was to investigate BMD changes in patients with T1D and the association between BMD and factors such as the course of the diabetes, hemoglobin A1c, fasting C peptide, fast-ing plasma glucose, 2 h postprandial plasma glucose and 2 h postprandial C peptide. In our study, we col-lected forty-seven patients with T1D to investigate the changes in BMD and factors relevant related to BMD, using classical statistical methods.
MATERIALS AND METHODS
Study population
Patients with T1D were recruited from inpatients and outpatients in the incretion department of the hird Hospital of Nanchang from February 2010 to February 2012. All patients enrolled in our study conformed to the 1999 World Health Organization criteria for diagnosis of T1D. Healthy people with normal blood glucose from the physical examination center of the hird Hospital of Nanchang and the investigation of epidemiology in community were taken as controls. he study protocol was explained to both cases and controls before participation, and informed consent was obtained from each partici-pant prior to the start of the study.
Assay methods
General information of the study population, such as gender, age, education level, vocation, marriage sta-tus, income, duration of diabetes and complications was collected. he height, weight, waist and hip of all participants were measured by physical examina-tion, and the BMI (kg/m2) and WHR were
calculat-ed. Dual-energy X-ray absorptiometry (MEDILINK, France) was used to measure the lumbar spine (L2-L4) BMD and let femoral neck BMD. All of the measurements were completed with the same instru-ment and operator.
Fasting blood samples of the patients with T1D were collected to measure the levels of FPG, HbA1c and FCP. he levels of 2hPG and 2hCP were detected 2 h ater eating 100 g of steamed bread. he control
group underwent the oral glucose tolerance test. he fasting blood and the 2 h post-meal blood were col-lected to measure the biochemical parameters. he venous blood glucose was determined by the method of glucose oxidase using an automatic biochemical analyzer (ADVIA2400, Siemens). Plasma C pep-tide was measured using the radiate immune assay kit (Shandong 3V, China). HbA1c was detected by high eiciency liquid chromatography using an au-tomatic glycosylated hemoglobin meter (BIO-RAD, America).
Statistical analysis
Statistical analysis was performed by SPSS ver. 13.0 statistical sotware (SPSS, Chicago, IL), and data were expressed as means ± SD. One-way ANOVA or two independent T-tests were used to analyze all data of the healthy controls and patients with T1D. Pearson’s correlation coeicient was used to indicate the cor-relation. Multiple-factor analysis was performed us-ing the multiple stepwise regression method. here is signiicantly statistical diference when P <0.05.
RESULTS
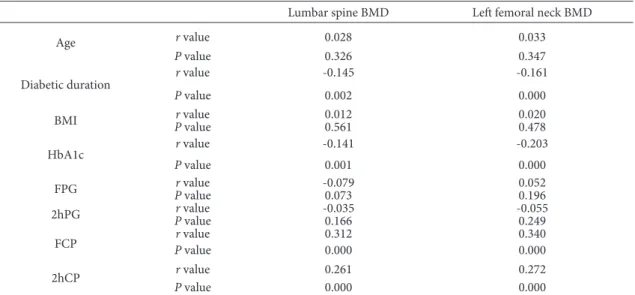
Pearson’s analysis for the BMD of T1D patients and relevant factors found that the duration of diabe-tes (r = -0.145, P = 0.002; r = -0.161, P = 0.000) and HbA1c (r = -0.141, P = 0.001; r = -0.203, P = 0.000)
were negatively correlated to lumbar spine BMD and let femoral neck BMD, while FCP (r = 0.312, P = 0.000; r = 0.340, P = 0.000) and 2hCP (r = 0.261; P = 0.000; r = 0.272, P = 0.000) showed positively cor-Table 1. Demographic, physical and biochemical variables of T1D patients and control subjects (Data are shown as means ± SD, * P < 0.05 vs. control group)
Variables Type 1 diabetes Control
Number 47 40
Age (years) 20.190 ± 5.210 21.410 ± 5.390
BMI (kg/m2) 21.260 ± 3.140* 24.400 ± 3.500
WHR 0.770 ± 0.150* 0.830 ± 0.220
HbA1c (%) 8.100 ± 1.900* 5.100 ± 0.600
FPG (mmol/L) 8.500 ± 2.100* 5.20 0± 0.800
2hPG (mmol/L) 12.520 ± 3.170* 6.720 ± 1.030
FCP (ng/ml) 0.230 ± 0.100* 1.860 ± 0.630
2hCP (ng/ml) 0.320 ± 0.150* 5.410 ± 1.890
lumbar spine (L2-L4) BMD (mg/cm3) 0.822 ± 0.083* 0.885 ± 0.086
let femoral neck BMD (mg/cm3) 0.813 ± 0.090* 0.877 ± 0.098
Table 2. he Pearson analysis of BMD and relevant factors in patients with T1D and relevant factors
Lumbar spine BMD Let femoral neck BMD
Age r value 0.028 0.033
P value 0.326 0.347
Diabetic duration
r value -0.145 -0.161
P value 0.002 0.000
BMI r value 0.012 0.020
P value 0.561 0.478
HbA1c r value -0.141 -0.203
P value 0.001 0.000
FPG Pr valuevalue -0.0790.073 0.0520.196
2hPG r value -0.035 -0.055
P value 0.166 0.249
FCP r value 0.312 0.340
P value 0.000 0.000
2hCP r value 0.261 0.272
P value 0.000 0.000
Table 3. he multiple regression analysis of BMD and relevant factors in patients with T1D
Age Diabetic
duration BMI HbA1c FPG 2hPG FCP 2hCP
Regression
coeicient -0.001 -0.072 0.002 -0.085 -0.002 -0.033 0.133 0.116
related with the lumbar spine BMD and let femoral neck BMD (Table 2). he other variables, such as age, BMI, FPG and 2hPG had no association with lum-bar spine BMD and let femoral neck BMD (P >0.05; Table 2).
Furthermore, multiple regression analysis was performed with lumbar spine and let femoral neck BMD as dependent variables and the other relevant factors as independent variables. he analysis results indicated that the duration of diabetes (r = -0.072, P = 0.004), HbA1c (r = -0.085, P = 0.001), FCP (r = 0.133, P = 0.000) and 2hCP (r = 0.116, P = 0.000) were directly associated with lumbar spine and let femoral neck BMD ater adjusting BMI (Table 3). he other factors, such as age, BMI, FPG, and 2hPG were not correlated with lumbar spine and let femo-ral neck BMD (P >0.05; Table 3).
DISCUSSION
In this study, the lumbar spine and let femoral neck BMD of patients with T1D were lower than those of the control group were. he BMD of lumbar spine and let femoral neck were reduced by 7.1% and 7.3%, respectively. Mastrandrea et al. (2008) found that patients with T1D had reduced BMD and in-creased risk of postmenopausal osteoporosis fracture by studying 63 cases of female patients with T1D, and Hamilton (2009) came to similar conclusions in Aus-tralia. Some researchers have found that the BMD of premenopausal women with T1D was 3-8% lower than that of healthy women and that the risk of oste-oporosis fracture increased (Strotmeyer et al., 2006). herefore, the change in the BMD in patients with T1D was in conformity to the results of the above-mentioned studies. However, some researchers have observed that there were minor diferences in body composition, and no diferences in BMD between healthy controls and patients with long-standing childhood and adolescence onset T1D (Ingberg et al., 2004). hese inconsistent conclusions may be re-lated to the small sample size, i.e., only a few tens of cases. Collecting a large amount of studying subjects is actually quite diicult because the number of pa-tients with T1D is small. In addition, genetic factors
play very important roles in the BMD, and the results may be changed among diferent races and diferent areas (Travison et al., 2011).
to observe the factors related to the bone metabolism of patients with T1D.
In a word, the BMD of patients with type 1 dia-betes is reduced and BMD is related to the duration of diabetes and the levels of HbA1c and C peptide. he results of our study provide some reference to the treatment of osteoporosis of patients with T1D and may facilitate the taking of efective counter-measures; the speciic mechanism still needs to be further studied with larger sample size.
Acknowledgments - We are very grateful to the hird Hospital
of Nanchang and the staf of the incretion department for pa-tient recruitment, data collection and assistance with assays, as well as the physical examination center and community for providing control subjects from the local healthy population. he study was supported by Nanchang science and technol-ogy bureau key projects fund.
REFERENCES
Abdulameer, S.A., Sulaiman, S.A., Hassali, M.A., Subramaniam, K. and M.N. Sahib (2012). Osteoporosis and type 2 diabe-tes mellitus: what do we know, and what we can do? Pa-tient Prefer Adherence6, 435-448.
AboElAsrar, M.A., Elbarbary, N.S., Elshennawy, D.E. and A.M. Omar (2012). Insulin-like growth factor-1 cytokines cross-talk in type 1 diabetes mellitus: relationship to mi-crovascular complications and bone mineral density. Cy-tokine59, 86-93.
Brown, S.A. and J.L. Sharpless (2004). Osteoporosis: An under-appreciated complication of diabetes. Clinical Diabetes22, 10-20.
Chen, H., Li, X., Yue, R., Ren, X., Zhang, X. and A. Ni (2013). he efects of diabetes mellitus and diabetic nephropathy on bone and mineral metabolism in T2DM patients. Diabetes Research and Clinical Practice100, 272-276
Coe, L. M., Irwin, R., Lippner, D. and L.R. McCabe (2011). he bone marrow microenvironment contributes to type I dia-betes induced osteoblast death. Journal of Cellular Physiol-ogy226, 477-483.
Eller-Vainicher, C., Zhukouskaya, V.V., Tolkachev, Y.V., Koritko, S.S., Cairoli, E., Grossi, E., Beck-Peccoz, P., Chiodini, I. and
A.P. Shepelkevich (2011). Low bone mineral density and its predictors in type 1 diabetic patients evaluated by the
clas-sic statistics and artiicial neural network analysis. Diabe-tes Care34, 2186-2191.
Hadjidakis, D.J., Raptis, A.E., Sfakianakis, M., Mylonakis, A. and
S.A. Raptis (2006). Bone mineral density of both genders in Type 1 diabetes according to bone composition. Journal of Diabetes and its Complications20, 302-307.
Hamilton, E.J., Rakic, V., Davis, W.A., Chubb, S.A., Kamber, N., Prince, R.L. and T.M. Davis (2009). Prevalence and predic-tors of osteopenia and osteoporosis in adults with Type 1 diabetes. Diabetic Medicine 26, 45-52.
Heilman, K., Zilmer, M., Zilmer, K. and A. Tillmann (2009). Low-er bone minLow-eral density in children with type 1 diabetes is associated with poor glycemic control and higher serum ICAM-1 and urinary isoprostane levels. Journal of Bone and Mineral Metabolism27, 598-604.
Ingberg, C.M., Palmer, M., Aman, J., Arvidsson, B., Schvarcz, E. and C. Berne (2004). Body composition and bone mineral density in long-standing type 1 diabetes. Journal of Inter-nal Medicine255, 392-398.
Joshi, A., Varthakavi, P., Chadha, M. and N. Bhagwat (2013). A study of bone mineral density and its determinants in type 1 diabetes mellitus. Journal of Osteoporosis2013, 397814.
Kocabas, A., Karaguzel, G., Imir, N., Yavuzer, U. and S. Akcurin
(2010). Efects of vitamin D receptor gene polymorphisms on susceptibility to disease and bone mineral density in Turkish patients with type 1 diabetes mellitus. Journal of Pediatric Endocrinology & Metabolism23, 1289-1297.
Mastrandrea, L.D., Wactawski-Wende, J., Donahue, R.P., Hovey, K.M., Clark, A. and T. Quattrin (2008). young women with type 1 diabetes have lower bone mineral density that persists over time. Diabetes Care31, 1729-1735.
Moyer-Mileur, L.J., Slater, H., Jordan, K.C. and M.A. Murray
(2008). IGF-1 and IGF-binding proteins and bone mass, geometry, and strength: relation to metabolic control in adolescent girls with type 1 diabetes. Journal of Bone and Mineral Research23, 1884-1891.
Neumann, T., Samann, A., Lodes, S., Kastner, B., Franke, S., Kiehntopf, M., Hemmelmann, C., Lehmann, T., Muller, U.A., Hein, G. and G. Wolf (2011). Glycaemic control is positively associated with prevalent fractures but not with bone mineral density in patients with Type 1 diabetes.
Diabetes Care28, 872-875.
Pesta, M. (2012). Vitamin D receptor gene polymorphism. Vni-trní Lékarství 58, 381-385.
Rachon, D., Mysliwska, J., Suchecka-Rachon, K., Semetkowska-Jurkiewicz, B., Zorena, K. and W. Lysiak-Szydlowska
den-sity at the femoral neck in post-menopausal women with Type 1 diabetes. Diabetes Care20, 475-480.
Rakel, A., Sheehy, O., Rahme, E. and J. LeLorier (2008). Osteo-porosis among patients with type 1 and type 2 diabetes.
Diabetes & Metabolism34, 193-205.
Rakic, V., Davis, W.A., Chubb, S.A., Islam, F.M., Prince, R.L. and
T.M. Davis (2006). Bone mineral density and its determi-nants in diabetes: the Fremantle Diabetes Study. Diabeto-logia49, 863-871.
Schneider, A.L., Williams, E.K., Brancati, F.L., Blecker, S., Coresh, J. and E. Selvin (2012). Diabetes and Risk of Fracture-Re-lated Hospitalization: he Atherosclerosis Risk in Com-munities Study. Diabetes Care36, 1153-1158
Sealand, R., Razavi, C. and R.A. Adler (2013). Diabetes Mellitus and Osteoporosis. Current Diabetes Reports13, 411-418
Simmons, J.H., Raines, M., Ness, K.D., Hall, R., Gebretsadik, T., Mohan, S. and A. Spagnoli (2011). Metabolic control and bone health in adolescents with type 1 diabetes. Interna-tional Journal of Pediatric Endocrinology2011, 13.
Strotmeyer, E.S., Cauley, J.A., Orchard, T.J., Steenkiste, A.R. and
J.S. Dorman (2006). Middle-aged premenopausal women with type 1 diabetes have lower bone mineral density and calcaneal quantitative ultrasound than nondiabetic wom-en. Diabetes Care29, 306-311.
Takeuchi, Y. (2012). Diabetes mellitus and osteoporosis. hera-peutic strategy for osteoporosis in patients with diabetes mellitus. Clinical Calcium22, 1410-1415.
Travison, T.G., Chiu, G.R., McKinlay, J.B. and A.B. Araujo (2011). Accounting for racial/ethnic variation in bone mineral content and density: the competing inluences of socio-economic factors, body composition, health and lifestyle, and circulating androgens and estrogens. Osteoporosis In-ternational22, 2645-2654.
Vestergaard, P. (2007). Discrepancies in bone mineral density and fracture risk in patients with type 1 and type 2 diabetes--a meta-analysis. Osteoporosis International18, 427-444.