Lack of relationship between glycemic
control and bone mineral density in
type 2 diabetes mellitus
Divisão de Endocrinologia e Metabolismo, Departamento de Clínica Médica, Faculdade de Medicina de Ribeirão Preto, Universidade de São Paulo, Ribeirão Preto, SP, Brasil
D.M.S.L. Cutrim, F.A. Pereira, F.J.A. de Paula and M.C. Foss
Abstract
We assessed the effect of chronic hyperglycemia on bone mineral density (BMD) and bone remodeling in patients with type 2 diabetes mellitus. We investigated 42 patients with type 2 diabetes under stable control for at least 1 year, 22 of them with good metabolic control (GMC: mean age = 48.8 ± 1.5 years, 11 females) and 20 with poor metabolic control (PMC: mean age = 50.2 ± 1.2 years, 8 females), and 24 normal control individuals (CG: mean age = 46.5 ± 1.1 years, 14 females). We determined BMD in the femoral neck and at the L2-L4 level (DEXA) and serum levels of glucose, total glycated hemoglobin (HbA1), total and ionic calcium, phosphorus, alkaline phosphatase, follicle-stimulating hormone, intact parathyroid hormone (iPTH), 25-hydroxyvitamin D (25-OH-D), insulin-like growth factor I (IGFI), osteocalcin, procollagen type I C propeptide, as well as urinary levels of deoxypyridinoline and creatinine. HbA1 levels were significantly higher in PMC patients (12.5 ± 0.6 vs 7.45 ± 0.2% for GMC and 6.3 ± 0.9% for CG; P< 0.05). There was no difference in 25-OH-D, iPTH or IGFI levels between the three groups. BMD values at L2-L4 (CG = 1.068 ± 0.02 vs GMC = 1.170 ± 0.03 vs PMC = 1.084 ± 0.02 g/cm2) and in the femoral neck (CG = 0.898 ± 0.03 vs GMC = 0.929 ± 0.03 vs PMC = 0.914 ± 0.03 g/cm2) were similar for all groups. PMC presented significantly lower osteocalcin levels than the other two groups, whereas no significant difference in urinary deoxypyridine was observed between groups. The present results demonstrate that hyperglycemia is not associated with increased bone resorption in type 2 diabetes mellitus and that BMD is not altered in type 2 diabetes mellitus.
Correspondence
M.C. Foss
Departamento de Clínica Médica FMRP, USP
Av. Bandeirantes, 3900 14049-900 Ribeirão Preto, SP Brasil
Fax: +55-16-3633-6695 E-mail.: mcfoss@fmrp.usp.br
Research supported by CNPq and FAEPA.
Publication supported by FAPESP.
Received November 29, 2005 Accepted October 6, 2006
Key words
•Diabetes mellitus •Osteoporosis •Bone mineral density •Glycemic control •Bone markers
•Insulin-like growth factor I
Introduction
The main elements of mineral metabo-lism (calcium, total glycated hemoglobin (HbA1), phosphorus, and magnesium)
ac-tively participate in intermediate metabo-lism. Thus, it is to be expected that
In view of the current high prevalence of diabetes mellitus (DM) and osteoporosis, today there is great interest in studying the possible association between these two dis-orders. However, DM is such a heteroge-neous syndrome that conflicting results still exist in the literature. Most results, however, indicate that type 1 DM is associated with bone mass loss (5,6), whereas there is no consensus about this association in type 2 DM, with reports indicating normal (6,7), increased (8,9), or reduced (10,11) bone mass. An aspect that has not been exten-sively evaluated in type 2 DM is the effect of chronic lack of metabolic control on bone remodeling activity and bone mineral den-sity (BMD). It is possible that this factor can be responsible, at least in part, for the dis-crepant results regarding the occurrence of osteoporosis in patients with type 2 DM. The association between hyperglycemia and microangiopathic complications in type 1 and type 2 DM, respectively, was definitely established in 1993 and 1998 (12,13). Since then, it has become necessary to consider the role of hyperglycemia in the development of other possible complications.
Thus, the objective of the present study was to determine bone mass and the bio-chemical parameters of bone remodeling in individuals with type 2 DM with good and poor metabolic control for at least one year and to compare their results with those ob-tained for normal individuals.
Patients and Methods
We studied 42 patients with type 2 DM, 22 of them with good metabolic control (GMC: 11 women) and 20 with poor meta-bolic control (PMC: 8 women). The control group consisted of 24 normal individuals (CG: 14 women). The three groups were matched for height, age, and sex. The clini-cal characteristics and laboratory data of the subjects are shown in Table 1. The patients were selected at the diabetes mellitus
outpa-tient clinic of the University Hospital, Fac-ulty of Medicine of Ribeirão Preto, Univer-sity of São Paulo (FMRP, USP) and of the Teaching Health Center, which is linked to FMRP. The study was approved by the Eth-ics Committee of the University Hospital, FMRP, USP, and all patients gave written informed consent to participate.
We excluded from the study individuals with a personal and/or family history of osteometabolic diseases, impairment of kid-ney function (normal creatinine clearance for age) or taking medications that might interfere with calcium metabolism such as glucocorticoids, diuretics, lithium, heparin, barbiturates, and hydantoin. We also ex-cluded individuals with a history of cigarette smoking and alcohol consumption or with clinical evidence of autonomic neuropathy, plantar ulcers and limping. Among the indi-viduals studied, 3 belonging to group GMC, 3 belonging to group PMC and one normal volunteer were postmenopausal, presenting follicle-stimulating hormone (FSH) >40 mIU/mL and a period of amenorrhea of more than 6 months.
The inclusion criterion for the patients regarding metabolic control was based on glycemia and HbA1 values obtained during
the year preceding the beginning of the study. Thus, patients to be assigned to the well-controlled type 2 DM group had to present at least four HbA1 values not exceeding 9%
(normal range: 5.3-8.0%) during the last year. The group of diabetic patients with poor metabolic control consisted of indi-viduals who had presented four HbA1 values
pa-tients used only insulin treatment. The mean time since diagnosis of type 2 DM was 6.4 ± 0.8 years for the GMC group and 11.7 ± 1.3 years for the PMC group.
Blood samples were collected in the morning after a 10- to 14-h fast under stan-dardized conditions. The serum aliquots to be used for the determination of intact para-thyroid hormone (iPTH), insulin-like growth factor I (IGFI), osteocalcin, 25-hydroxyvi-tamin D (25-OH-D), magnesium, procolla-gen type I C propeptide (PICP), and FSH were stored frozen at -70ºC until analysis. Glucose, total calcium, inorganic phospho-rus, alkaline phosphatase, albumin, glutamic oxaloacetic transaminase, glutamic pyruvic transaminase, and γ-glutamyl transferase were determined immediately after blood collection using an automatic biochemical analyzer (COBAS, Roche Diagnostics, Basel, Switzerland). The blood sample used for the determination of serum ionic calcium was collected under anaerobic conditions and immediately processed with an analyzer equipped with a selective electrode (Stat Profile Plus 9 Analyzer, Nova Biomedical, Waltham MA, USA). Deoxypyridinoline (DPD) and urinary creatinine were deter-mined in a sample of the second morning urine. HbA1 was determined by ion-exchange
chromatography (Labtest Diagnostica S.A., São Paulo, SP, Brazil), and serum magne-sium by atom absorption spectrophotometry (Perkin Elmer Apparatus, Norwalk, CT, USA).
The markers of bone formation deter-mined in the present study were osteocalcin and PICP and the marker of bone resorption was urinary DPD. Intact human osteocalcin was determined by an immunoradiometric method (Diagnostic Systems Laboratories, Webster, TX, USA). PICP and DPD were determined by enzyme immunoassay (Me-tra Biosystems, Mountain View, CA, USA). The DPD value was corrected by urinary creatinine (nmol/mmol). iPTH was deter-mined by chemoluminescence (Immulite,
Diagnostic Products Corporation, Los An-geles, CA, USA), and IGFI by immunoradi-ometry (Diagnostic Systems Laboratories). FSH was determined by immunofluorimetry (Delphia, Turku, Finland) and 25-OH-D by radioimmunoassay (Nichols Institute Diag-nostics, San Juan Capistrano, CA, USA). Intra- and interassay variations were 2.9 and 5.0 for osteocalcin, respectively, 1.3 and 1.6% for PICP, 2.0 and 4.8% for DPD, 2.9 and 4.5% for iPTH, and 2.4 and 4.4% for IGFI. The intra-assay error was 5.7% for 25-OH-D and 5.8% for FSH.
The patients were submitted to lumbar spine (L2-L4) and femoral neck bone densi-tometry by X-ray double emission absorpti-ometry using a SOPHOS-L-XRA apparatus (Sophos, Paris, France). The coefficients of variation for L2-L4 BMD and femoral neck BMD were 3.0 and 3.2%, respectively. The patients who presented higher bone density in the lumbar spine were submitted to radio-graphic evaluation of this region in order to exclude the occurrence of aortic calcifica-tion.
Statistical analysis
Data were analyzed statistically using the Prism software, version 3.0, 1999 (Graph Pad Prism Inc., San Diego, CA, USA). ANOVA was used for the comparative anal-ysis of the three groups, followed by the multiple comparison Tukey test for pairwise analysis of the groups. The correlation be-tween variables was calculated by the Pear-son test. Data are reported as means ± SEM and the level of significance was set at P < 0.05.
Results
The PMC group presented a significant-ly higher mean fasting gsignificant-lycemia and HbA1
was no significant difference in HbA1 levels
between GMC and CG. The three groups studied presented similar levels of inorganic phosphorus, magnesium, and total and ionic calcium (Table 1).
PMC patients presented significantly higher alkaline phosphatase levels than con-trols (Table 1), and GMC patients presented higher levels than the controls, although the difference was not significant (Table 1). Al-though γ-glutamyl transferase levels were normal in all three groups, they were signifi-cantly higher in the PMC group than in the other two groups (Table 2).
Serum iPTH and 25-OH-D were within normal limits, with no significant difference between groups (Table 2). Serum IGFI lev-els did not differ between the diabetic groups and the control group (Table 2).
The osteocalcin levels of the PMC group were significantly lower than those of the control group, whereas circulating PICP lev-els did not differ between the three groups (Table 2). The urinary DPD levels of the groups of diabetic patients did not differ significantly from those of the control group (Table 2). There was no significant differ-ence in BMD of the femoral neck (L2-L4: CG = 0.898 ± 0.03 vs GMC = 0.929 ± 0.03 vs PMC = 0.914 ± 0.03 g/cm2) or of the lumbar
spine (L2-L4: CG = 1.068 ± 0.02 vs GMC = 1.170 ± 0.03 vs PMC = 1.084 ± 0.02 g/cm2)
between the three groups. In addition, when the groups were subdivided by sex, again no significant differences in BMD were de-tected between normal individuals and dia-betic patients with good or poor metabolic control in the lumbar spine (CG: male = 1.05 ± 0.05 g/cm2; female = 1.13 ± 0.04 g/cm2vs
GMC: male = 1.19 ± 0.05 g/cm2; female =
1.13 ± 0.04 g/cm2 vs PMC: male = 1.09 ±
0.04 g/cm2; female = 1.07 ± 0.02 g/cm2) or
femoral neck (CG: male = 0.95 ± 0.05 g/cm2;
female = 0.86 ± 0.03 g/cm2vs GMC: male =
0.93 ± 0.05 g/cm2; female = 0.89 ± 0.03 g/
cm2 vs PMC: male = 0.88 ± 0.03 g/cm2;
female = 0.91 ± 0.03 g/cm2).
Table 1. Clinical and laboratory characteristics of normal individuals (control group, CG) and of patients with type 2 diabetes mellitus with good (GMC) and poor (PMC) metabolic control.
CG GMC PMC
Sex 14F:10M 10F:12M 12F:8M
Age (years) 46.50 ± 1.1 48.80 ± 1.5 50.20 ± 1.2
Weight (kg) 71.10 ± 2.3 74.80 ± 3.1 73.90 ± 2.3
Height (m) 1.62 ± 1.9 1.65 ± 0.02 1.61 ± 0.01
Body mass index (kg/m2) 26.50 ± 0.6 27.90 ± 0.9 28.00 ± 0.8
Plasma glucose (mg/dL)#,* 92.70 ± 8.0 143.60 ± 9.5 242.60 ± 18.2 (reference: 70-110 mg/dL)
Glycated hemoglobin (%)**,+ 6.30 ± 0.9 7.45 ± 0.2 12.50 ± 0.6
(reference: 5.3-8.0%)
Total calcium (mg/dL) 9.40 ± 0.1 9.80 ± 0.1 9.40 ± 0.1
(reference: 8.5-10.2 mg/dL)
Ionic calcium (mM) 1.14 ± 0.02 1.15 ± 0.02 1.18 ± 0.02
(reference: 1.14-1.29 mM)
Inorganic phosphorus (mg/dL) 3.60 ± 0.08 3.80 ± 0.1 3.90 ± 0.12
(reference: 2.5-4.5 mg/dL)
Magnesium (mg/dL) 1.80 ± 0.03 1.74 ± 0.04 1.76 ± 0.06
(reference: 1.6-2.6 mg/dL)
Alkaline phosphatase (U/L)** 67.10 ± 3.6 74.30 ± 5.6 91.10 ± 5.7 (reference: 30-160 U/L)
Data are reported as means ± SEM.
#P< 0.001 for PMC vs CG and PMC vs GMC; *P < 0.05 for CG vs GMC; **P< 0.01 for
CG vs PMC; +P < 0.05 for GMC vs PMC (ANOVA was used for the comparative analysis of the three groups, followed by the multiple comparison Tukey test for pairwise analysis of the groups).
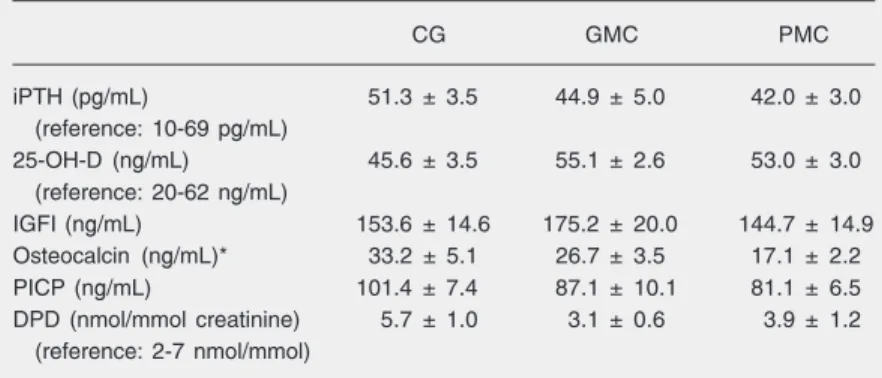
Table 2. Serum iPTH, 25-OH-D, IGFI, osteocalcin, PICP levels, and urinary DPD levels of normal individuals (control group, CG) and of diabetic patients with good (GMC) and poor (PMC) metabolic control.
CG GMC PMC
iPTH (pg/mL) 51.3 ± 3.5 44.9 ± 5.0 42.0 ± 3.0
(reference: 10-69 pg/mL)
25-OH-D (ng/mL) 45.6 ± 3.5 55.1 ± 2.6 53.0 ± 3.0
(reference: 20-62 ng/mL)
IGFI (ng/mL) 153.6 ± 14.6 175.2 ± 20.0 144.7 ± 14.9
Osteocalcin (ng/mL)* 33.2 ± 5.1 26.7 ± 3.5 17.1 ± 2.2
PICP (ng/mL) 101.4 ± 7.4 87.1 ± 10.1 81.1 ± 6.5
DPD (nmol/mmol creatinine) 5.7 ± 1.0 3.1 ± 0.6 3.9 ± 1.2
(reference: 2-7 nmol/mmol)
Data are reported as means ± SEM. iPTH = intact parathyroid hormone; 25-OH-D = 25-hydroxyvitamin D; IGFI = insulin-like growth factor I; PICP = procollagen type I C propeptide; DPD = deoxypyridinoline.
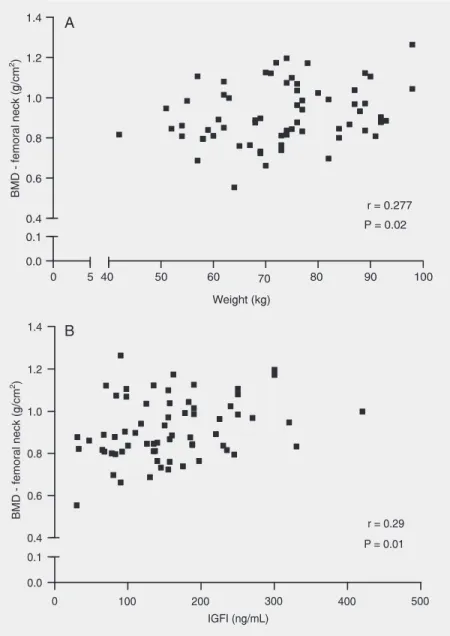
There was no correlation between mark-ers of bone formation and resorption and BMD either in the lumbar spine or in the femoral neck. There was a positive correla-tion between weight and femoral neck BMD (r = 0.27, P = 0.02) (Figure 1A) and between IGFI levels and femoral neck BMD (r = 0.29, P = 0.01; Figure 1B). There was no correlation between BMD and plasma glu-cose levels.
Discussion
Diabetes mellitus and osteoporosis are two clinical syndromes with great impact on public health. Most diabetic patients (90%) have the type 2 form of the disease, a fact that makes it particularly important to clarify whether this population is predisposed to the development of osteoporosis. In the present study, we observed that patients with type 2 DM did not present a reduction in bone mass or changes in PICP or DPD levels even after a long period of lack of metabolic control.
Theoretically, several mechanisms may be suggested to be responsible for low bone mass in DM, such as insulinopenia (14,15), microangiopathy (16,17) and increased in-terleukin elevation (18). In turn, the lack of metabolic control may potentially affect also the maintenance of bone mass, interfering not only with the equilibrium of mineral metabolism (19,20), but also with bone re-modeling activity (21,22).
The polyuria provoked by hyperglyce-mia can induce urinary loss of calcium, phos-phorus and magnesium (20). However, our results did not show the occurrence of sig-nificant changes in serum calcium, phos-phorus or magnesium levels in patients with type 2 DM even in the presence of poor metabolic control. In addition, we did not observe the occurrence of physiological ad-aptations of secondary hyperparathyroidism in these patients. The present results agree with data obtained by our group in a previ-ous study in which we evaluated basal and
hypocalcemia-stimulated iPTH secretion in-duced by EDTA administration (23). In that study we did not observe an increase in iPTH secretion in patients with poorly con-trolled DM (23). Furthermore, in the present study we observed that the chronic lack of metabolic control in type 2 DM does not interfere with the state of vitamin D suffi-ciency.
Regarding the influence of hyperglyce-mia on bone remodeling activity, we did not observe a correlation between plasma glu-cose levels and the biochemical parameters of bone formation and resorption, a fact suggesting that the lack of metabolic control does not induce an increase in bone turn-over. This was further supported by the fact that the DPD levels of patients with poor metabolic control were similar to those of normal individuals and of patients with good metabolic control. However, we observed that patients with type 2 DM with poor meta-bolic control presented significantly lower osteocalcin levels than normal individuals. These results agree with those reported in other studies, but their significance is not fully understood (24). In other situations in which there is a reduction of osteocalcin levels, both protection (e.g., in obesity) (25, 26) and impairment (e.g., in old age) (27-29) of bone mass have been observed. It is inter-esting to observe that, regarding the other biochemical parameter of bone formation, i.e., PICP, the serum levels of the three groups were similar.
Our results showed that, in contrast to what occurs in individuals with type 1 DM, patients with type 2 DM had normal IGFI levels even in the presence of poor chronic control. In addition, we observed that IGFI levels in type 2 diabetics were positively correlated with femoral neck BMD. IGFI has an important stimulating function re-garding osteoblastic activity, with the pro-duction of IGFI in the bone microenviron-ment appearing to have a greater influence on the stimulation of bone formation. How-ever, Yakar and Rosen (30) demonstrated that systemic IGFI of hepatic origin also participates in the process of bone mass maintenance.
The present results show that patients with type 2 DM studied about 10 years after the diagnosis and even with poor chronic metabolic control presented lumbar spine and femoral neck bone mass similar to that of normal individuals. These results per-sisted when the male and female subgroups of each group were evaluated. In addition, we did not observe a correlation between hyperglycemia and BMD.
DM is a heterogeneous disorder in terms of various clinical and etiologic aspects, which have in common hyperglycemia. Thus, it is possible that the association of DM with osteopenia represents one more aspect of the heterogeneity of this disorder. Type 2 DM is associated with obesity, hyperandrogenism, elevation of estrogen levels, normal IGFI, and frequently hyperinsulinemia, (15,31,32), which are factors that protect against the loss of bone mass. In contrast, type 1 DM is associated with insulinopenia, weight loss, low IGFI levels (15), and frequently with amenorrhea and hypoestrogenism, which are associated with osteopenia. The present data indicate that hyperglycemia does not seem to be a mechanism involved in the induction of osteopenia, since the lack of metabolic control does not cause significant changes in the biochemical parameters of mineral me-tabolism control, i.e., PTH and 25-OH-D, or in the parameters that reflect bone remodel-ing activity. Finally, the bone mass of the lumbar spine and femoral neck of type 2 diabetics is similar to that of normal indi-viduals regardless of metabolic control.
Acknowledgments
References
1. Paula FJ, Foss MC. Muscle uptake of inorganic phosphorus during oral glucose challenge. Horm Metab Res 1990; 22: 506-507. 2. Kumar S, Olukoga AO, Gordon C, Mawer EB, France M, Hosker JP,
et al. Impaired glucose tolerance and insulin insensitivity in primary hyperparathyroidism. Clin Endocrinol 1994; 40: 47-53.
3. Paolisso G, Scheen A, D’Onofrio F, Lefebvre P. Magnesium and glucose homeostasis. Diabetologia 1990; 33: 511-514.
4. Paula FJ, Plens AE, Foss MC. Effects of hypophosphatemia on glucose tolerance and insulin secretion. Horm Metab Res 1998; 30: 281-284.
5. Kayath MJ, Dib AS, Vieira JG. Prevalence and magnitude of osteo-penia associated with insulin-dependent diabetes mellitus. J Diabe-tes Complications 1998; 18: 97-104.
6. Tuominen JT, Impivaara O, Puukka P, Ronnemaa T. Bone mineral density in patients with type 1 and type 2 diabetes. Diabetes Care
1999; 22: 1196-1200.
7. Sosa M, Dominguez M, Navarro MC, Segarra MC, Hernandez D, de Pablos P, et al. Bone mineral metabolism is normal in non-insulin-dependent diabetes mellitus. J Diabetes Complications 1996; 10: 201-205.
8. Barrett-Connor E, Kritz-Silverstein D. Does hyperinsulinemia pre-serve bone? Diabetes Care 1996; 19: 1388-1392.
9. van Daele PL, Stolk RP, Burger H, Algra D, Grobbee DE, Hofman A, et al. Bone density in non-insulin-dependent diabetes mellitus. The Rotterdam Study. Ann Intern Med 1995; 122: 409-414.
10. Gregorio F, Cristallini S, Santeusanio F, Filipponi P, Fumelli P. Osteopenia associated with non-insulin-dependent diabetes melli-tus: what are the causes? Diabetes Res Clin Pract 1994; 23: 43-54. 11. Kwon DJ, Kim JH, Chung KW, Kim JH, Lee JW, Kim SP, et al. Bone mineral density of the spine using dual energy X-ray absorptiometry in patients with non-insulin-dependent diabetes mellitus. J Obstet Gynaecol Res 1996; 22: 157-162.
12. Diabetes Control and Complications Trial Research Group. The effect of intensive treatment of diabetes on the development and progression on long term complications in insulin-dependent diabe-tes mellitus. N Engl J Med 1993; 329: 977-986.
13. U.K. Prospective Diabetes Study (UKPDS) Group. Intensive blood-glucose control with sulfonylureas or insulin compared with conven-tional treatment and risk of complications in patients with type 2 diabetes (UKPDS 33). Lancet 1998; 352: 837-853.
14. Buysschaert M, Cauwe F, Jamart J, Brichant C, De Coster P, Magnan A, et al. Proximal femur density in type 1 and 2 diabetic patients. Diabete Metab 1992; 18: 32-37.
15. Jehle PM, Jehle DR, Mohan S, Bohm BO. Serum levels of insulin-like growth factor system components and relationship to bone metabolism in type 1 and type 2 diabetes mellitus patients. J Endo-crinol 1998; 159: 297-306.
16. Campos Pastor MM, Lopez-Ibarra PJ, Escobar-Jimenez F, Serrano P, Garcia-Cervigon AG. Intensive insulin therapy and bone mineral density in type 1 diabetes mellitus: a prospective study. Osteoporos Int 2000; 11: 455-459.
17. Rix M, Andreassen H, Eskildsen P. Impact of peripheral neuropathy on bone density in patients with type 1 diabetes. Diabetes Care
1999; 22: 827-831.
18. Rachon D, Mysliwska J, Suchecka-Rachon K, Semetkowska-Jurkiewicz B, Zorena K, Lysiak-Szydlowska W. Serum interleukin-6 levels and bone mineral density at the femoral neck in post-meno-pausal women with type 1 diabetes. Diabet Med 2003; 20: 475-480. 19. McNair P, Madsbad S, Christiansen C, Christensen MS, Faber OK, Binder C, et al. Bone loss in diabetes: effects of metabolic state.
Diabetologia 1979; 17: 283-286.
20. Monnier L, Colette C, Aguirre L, Sany C, Mirourze J. Intestinal and renal handling of calcium in human diabetes mellitus: influence of acute oral glucose loading and diabetic control. Eur J Clin Invest
1978; 8: 225-231.
21. McNair P, Madsbad S, Christensen MS, Christiansen C, Faber OK, Binder C, et al. Bone mineral loss in insulin-treated diabetes melli-tus: studies on pathogenesis. Acta Endocrinol 1979; 90: 463-472. 22. Piepkorn B, Kann P, Forst T, Andreas J, Pfutzner A, Beyer J. Bone
mineral density and bone metabolism in diabetes mellitus. Horm Metab Res 1997; 29: 584-591.
23. Paula FJ, Lanna CM, Shuhama T, Foss MC. Effect of metabolic control on parathyroid hormone secretion in diabetic patients. Braz J Med Biol Res 2001; 34: 1139-1145.
24. Akin O, Gol K, Akturk M, Erkaya S. Evaluation of bone turnover in postmenopausal patients with type 2 diabetes mellitus using bio-chemical markers and bone mineral density measurements. Gynecol Endocrinol 2003; 17: 19-29.
25. Hyldstrup L, Andersen T, McNair P, Breum L, Transbol I. Bone metabolism in obesity: changes related to severe overweight and dietary weight reduction. Acta Endocrinol 1993; 129: 393-398. 26. Ribot C, Tremollieres F, Pouilles JM, Bonneu M, Germain F, Louvet
JP. Obesity and postmenopausal bone loss: the influence of obesity on vertebral density and bone turnover in postmenopausal women.
Bone 1988; 8: 327-331.
27. Kim JG, Shin CS, Choi YM, Moon SY, Kim SY, Lee JY. The relation-ship among circulating insulin-like growth factor components, bio-chemical markers of bone turnover and bone mineral density in postmenopausal women under the age of 60. Clin Endocrinol 1999; 51: 301-307.
28. Luisetto G, Bottega F, Nardi A, Ziliotto D. Decrease of bone forma-tion in adult women with fragility fractures. Maturitas 1997; 28: 59-67.
29. Isaia GC, Ardissone P, Di Stefano M, Ferrari D, Martina V, Porta M, et al. Bone metabolism in type 2 diabetes mellitus. Acta Diabetol
1999; 36: 35-38.
30. Yakar S, Rosen CJ. From mouse to man: redefining the role of insulin-like growth factor-I in the acquisition of bone mass. Exp Biol Med 2003; 228: 245-252.
31. Cortizo AM, Lee PD, Cedola NV, Jasper H, Gagliardino JJ. Relation-ship between non-enzymatic glycosylation and changes in serum insulin-like growth factor-1 (IGF-1) and IGF-binding protein-3 levels in patients with type 2 diabetes mellitus. Acta Diabetol 1998; 35: 85-90.