ACPD
4, 7487–7511, 2004AMSU retrieval precision for mean
UTH
C. Jim ´enez et al.
Title Page
Abstract Introduction
Conclusions References
Tables Figures
◭ ◮
◭ ◮
Back Close
Full Screen / Esc
Print Version
Interactive Discussion
©EGU 2004 Atmos. Chem. Phys. Discuss., 4, 7487–7511, 2004
www.atmos-chem-phys.org/acpd/4/7487/ SRef-ID: 1680-7375/acpd/2004-4-7487 © European Geosciences Union 2004
Atmospheric Chemistry and Physics Discussions
A practical demonstration on AMSU
retrieval precision for upper tropospheric
humidity by a non-linear multi-channel
regression method
C. Jim ´enez1, P. Eriksson2, V. O. John3, and S. A. Buehler3
1
Institute of Atmospheric and Environmental Science, The University of Edinburgh, Edinburgh, UK
2
Department of Radio and Space Science, Chalmers University of Technology, Gothenburg, Sweden
3
Institute of Environmental Physics, University of Bremen, Bremen, Germany
ACPD
4, 7487–7511, 2004AMSU retrieval precision for mean
UTH
C. Jim ´enez et al.
Title Page
Abstract Introduction
Conclusions References
Tables Figures
◭ ◮
◭ ◮
Back Close
Full Screen / Esc
Print Version
Interactive Discussion
©EGU 2004
Abstract
A neural network algorithm inverting selected channels from the A and AMSU-B instruments was applied to retrieve layer averaged relative humidity. The neural network was trained with a global synthetic dataset representing clear-sky conditions. A precision of around 6% was obtained when retrieving global simulated radiances,
5
the precision deteriorated less than 1% when real mid-latitude AMSU radiances were inverted and compared with co-located data from a radiosonde station. The 6% pre-cision outperforms by 1% the reported prepre-cision estimate from a linear single-channel regression between radiance and weighting function averaged relative humidity, the more traditional approach to exploit AMSU data. Added advantages are not only a
10
better precision; the AMSU-B humidity information is more optimally exploited by in-cluding temperature information from AMSU-A channels; and the layer averaged hu-midity is a more physical quantity than the weighted huhu-midity, for comparison with other datasets. The training dataset proved adequate for inverting real radiances from a mid-latitude site, but it is limited by not considering the impact of clouds or surface
15
emissivity changes, and further work is needed in this direction for further validation of the precision estimates.
1. Introduction
Upper tropospheric humidity (UTH) is an essential component of the Earth’s climate system. Apart from having clear implications for the chemistry and dynamics of the
20
upper troposphere, it is also recognised a main factor controlling the balance between incoming short-wave and outgoing long-wave radiation (Held and Soden,2000). De-spite this importance, it is admitted that the global, regional and seasonal distribution of UTH is still not sufficiently well known. Especially for climate studies, there is a clear need for monitoring UTH with a view to establishing the present mean state and
vari-25
ACPD
4, 7487–7511, 2004AMSU retrieval precision for mean
UTH
C. Jim ´enez et al.
Title Page
Abstract Introduction
Conclusions References
Tables Figures
◭ ◮
◭ ◮
Back Close
Full Screen / Esc
Print Version
Interactive Discussion
©EGU 2004 global and continuous measurements of UTH.
Traditionally, global and continuous datasets of UTH have been provided from me-teorological radiosondes and polar orbiting infrared sensors measuring the 6.7µm re-gion. However, both sets suffer from problems: radiosondes are known to have dif-ficulties when measuring in the upper troposphere (Elliot and Gaffen, 1991), while
5
the infrared measurements cannot penetrate clouds, restricting the coverage of the datasets to clear and partially cloudy conditions (Soden and Lanzante, 1996). More recently, microwave sounders detecting the water vapour transition at 183.3 GHz have started to provide data with humidity information less degraded by cloud biases. One of them is the AMSU instrument series, on board the National Oceanic and
Atmo-10
spheric Administration (NOAA) satellites. In the future, different versions of AMSU are expected to fly also in MetOp satellites, Europe’s first polar-orbiting meteorological satellites, with a predicted dataset of measurement from both missions spanning more than 20 years. This makes AMSU a very attractive sensor for providing a global and continuous dataset of UTH if the data can be adequately exploited.
15
AMSU data are currently in use for numerical weather prediction, with the radiances directly assimilated into the forecast models. The data seems less exploited for a direct estimation of UTH. Temperature and moisture profiles were retrieved by an itera-tive minimum variance algorithm from measured AMSU-A and AMSU-B inRosenkranz
(2001), but no derivation of UTH values is reported. Greenwald and Christopher(2002)
20
studied the effect of clouds in UTH derived from AMSU-B radiances, with the UTH de-rived from a simplified relationship between UTH and brightness temperature originally developed for infrared data (Soden and Bretherton,1996), but no precision estimates of the retrieval were given. The same relationship was studied in detail by Buehler
and John (2004) for AMSU-B radiances, where precision estimates of UTH are
re-25
ACPD
4, 7487–7511, 2004AMSU retrieval precision for mean
UTH
C. Jim ´enez et al.
Title Page
Abstract Introduction
Conclusions References
Tables Figures
◭ ◮
◭ ◮
Back Close
Full Screen / Esc
Print Version
Interactive Discussion
©EGU 2004 that AMSU-A channels bring temperature information helping the interpretation of the
humidity information from AMSU-B channels.
The objective of this paper is to give a first estimation of retrieval precision for UTH values derived by inverting radiances from a selected number of AMSU channels. A non-linear regression approach implemented by neural networks was judged sufficient
5
to model the inverse mapping between AMSU radiances and UTH values. Neural networks were already used inCabrera-Mercader and Staelin (1995) for retrievals of moisture profiles from synthetic radiances at channels resembling the AMSU channels, with performance comparable or superior to a complex physical and iterative retrieval algorithm. Physical iterative inversions, such as Rosenkranz (2001), are also valid
10
inversion tools, but the non-linearity of the mapping between radiances and UTH makes them computationally expensive. The neural network approach is very efficient as a whole set of measurements can be retrieved at once. But, as in other regression tools, caution has to be taken regarding the regression dataset employed, as its quality will reflect on the quality of the regressions obtained.
15
The neural networks are here trained with a dataset consisting of atmospheric states from the assimilation-forecast system of the European Centre for Medium-Range Weather Forecasts (ECMWF) and corresponding simulated radiances from a forward model. As mentioned before, the radiosonde humidity data suffer from problems, so a regression dataset based on co-locations of radiosondes and AMSU pixels will clearly
20
be suffering from biases. Nevertheless, some radiosonde stations have made an effort to improve their humidity data, allowing the data to be used for validation if a reason-able co-location between radiosonde launches and AMSU pixels can be achieved, as was the case inBuehler et al.(2004b). Here we will follow the same approach and use high quality data from the same radiosonde station to check the precision when using
25
measured AMSU radiances.
To make this work as general as possible, a simple average value of relative humidi-ties in a fixed layer between 500 and 200 HPa will be retrieved. This is in contrast to
parame-ACPD
4, 7487–7511, 2004AMSU retrieval precision for mean
UTH
C. Jim ´enez et al.
Title Page
Abstract Introduction
Conclusions References
Tables Figures
◭ ◮
◭ ◮
Back Close
Full Screen / Esc
Print Version
Interactive Discussion
©EGU 2004 ter retrieved is calculated by weighting the relative humidity with the radiance weighting
function with respect to relative humidity. This results in measurements with poor reg-istration, as there is a significant uncertainty regarding the height range for the UTH values derived. For instance, the drier the atmopshere the lowest the altitudes that are sampled, this because the weighting function shape changes with changes in the
5
relative humidity. Despite these limitations, regressions based on the simplified rela-tionship ofSoden and Bretherton(1996) use weighted humidity as the approximations involved work better than when using layer averaged humidity. Here, we will use layer averaged humidity as the precision reported will be related to a more physical quan-tity, in the sense of depending less on the instrument performance, making it easier to
10
compare with humidty reported from other inversion approaches or instruments. The paper is organised as follows: first, the AMSU instrument and the sources of data are presented in Sect. 2. This is followed by a description of the training sets and retrieval algorithm in Sect.3. Then retrieval precisions, inversion approaches and validation of the precision estimates are commented in Sect.4. Finally, Sect.5 gives
15
the main conclusions.
2. Data
2.1. AMSU-A and AMSU-B
AMSU data from the instruments on board the satellite NOAA-15 is used here. De-tails on AMSU-A and AMSU-B instruments can be found inMo(1996) andSaunders
20
et al. (1995), respectively. They are cross-track scanning microwave sensors with a swath width of approximately 2300 km. These instruments measure microwave ther-mal emission emitted by the atmosphere in the oxygen band of 50–58 GHz (AMSU-A), the two water vapour lines at 22 GHz (AMSU-A) and 183 GHZ (AMSU-B), and window regions (both). AMSU has 20 channels, where channels 1–15 are part of AMSU-A and
25
ACPD
4, 7487–7511, 2004AMSU retrieval precision for mean
UTH
C. Jim ´enez et al.
Title Page
Abstract Introduction
Conclusions References
Tables Figures
◭ ◮
◭ ◮
Back Close
Full Screen / Esc
Print Version
Interactive Discussion
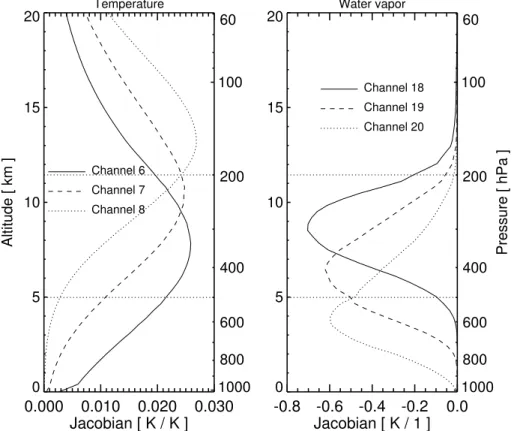
©EGU 2004 be obtained from the channels 4–14 of AMSU-A, where channels 6–8 give information
on the upper troposphere as shown in the left panel of Fig.1. The three channels 18, 19, and 20 of AMSU-B which are centred around 183.31 GHz water vapour line can give humidity information on the upper, middle, and lower troposphere, respectively as displayed in the right panel of Fig.1.
5
AMSU-A and AMSU-B scan the atmosphere with different footprints. AMSU-A sam-ples the atmosphere in 30 scan positions across the track with a footprint size of 50×50 km2for the innermost scan position. This size increases to 150×80 km2for the outermost position from nadir. AMSU-B samples the atmosphere in 90 scan positions with footprint size varies from 20×16 km2to 64×52 km2.
10
2.2. ECMWF data
The ECMWF dataset consists of 13 495 atmospheric profiles of temperature, water vapour and ozone. The dataset is described in Chevalier (2001). The profiles are vertically sampled in 60 pressure-levels, while globally the profiles are distributed in order to cover the atmospheric variability as much as possible. This makes the dataset
15
specially suitable for regression applications. Examples of its application are given, for instance, inChevalier and Mahfouf(2001) andBuehler and John(2004). Here the UTH from the dataset is calculated from the corresponding humidity profiles in the dataset as the layer averaged relative humidity between 500 and 200 HPa.
2.3. Radiosonde data
20
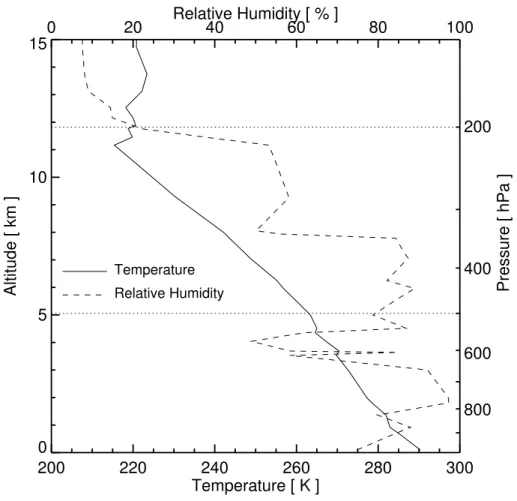
In this study we used radiosonde data measured at the Meteorological Observatory Lindenberg, located at 52◦22′N, 14◦12′E, obtained through the British Atmospheric Data Centre (BADC). The humidity data from Lindenberg have undergone several cor-rections and quality control (Leiterer et al.,1997;Buehler et al.,2004b). Typical tem-perature and relative humidity profiles are shown in Fig.2. The UTH is defined as in
25
ACPD
4, 7487–7511, 2004AMSU retrieval precision for mean
UTH
C. Jim ´enez et al.
Title Page
Abstract Introduction
Conclusions References
Tables Figures
◭ ◮
◭ ◮
Back Close
Full Screen / Esc
Print Version
Interactive Discussion
©EGU 2004 station from the year 2000 to 2004.
3. Methodology
UTH retrievals are produced here by a regression algorithm based on feed-forward multi-layer perceptrons (MLPs), a type of neural network broadly used for non-linear regressions. The MLPs are used to construct a model of the distribution underlined by
5
a set of training data. The reader is referred toBishop(1995a) for a general introduction to MLPs. An introduction to MLPs in the context of atmospheric inversions is given inJim ´enez and Eriksson (2001). Here we concentrate on the specific details of the practical implementation, first the construction of the training set is presented, followed by a description of the topology of the MLPs and the training algorithm.
10
3.1. Training sets
3.1.1. ECMWF dataset
AMSU radiances are simulated by running the forward model ARTS (Buehler et al.,
2004a) on the atmospheric states of the ECMWF dataset. These are clear sky simula-tions, only gaseous absorption from water vapour, oxygen, and nitrogen was included
15
in the calculations, and no liquid absorption or scattering effects are considered. The input to the forward model was the humidity and temperature profiles from the dataset. The surface emissivity was fixed at 0.95 over land and 0.6 over sea. As it can be seen in Fig. 1, the channels used in the study normally are not severely affected by the properties of the surface, but this is not the case under dry conditions, specially
20
ACPD
4, 7487–7511, 2004AMSU retrieval precision for mean
UTH
C. Jim ´enez et al.
Title Page
Abstract Introduction
Conclusions References
Tables Figures
◭ ◮
◭ ◮
Back Close
Full Screen / Esc
Print Version
Interactive Discussion
©EGU 2004 The monochromatic calculations were convolved with the sensor bandpass, and
ran-dom noise similar to the expected noise of the sensor added to the radiances. The radiances were calculated for different nadir angles, to include the effects of varying ob-servation geometry. The same nadir angle was assumed for the AMSU-A and AMSU-B instruments.
5
The training set is formed by the AMSU radiances and the UTH values derived from the humidity profiles. The AMSU data are the channels selected for the regression plus the instrument looking nadir angles. The later is needed to correct for the limb darkening or brightening at off-nadir radiances. The dataset consist of 12 053 UTH values and the corresponding ARTS radiances, once the filtering for transmission to
10
the surface was applied. The training set uses two thirds of the data, randomly selected from the total dataset. The remaining data are used to estimate the retrieval precision by applying the trained MLP to the radiances from this validation set.
3.1.2. Lindenberg dataset
A validation dataset is built by matching radiosonde profiles with measured radiances
15
from a number of AMSU pixels. A single AMSU pixel can not be matched to a given radiosonde. The satellite over-pass time can be up to three hours before or after the radiosonde launch. In addition, the sonde drifts during its ascent, so the radiosonde data might not be representative of the launch site. The issue of matching radiosondes and AMSU-B pixels at Lindenberg was also discussed by Buehler et al.(2004b), the
20
selection of the training set follows some of the ideas presented there. The basic idea is to select a set of pixels within 50 km of the radiosonde launch based on considerations of atmospheric homogeneity and time differences. We then average the radiances from these pixels to obtain a one to one mapping between radiosondes and UTH values.
The selection of pixels was done as follows:
25
ACPD
4, 7487–7511, 2004AMSU retrieval precision for mean
UTH
C. Jim ´enez et al.
Title Page
Abstract Introduction
Conclusions References
Tables Figures
◭ ◮
◭ ◮
Back Close
Full Screen / Esc
Print Version
Interactive Discussion
©EGU 2004 over-pass time was compared with a threshold value. The displacement was
estimated by multiplying the average wind speed from the sonde by the time dif-ference between the satellite over-pass and the sonde launch. The threshold was set to 50 km, as it was estimated that the radiosonde can drift around 50 km during its ascent to tropopause levels. Then AMSU-B pixels, where the sonde estimated
5
displacement was larger than 50 km, were discarded to increase the likelihood of the AMSU-B pixel measuring the same air mass as the radiosonde.
2. Atmospheric inhomogeneity was estimated by calculating the standard deviation of the channel-18 pixel radiances. In situations of large atmospheric inhomo-geneity, even the average of pixel radiances could be a poor matching for the
10
given radiosonde. This is because the whole air mass measured by the satellite might be not representative of the air masses measured by the radiosonde. To filter out these poor matches, the standard deviation was compared with a thresh-old limit. Setting the threshthresh-old limit is somewhat arbitrary. On one hand, a very small value will assure very representative matches. On the other hand, it could
15
discard matches that could be of interest for representing the mapping. A value of 1.6 K has been used here, as a compromise to remove the worst cases of inhomogeneity, but leaving a sufficiently large dataset.
3. For each AMSU-B pixel selected by the previous criteria the closest AMSU-A pixel is selected. The footprints of AMSU-A and AMSU-B are different, as commented
20
in Sect.2, but no effort has been made to find an optimal convolution of AMSU-A to AMSU-B pixels. This approach is clearly non-optimal, but it was found adequate for the purpose of this exercise.
4. The selected AMSU-B and AMSU-A pixels are radiance-averaged for all channels and associated to the UTH values derived from the corresponding radiosonde
25
profiles.
pix-ACPD
4, 7487–7511, 2004AMSU retrieval precision for mean
UTH
C. Jim ´enez et al.
Title Page
Abstract Introduction
Conclusions References
Tables Figures
◭ ◮
◭ ◮
Back Close
Full Screen / Esc
Print Version
Interactive Discussion
©EGU 2004 els, the dataset consisted of 895 cases.
3.2. Topology
The neural network algorithm is based on training a MLP with one hidden layer. The number of input nodes is the number of inputs to the MLP: in this case the number of AMSU channels used in the regression, plus the instrument looking nadir angles.
5
There is one hidden layer consisting of a number of neurons with hyperbolic tangent activation functions, followed by an output neuron with also a hyperbolic tangent activa-tion funcactiva-tion. This was preferred to the most commonly used linear activaactiva-tion funcactiva-tion, as it allows us to limit the output of the MLP to the output range given in the train-ing set. This is done by linearly transformtrain-ing the traintrain-ing outputs of the MLP into the
10
range [−1,1] before the data is applied to the MLP. As the hyperbolic tangent function returns values in the range [−1,1], the limitation to the original output range of val-ues is achieved. The weights of the MLP are initialised following the Nguyen-Widrow method (Nguyen and Widrow,1990). Before training, inputs to the MLPs are also lin-early transformed into the range [−1,1] to make the initialisation of the weights more
15
effective.
3.3. Training algorithm
As stated before, the MLP is trained to provide a model of the probability distribu-tion underlined by the training data. Here this will be the a posteriori distribudistribu-tion of the retrieved state given a measurement, and the MLP will be trained to provide the
20
most probable solution of this a posteriori distribution. Previously, a distribution for the weights is set favouring small values. This is done to improve the generalisation ca-pacity of the MLP, as small weights encourage smoother mapping less likely to over-fit to the training set.
Finding the maximum a posteriori solution is equivalent to minimising the error
ACPD
4, 7487–7511, 2004AMSU retrieval precision for mean
UTH
C. Jim ´enez et al.
Title Page
Abstract Introduction
Conclusions References
Tables Figures
◭ ◮
◭ ◮
Back Close
Full Screen / Esc
Print Version
Interactive Discussion
©EGU 2004 tion
β
L
X
l=1
ku(xl,w)−tlk2+α kwk2=βED+αEW , (1)
where{xl,tl}l=1···Lis the training set of radiances (x) and corresponding humidity values
(t), L is the number of cases in the training set, w is a vector with the weights of the MLP,u represents the output of the MLP, β and α are parameters setting a trade-off
5
between both terms of the error function, andk · k is the Euclidean norm (see, e.g.
Bishop,1995b).
The practical implementation follows the work ofForesee and Hagan(1997), where the parameters β and α are estimated to produce a MLP with good generalisation. Generalisation and model complexity are then regulated by the training algorithm and
10
no other methods such as structural stabilisation or cross-validation are used here. This makes the choice of the number of nodes in the hidden layer not too critical, though a reasonable number has to be selected by taking into account the number of MLP inputs. Here 2 to 6 nodes in the hidden layer are used, depending on the number of MLP inputs.
15
4. Results and discussion
4.1. Retrieval precision
MLPs with different AMSU channels as inputs were trained with the ECMWF training set and then used to invert the radiances from the ECMWF validation set. The retrieval error is the difference between the UTH from the dataset and the UTH derived from
20
ACPD
4, 7487–7511, 2004AMSU retrieval precision for mean
UTH
C. Jim ´enez et al.
Title Page
Abstract Introduction
Conclusions References
Tables Figures
◭ ◮
◭ ◮
Back Close
Full Screen / Esc
Print Version
Interactive Discussion
©EGU 2004 During the training it was observed that the division of the dataset into training and
validation sets slightly affected the results. This is unavoidable due to the limited num-ber of cases available, making the sets to represent slightly different mappings due to the specific data included after each random selection. In order to give representative results, for each regression 10 independent trainings with different training and
valida-5
tion sets were performed, reporting the results as a mean of the results obtained for the individual trainings.
First, regressions with AMSU-B radiances were performed for different combinations of channels. The results are given in Table1. Using channel 18 and 19 clearly outper-forms using only channel 18. This is not surprising. The humidity weighting functions
10
in Fig.1show that channel 19 can provide valuable information at the pressure levels where the UTH is averaged. Adding channel 20 further improves the retrievals, but channel 20 is likely to be influenced by the surface. As no surface emissivity variability was introduced in the training mapping, the results are likely to overestimate the real retrieval precision.
15
To further improve the retrieval performance, regressions including AMSU-A chan-nels were performed. Having temperature information should help interpretation of the humidity information. This is clearly shown in the regressions, also shown in Table1. Adding channels 6 and 7 brought the larger improvements. Looking at the temperature weighting functions in Fig.1, it is clear that both channels, specially channel 6,
con-20
tribute with temperature information in the pressure range where the UTH was defined. As with channel 20, channel 6 could be affected by the surface emission, so some poorer results might be possible due to ground contamination.
The MLPs with the combination of all channels 6, 7, 8, 18, 19, and 20 only brought a very marginal improvement, so the combination of channels 6, 7, 18 and 19 was
25
ap-ACPD
4, 7487–7511, 2004AMSU retrieval precision for mean
UTH
C. Jim ´enez et al.
Title Page
Abstract Introduction
Conclusions References
Tables Figures
◭ ◮
◭ ◮
Back Close
Full Screen / Esc
Print Version
Interactive Discussion
©EGU 2004 proximately 6%. This figure corresponds to regression with a global dataset, but no
clouds were included in the simulations. Although the microwave observations have an advantage over infrared measurements concerning the impact of clouds, they are not completely free from cloud effects, specially at tropical latitudes were strong convec-tive clouds and thick cirrus clouds produce observable scattering of the AMSU radiance
5
(Greenwald and Christopher, 2002). A poorer precision might be expected for these scenarios, as the mapping uncertainties due to clouds will map into retrieval errors, but its impact on the error budget remains to be quantified.
4.2. Retrieval approaches
The traditional way of exploiting these datasets is to do a linear regression between
10
the radiance from the most sensitive channel and the logarithm of weighting function averaged relative humidity (Soden and Bretherton,1996). Here we use channel 18 for the regression and the layer averaged humidity from our dataset, not weighted humidity, in order to compare with the MLP results. The regression takes the form
ln
UTH cosθ
=a+bTb, (2)
15
whereθis the nadir angle of the instrument, a and b are the regression coefficients, and Tb is the channel 18 radiance. The regression coefficients are a=27.47 and b=−0.097K−1, and the statistics of the retrieval error are given in Table1.
Comparing with the MLP regression using channel 18 and the nadir angle, the linear regression has a 1% poorer precision, with a larger bias. Even if the assumption of a
20
logarithm relation between radiances and humidity is a reasonable approximation, the MLP has the capacity of modelling a more complex relation, which should bring it closer to the the true mapping between radiances and humidity. The differences in precision get significantly larger when the MLP starts to use more inputs, showing the advantage of the neural network approach in combining the information from other channels for a
25
ACPD
4, 7487–7511, 2004AMSU retrieval precision for mean
UTH
C. Jim ´enez et al.
Title Page
Abstract Introduction
Conclusions References
Tables Figures
◭ ◮
◭ ◮
Back Close
Full Screen / Esc
Print Version
Interactive Discussion
©EGU 2004 Regression with the same ECMWF dataset and weighted humidity are reported in
Buehler and John(2004). The advantage of using weighted humidity instead of layer averaged humidity for the linear regression approach is demonstrated there, as they report a precision of 7%, much smaller than the 13% obtained here. However, as commented in Sect.1, we prefer the layer averaged humidity as it gives a more physical
5
retrieval parameter, even at the cost of a poorer performance. Nevertheless, the MLP regression with temperature channels outperforms by 1% in precision the results of the linear regression inBuehler and John(2004), with much smaller bias. The advantage of the neural network approach is also clear in this comparison, as the neural network can retrieve a humidity parameter easier to interpret than the weighted humidity of the
10
linear regression, with a slightly better precision.
4.3. Retrieval validation
The AMSU radiances from the Lindenberg dataset were inverted by the MLP with chan-nels 6, 7, 18 and 19 trained with the ECMWF dataset. The statistics of the retrieval error, difference between UTH from the radiosonde and retrieved UTH from the MLP,
15
are also given in Table1. The results are in good agreement with the precision given by the ECMWF dataset. They have only 0.8% poorer precision, and slightly higher bias. A higher error for the Lindenberg data can be expected, considering the problem of co-locating radiosonde and AMSU observations, possible instrumental biases, and that the synthetic training set assumed a constant surface emissivity and cloud-free
20
conditions. The surface effects might have not had a large impact here, as the value of surface emissivity used over land in the simulations seems to agree well with an esti-mate of surface emissivity around Lindenberg area (Buehler et al.,2004b). The cloud effects also seems not too critical here, as the differences between precisions for sim-ulated and validated datasets are small. But it should be noted that scattering or liquid
25
absorption from clouds at this mid-latitude site are not as critical as if the validation were done, for instance, for more tropical conditions.
ACPD
4, 7487–7511, 2004AMSU retrieval precision for mean
UTH
C. Jim ´enez et al.
Title Page
Abstract Introduction
Conclusions References
Tables Figures
◭ ◮
◭ ◮
Back Close
Full Screen / Esc
Print Version
Interactive Discussion
©EGU 2004 retrieval error can be seen in Fig.4. The error distribution is not far from a Gaussian
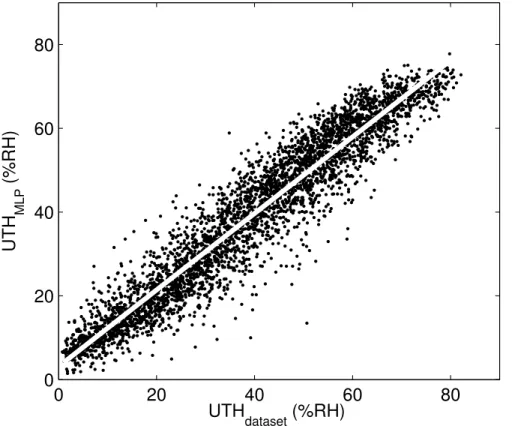
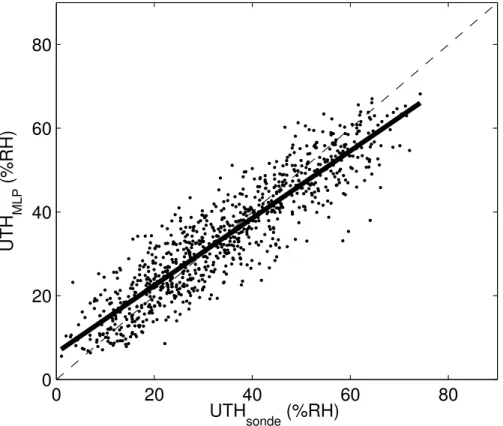
distribution, though some larger than expected underestimation of values is observed in the left tail of the distribution. A scatter plot showing the correlation between radiosonde and retrieved UTH values is plotted in Fig.5. A simple least mean square error fit shows that the regression is somehow overestimating low UTH values and underestimating
5
high UTH values, a tendency that was already observed inBuehler and John(2004). As this tendency is not so marked for the synthetic dataset (see Fig.5), this behaviour should be related to differences between both datasets. The radiosondes seem to underestimate the UTH for very dry conditions, as shown inBuehler et al.(2004b), so this partially explains the slope of the linear fit. But there is no indication of the opposite
10
happening at very humid conditions, so the overestimation is more difficult to explain. Finally, a time series showing the individual retrieval errors for the validation data in the year 2001 in shown Fig. 6. The retrieved UTH values track reasonably well the radiosonde UTH values, in accordance with the estimated retrieval error.
5. Conclusions
15
A practical demonstration of the precision for retrievals of UTH from AMSU data when using a non-linear multi-channel regression method has been presented. The retrieval algorithm was based on neural networks trained with a global dataset of atmospheric states and simulated radiances. For a better exploitation of the data, inversions includ-ing both AMSU-A and AMSU-B radiances from selected channels were performed.
20
The traditional way of exploiting this data only considers a linear regression with an AMSU-B channel sensitive to tropospheric humidity. Here AMSU-A channels sensitive to temperature were also included as inputs to the neural network, to help interpret the humidity information. Also, the parameter to be retrieved was a layer averaged relative humidity, instead of the weighting function averaged humidity of the traditional
25
approach, in order to derive a more physical parameter from the ASMU data.
ACPD
4, 7487–7511, 2004AMSU retrieval precision for mean
UTH
C. Jim ´enez et al.
Title Page
Abstract Introduction
Conclusions References
Tables Figures
◭ ◮
◭ ◮
Back Close
Full Screen / Esc
Print Version
Interactive Discussion
©EGU 2004 The retrieval bias was very small. Compared with previous precision figures reported
from the traditional approach on the same dataset, the neural network algorithm out-performed the linear regression approach by 1% in precision, with the large advantage of deriving a measurement of UTH which registration (altitude range where the average or weighting is done) does not depend on the atmospheric conditions.
5
This precision estimate was validated by retrieving UTH from a dataset of real AMSU radiances over the mid-latitude radiosonde station of Lindenberg. The retrieved values were compared with UTH values derived from radiosondes co-located with the AMSU pixels. The agreement was good, with the precision deteriorating by less than 1%. This was expected, not only because of the co-location errors, but because the synthetic
10
training dataset will always be a limited representation of the real mapping between radiances and humidity.
The training dataset used was very suitable for regressions, due to the global cover-age and the consequent large atmospheric variability, but the corresponding simulated radiances were limited in the sense of not including liquid absorption from clouds,
scat-15
tering effects or surface emissivity variations. As the validation with Lindenberg data proved, these are not severe limitation for mid-latitude scenarios, but for more tropical conditions these factors cannot be neglected in the simulations. The 6% precision is expected to deteriorate due to the new sources of errors, but to what extent remains to be seen. Future work is aiming in this direction, building a more realistic training
20
dataset to allow the validation of the precision estimates in other scenarios where scat-tering effects, absorption from liquid clouds, or more changing surface conditions, could have a larger impact in the measurements.
Acknowledgements. Thanks to F. Chevallier for ECMWF data. Thanks to U. Leiterer and H. Dier from DWD station Lindenberg for their radiosonde data. Special thanks to L. Neclos
25
from the Comprehensive Large Array-data Stewardship System (CLASS) of the US National Oceanic and Atmospheric Administration (NOAA) for providing AMSU data.
Thanks to the ARTS radiative transfer community, many of whom have indirectly contributed by implementing features to the ARTS model.
This study was funded by the German Federal Ministry of Education and Research (BMBF),
ACPD
4, 7487–7511, 2004AMSU retrieval precision for mean
UTH
C. Jim ´enez et al.
Title Page
Abstract Introduction
Conclusions References
Tables Figures
◭ ◮
◭ ◮
Back Close
Full Screen / Esc
Print Version
Interactive Discussion
©EGU 2004 within the AFO2000 project UTH-MOS, grant 07ATC04. It is a contribution to COST Action 723
“Data Exploitation and Modelling for the Upper Troposphere and Lower Stratosphere”.
References
Anderson, G. P., Clough, S. A., Kneizys, F. X., Chetwynd, J. H., and Shettle, E. P.: AFGL atmospheric constituent profiles (0–120 km), Tech. Rep. TR-86-0110, AFGL, 1986. 7506
5
Bishop, M.: Neural networks for pattern recognition, chap. The multi-layer perceptron, Oxford University Press, Inc., New York, 116–163, 1995a. 7493
Bishop, M.: Neural networks for pattern recognition, chap. The multi-layer perceptron, Oxford University Press, Inc., New York, 395–396, 1995b. 7497
Buehler, S. A. and John, V. O.: A Simple Method to Relate Microwave Radiances to Upper
10
Tropospheric Humidity, J. Geophys. Res., submitted, preprint athttp://www.sat.uni-bremen. de/publications/, 2004. 7489,7490,7492,7493,7500,7501
Buehler, S. A., Eriksson, P., Kuhn, T., von Engeln, A., and Verdes, C.: ARTS, the Atmospheric Radiative Transfer Simulator, J. Quant. Spectrosc. Radiat. Transfer, 91, 65–93, 2004a. 7493 Buehler, S. A., Kuvatov, M., John, V. O., Leiterer, U., and Dier, H.: Comparison of Microwave
15
Satellite Humidity Data and Radiosonde Profiles: A Case Study, J. Geophys. Res., 109, D13103, doi:10.1029/2004JD004605, 1–12, 2004b. 7490,7492,7494,7500,7501
Cabrera-Mercader, C. R. and Staelin, D. H.: Passive microwave relative humidity retrievals using feedforward neural networks, IEEE T. Geosci. Remote, 33, 1324–1328, 1995. 7490 Chevalier, F.: Sampled databases of 60-level atmospheric profiles from the ECMWF analysis,
20
Tech. rep., ECMWF EUMETSAT SAF programme Research Report 4, 2001. 7492
Chevalier, F. and Mahfouf, J.: Evaluation of the Jacobians of infrared radiation models for vari-ational data assimilation, J. Appl. Meteor., 40, 1445–1461, 2001. 7492
Elliot, W. P. and Gaffen, D. J.: On the Utility of Radiosonde Humidity Archives for Climate Studies, Bull. Amer. Meteorol. Soc., 72, 1507–1520, 1991. 7489
25
Foresee, F. D. and Hagan, M. T.: Gauss-Newton approximation to Bayesian regularization, in: Proc. of the 1997 International Joint Conference on Neural Networks, 1930–1935, 1997. 7497
ACPD
4, 7487–7511, 2004AMSU retrieval precision for mean
UTH
C. Jim ´enez et al.
Title Page
Abstract Introduction
Conclusions References
Tables Figures
◭ ◮
◭ ◮
Back Close
Full Screen / Esc
Print Version
Interactive Discussion
©EGU 2004 183 GHz, J. Geophys. Res., 107, D13, 4170, doi:10.1029/2000JD000258, 1–8, 2002. 7489,
7490,7499
Held, I. M. and Soden, B. J.: Water vapor feedback and global warming, Annu. Rev. Energy. Environ, 25, 441–475, 2000. 7488
Jim ´enez, C. and Eriksson, P.: A neural network technique for inversion of atmospheric
obser-5
vations from microwave limb sounders, Radio Sci., 36, 941–953, 2001. 7493
Leiterer, U., Dier, H., and Naebert, T.: Improvements in Radiosonde Humidity Profiles Using RS80/RS90 Radiosondes of Vaisala, Beitr. Phys. Atmosph., 70, 319–336, 1997. 7492 Mo, T.: Prelaunch calibration of the advanced microwave sounding unit-A for NOAA-K, IEEE
Trans. Micr. Theory Techni., 44, 1460–1469, 1996. 7491
10
Nguyen, D. and Widrow, B.: Improving the learning speed of 2-layer neural networks by choos-ing initial values of the adaptative weights, in Proceedchoos-ings of the 1990 International Joint Conference on Neural Networks, 21–26, 1990. 7496
Rosenkranz, P. W.: Atmospheric remote sensing by Microwave radiometry, chap. Absorption of microwaves by atmospheric gases, Wiley, New York, 1993. 7489
15
Rosenkranz, P. W.: Retrieval of temperature and moisture profiles from AMSU-A and AMSU-B measurements, IEEE T. Geosci. Remote, 39, 2429–2435, 2001. 7489,7490
Saunders, R. W., Hewison, T. J., Stringer, S. J., and Atkinson, N. C.: The Radiometric Charac-terization of AMSU-B, IEEE Trans. Micr. Theory Techni., 43, 760–771, 1995. 7491
Soden, B. and Bretherton, F.: Interpretations of TOVS water vapor radiances in terms of
layer-20
average relative humidities: Method and climatology for the upper, middle and lower tropo-sphere, J. Geophys. Res., 101, 9333–9343, 1996. 7489,7491,7499
Soden, B. and Lanzante, J.: An assesment of satellite and radiosonde climatologies of upper-tropospheric water vapor, J. Climate, 9, 1235–1250, 1996. 7489
SPARC: Assesment of Upper Tropospheric and Stratospheric Water Vapour, chap.
Conclu-25
ACPD
4, 7487–7511, 2004AMSU retrieval precision for mean
UTH
C. Jim ´enez et al.
Title Page
Abstract Introduction
Conclusions References
Tables Figures
◭ ◮
◭ ◮
Back Close
Full Screen / Esc
Print Version
Interactive Discussion
©EGU 2004 Table 1. Statistics of the retrieval error for different combinations of MLP inputs. The MLPs
were trained with the ECMWF dataset and inverted independent cases from the same dataset. Reported are the bias and standard deviation of the retrieval error in % (relative humidity over water) and the correlation coefficient (r) between true and retrieved UTH values. The MLP inputs also include the instrument nadir angle. Reported also are the same statistics for a linear regression (lin-reg), and the MLP statistics for the retrieval of the Lindenberg validation dataset. See text for details.
AMSU channels bias std r ECMWF dataset
MLP
18 0.2 11.8 0.81
18–19 0.2 9.3 0.89
18–19–20 0.2 8.6 0.90
7–8–18–19 0.1 6.5 0.94
6–7–18–19 0.1 6.0 0.95
6–7–8–18–19–20 0.1 5.8 0.96 lin-reg
18 1.0 12.8 0.77
Lindenberg dataset
MLP
ACPD
4, 7487–7511, 2004AMSU retrieval precision for mean
UTH
C. Jim ´enez et al.
Title Page
Abstract Introduction
Conclusions References
Tables Figures
◭ ◮
◭ ◮
Back Close
Full Screen / Esc
Print Version
Interactive Discussion
©EGU 2004 Temperature
0.000 0.010 0.020 0.030
Jacobian [ K / K ]
0 5 10 15 20
Altitude [ km ]
1000 100
800 600 400 200 60
Water vapor
-0.8 -0.6 -0.4 -0.2 0.0 Jacobian [ K / 1 ]
0 5 10 15 20
1000 100
Pressure [ hPa ]
800 600 400 200 60
Channel 6
Channel 7
Channel 8
Channel 18
Channel 19
Channel 20
ACPD
4, 7487–7511, 2004AMSU retrieval precision for mean
UTH
C. Jim ´enez et al.
Title Page
Abstract Introduction
Conclusions References
Tables Figures
◭ ◮
◭ ◮
Back Close
Full Screen / Esc
Print Version
Interactive Discussion
©EGU 2004
200 220 240 260 280 300
Temperature [ K ] 0
5 10 15
Altitude [ km ]
0 20 Relative Humidity [ % ]40 60 80 100
800 600 400 200
Pressure [ hPa ]
Temperature Relative Humidity
ACPD
4, 7487–7511, 2004AMSU retrieval precision for mean
UTH
C. Jim ´enez et al.
Title Page
Abstract Introduction
Conclusions References
Tables Figures
◭ ◮
◭ ◮
Back Close
Full Screen / Esc
Print Version
Interactive Discussion
©EGU 2004
0 20 40 60 80
0 20 40 60 80
UTH
dataset (%RH)
UTH
ML
P
(%RH)
ACPD
4, 7487–7511, 2004AMSU retrieval precision for mean
UTH
C. Jim ´enez et al.
Title Page
Abstract Introduction
Conclusions References
Tables Figures
◭ ◮
◭ ◮
Back Close
Full Screen / Esc
Print Version
Interactive Discussion
©EGU 2004
−300 −20 −10 0 10 20 30
10 20 30 40 50 60 70 80
Retrieval error distribution
Number of hits
ACPD
4, 7487–7511, 2004AMSU retrieval precision for mean
UTH
C. Jim ´enez et al.
Title Page
Abstract Introduction
Conclusions References
Tables Figures
◭ ◮
◭ ◮
Back Close
Full Screen / Esc
Print Version
Interactive Discussion
©EGU 2004
0 20 40 60 80
0 20 40 60 80
UTH
sonde (%RH)
UTH
ML
P
(%RH)
ACPD
4, 7487–7511, 2004AMSU retrieval precision for mean
UTH
C. Jim ´enez et al.
Title Page
Abstract Introduction
Conclusions References
Tables Figures
◭ ◮
◭ ◮
Back Close
Full Screen / Esc
Print Version
Interactive Discussion
©EGU 2004
1 30 60 90 0
50 100
91 120 150 180 0
50 100
1810 210 240 270 50
100
UTH (%RH)
2710 300 330 360 50
100
Days in 2001