http://dx.doi.org/10.1590/1516-635x1704537-544
Classification of Chickens Infected by Clostridium
Perfringens Based on their Vocalization
Author(s)
Sadeghi MI
Banakar AII
Khazaee MIII
Soleimani MRIV
I M.Sc. student, Department of Biosystems
Engineering, Tarbiat Modares University, Email: [email protected]
II Assistant professor, Department of
Biosystems Engineering, Tarbiat Modares University, Email: ah_banakar@modares. ac.ir
III Ph.D. student, Department of Biosystems
Engineering, Tarbiat Modares University, Email: [email protected]
IV M.Sc. student, Department of Poultry
Science, Tarbiat Modares University, Email: [email protected]
Mail Address
Corresponding author e-mail address Ahmad Banakar
Faculty of Agriculture, Tarbiat Modares University, Jalal Al Ahmad, 14115-336, Tehran, Iran.
Phone: +98 21 48292302 Email: [email protected]
Keywords
Poultry health, bird sound classification, Clostridium perfringens type A, data mining, Artificial neural network.
Submitted: July/2014 Approved: March/2015
ABSTRACT
In this study, an intelligent method was implemented for the detection and classification of chickens by infected Clostridium perfringens type A based on their vocalization. To this aim, the birds were first divided into two groups that were placed in separate cages with 15 chickens each. Chickens were inoculated with Clostridium perfringens type A on day 14. In order to ensure the absence of secondary diseases and their probable effect on bird vocalization, vaccines for common diseases were administered. During 30 days of the experiment, chicken vocalization was recorded every morning at 8 a.m. using a microphone and a data collection card under equal and controlled conditions. Sound signals were investigated in time domains, and 23 features were selected. Using Fisher Discriminate Analysis (FDA), five of the most important and effective features were chosen. Neural Network Pattern Recognition (NNPR) structure with one hidden layer was applied to detect signals and classifying healthy and unhealthy chickens. Firstly, this neural network was trained with 34 samples, after which eight samples were tested for accuracy. Classification accuracy was 66.6 and 100% for days 16 and 22; i.e., two and eight days after the disease, respectively. The results of this study demonstrated the usefulness and effectiveness of intelligent methods for diagnosing diseases in chickens.
INTRODUCTION
Today, some diseases are of particular importance due to the heavy economic losses they cause in poultry production. Necrotic enteritis is one of these diseases, which was discovered by Parish in 1961. After the antibiotic ban imposed since January 2006, the prevalence of this disease increased, with the annual losses of over $ 2 billion. This disease is caused by Clostridium perfringens type A, which is a gram-positive, rod-shaped, spore-forming anaerobic bacterium. This disease causes atrophy of intestinal villi, decreased absorption of nutrients, and ultimately worse feed conversion ratio; this ratio is critical, because feed accounts for 60-70% of poultry production costs. This disease emerges when broilers are two to three weeks old and causes unspecific symptoms, such as reduced growth (Ficken, 1997), reluctance to move (Helmboldt, 1971), ruffled feathers (Van et al., 2004), anorexia (Bernan
Today, non-destructive tests have a critical role in people’s lives. These tests refer to the technology by which the health or its absence in target of a treatment is detected without any effects on its functional properties (Cherfaouni, 2012). These tests have been increasingly used all fields of animal production and agriculture. For example, detecting the ripening or quality of fruits is among the applications of non-destructive testing (Chen & Sun, 1991; Sun et al., 2010). When non-destructive tests are used in live organisms, it will be possible to obtain information from those organisms which otherwise could only be extracted by destructive tests under normal circumstances. Inflammation is a silent disease (lack of accurate and reliable symptoms for disease confirmation) and thus requires a system for the timely diagnosis and treatment of the disease.
Vocalization provides useful information on their health status, species, and body size (Kasten
et al., 2010). Acoustic plays an important role in communication in many animals. Virtually all birds and animals are able to vocalize. Diseases of the respiratory system can directly interfere with acoustic generation and resonance, which are involved in sound production (Gerhard et al., 2004). Bio-acoustics can help farmers to early detect respiratory disease by evaluating animal cough sounds through real time monitoring (Ferrari
et al., 2008). Animal vocalization can communicate different messages. For example, a call may be used to signal readiness to mate, to warn conspecifics of a predator, to keep in touch with other members of the group, or it may be an expression of pain or need. It has also been suggested that vocalization may be an expression or communication of an emotional state or reaction to an event, eliciting emotional states in others. Thus, analysis of vocalizations has been suggested as a non-invasive method for studying the emotional state of an animal (Emiear et al., 2014). The analysis of vocalization, may one of the most reliable and least invasive methods of assessing distress in cattle. Alternatively, it can be used as an indication of stress, because it is relatively insensitive to low and moderate degrees of distress and it is only observed in any significant degree when the animal perceives itself to be in serious difficulty (Jon & Joseph, 1999).
Diagnosis means identifying a disease existing in a group of animals, which are maintained together. Therefore, by applying several methods like treatment, destruction of diseased birds, and vaccination of healthy birds, damage to other birds can be prevented.
Automation is the most conventional human response to activities that are repeated several times (Gaston & O’Neill, 2004). In this regard, analyzing
animal vocalization has been recently considered by
researchers (Huang et al., 2009). Signal detection
means extracting sound from the noisy ambient during sound recording. According to the features of the extracted signal, sounds can be classified and related to the species (Skowronski & Harris, 2006).
Learning algorithms, such as linear discriminant analysis (Simmonds et al, 1996), decision tree (Parsons & Jones, 2000), artificial neural networks (ANN) (Boddy
et al., 1994; Chesmore et al., 2001), and support vector machines (SVM; Fagerlund, 2007), are the best choices for automatic detection of species, since they have very high accuracy compared with species classification by humans, which is both time-consuming and inaccurate (Acevedo et al., 2009).
Chedad et al. (2001) tried to classify pigs based on their coughing sound. In that study, it was necessary to discriminate coughing sounds from other noises such as grunting or metal sounds, and therefore the researchers designed an algorithm based on probabilistic neural network with the accuracy of 91.9% (Chedad et al., 2001).
Acevedo and Miguel (2009) automatically examined and classified three birds and nine frog species using SVM. In this study, animal sounds were classified according to minimum and maximum frequency, sound length, and maximum power. Then, three methods of linear discriminant analysis, support vector machine, and decision tree were used to classify the sound signals. Classification accuracy of the mentioned species in this study was obtained using linear discriminant analysis, decision trees, and support vector machine as 71, 89, and 95%, respectively. High accuracy of these three methods allowed sound-based identification of the species (Acevedo et al., 2009).
Huang et al. (2009) designed an automated system for frog sound identification. Based on the results of this study, there seem to be certain frog species that can be easily recognized by their vocalization. Sound samples were first divided into syllables. Then, three features of spectral centroid, signal bandwidth, and threshold velocity were extracted from the parameters of k-nearest-neighborhood (KNN) and SVM classifiers, which accuracy was 89.0 and 90.30%, respectively (Huang et al., 2009).
In the present study, an intelligent system was
designed to detect and classify healthy and C.
to an artificial neural network for diagnosis and classification.
METHODOLOGY
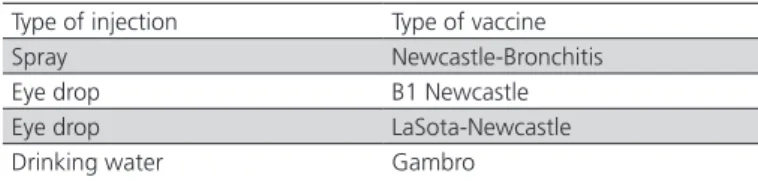
This study was performed in February and March, 2014 at the Faculty of Agriculture of Tarbiat Modares University. Thirty14-d-old Ross chickens were divided into two groups of 15 chickens each: the first group did not have any contact with the bacterium until the end of the study and were considered the healthy control samples. The second group was inoculated with the bacterium C. perfringens type A on day 14. Thus, 50% of the chickens were healthy, and 50% were unhealthy. The two groups were maintained in separate rooms. In order to prevent the emergence of other diseases, all birds were vaccinated against common diseases, using Newcastle-Bronchitis, infectious bursal disease, LaSota-Newcastle, and B1 Newcastle vaccines. Vaccination schedule is given in Table 1.
Table 1 – Vaccines and routes.
Type of injection Type of vaccine
Spray Newcastle-Bronchitis
Eye drop B1 Newcastle
Eye drop LaSota-Newcastle
Drinking water Gambro
Birds were daily removed from their cages at 10 a.m. on days 16, 17, 18, 19, 20, 21, 22 and placed individually in boxes, which consisted of 50 cm3 cubes.
Sound started to be recorded three mins after birds were placed in the boxes in order to allow birds to recover from handling stress. Sounds were captured using a microphone with the following specifications (Figure 1): 9.7×6.7 mm diameter, less than 2.2 KΩ impedance, 100˜ 16kHz frequency, and -58 dB ± 3 dB sensitivity. Sounds were recorded in a computer and in “wav” format, at a frequency rate of 44000 Hz. Sounds were subsequently analyzed using the MATLAB 2013a software.
Figure 1 – Scheme of sound recording.
DATA MINING
Feature extraction
Since it is not possible to visually extract information from raw signals, for precise investigation it was necessary to extract the features from these signals that could be used as input for the neural network. Feature functions were numerical and had specific values; also, each one stated a characteristic or mode of a signal. Twenty-three features were extracted from the raw data in the present study (Table 2). These indices were the feature functions that have been used by other researchers in the field of data mining and can be used to obtain the information required for data mining (Khazaee et al., 2013; Lei et al., 2008). In this table, x(n) is signal time-series and N is the number of data points.
Feature selection: Fisher discriminating analysis (FDA)
Selecting good features leads to time savings, reduced size of classifier’s input data, less calculation, and enhanced accuracy of trouble-shooting. If there are few feature functions, characteristics of a particular signal cannot be adequately determined, and the classifier cannot distinguish between two different signals. Selecting a large number of feature functions also makes the classifier fail to make a distinction between two groups of extracted features. Thus, at the stage of dimensionality reduction using FDA, five of the most essential extracted features in the previous step were chosen. To use this method, data were first classified. In this process, features that differentiate two classes are selected so that there is a minimum difference between the members of one class and a maximum difference between the members of two classes (Chiang et al., 2000; Diaf et al., 2013; Sugiyama
et al., 2010).
In this study, five features with minimum difference within classes and maximum differences between classes were selected. FDA identified some features daily, out of which five were similar on all days. These five features included maximum signal value, standard deviation, root mean square, third central moment divided by the cube of the standard deviation, and crest factor.
Classification: Artificial Neural Network
infected by Clostridium perfringens, some of which included neural networks (Boddy et al., 1994), decision tree (Parsons & Jones, 2000), linear discriminant
analysis (Xanthopoulos et al., 2013), and support vector machine (Neri, 2014). In this study, neural network pattern recognition (NNPR) was applied to detect signals
Table 2 – Primary features extracted.
Name Formula Name Formula
Mean T1=
∑
= x n N ( ) n N1 Geometric mean T13 =
∏
=
x n( )
n N N
1
Maximum signal value T2 = max x n| ( ) | Correlation coefficient T14 =T
T
3 2×100
Standard deviation (stdv)
T3 =
∑
−−
=
x n T
N ( ( ) ) 1 n N 1 2 1
The average deviation from the
mean T15 =
∑
−
=
x n T
N ( ( ) ) n N 1 1
Quadratic mean square
T4 =
∑
= x n N ( ) n N 1 2 Skewness T16 =∑
− =x n T
T ( ( ) ) n N 1 3 1 3 3
Root mean square
T5=
∑
= x n N ( ( )) n N 21 kurtosis T17=
x n T
N std
( ( ) )
( 1)( )
n N 1 1 4 4
∑
− − =Third central moment divided by
the stdv T6 =
T
T
18
33 The third central moment T18 =
∑
−=
N
x T
1
( i )
i N
2 3
1
Crest factor T7 =
T
T
2
5
The fourth central moment T19 =
∑
−=
N
x n T
1
( ( ) )4
n N
2 1
Maximum signal value divided by
the mean T8 =
∑
= T x n N ( ) n N 2 1 2The fifth central moment T20 =
N x T
1
( i )
i N 2 5 1
∑
− =Root mean square divided by the
mean T9 =
T
T
5
1 The sixth central moment T21 = N
∑
= −x n T
1 ( ( ) ) n N 2 6 1 Impulse factor T10=
∑
= T N x n 1 ( ) n N 2 1The fourth central moment divided by the square of the variance T22 =
T T 19 112 variance T11=
∑
− − =x n T
N ( ( ) ) 1 n N 1 2
1 The sum of squares T23 = ( ( ))x n
and classify healthy and unhealthy chickens. For this purpose, data were divided into three groups: the first category included 70% of data for network training, the second category included 15% for the validation of the network structure, and the third category included 15% for testing the neural network in terms of new data detection and classification. The feed-forward neural network structure was defined with three layers (input, hidden, and output) and tan-sigmoid activation function. In the input layer, one neuron was selected per feature. Since five features were chosen in data mining step, the input layer of neural network had five input neurons. The output layer had two classes and therefore consisted of two neurons. The number of neurons in the hidden layer strongly influences the performance of neural networks. Table 3 shows the performance of the neural network on days 16 to 22. On day 22, when the neural network presented maximum accuracy, four neurons were obtained in the hidden layer. The number of neurons in the hidden layer to obtain maximum accuracy was determined by trial-and-error. Table 4 presents the performance results of the neural network on day 22 when different numbers of neurons were used. In addition, the optimal number of neurons was similarly obtained on the other days. The number of neurons in the input and output layers was constant and results shown in Table 4 were obtained by changing the number of neurons in the hidden layer. Since the existence of four neurons in the hidden layer maximized the accuracy of neural network, the structure of the neural network on day 22 was determined as 5 × 4 × 2.
Table 3 – Performance of the neural network.
Evaluation Day Number of Hidden Neurons
Classification Accuracy Testing Data Training Data
16 7 66% 71.60%
17 9 77.34% 82%
18 7 80.42% 88.33%
19 8 80% 90%
20 5 90% 92.50%
21 4 95% 96%
22 4 100% 100%
Table 4 – Performance of neural network for day 22 with different numbers of neurons in the hidden layer.
Number of Hidden Neurons
Classification Accuracy
Testing Data Training Data
2 91.20% 99%
3 97.1% 99%
4 100% 100%
RESULTS AND DISCUSSION
Obtained signals
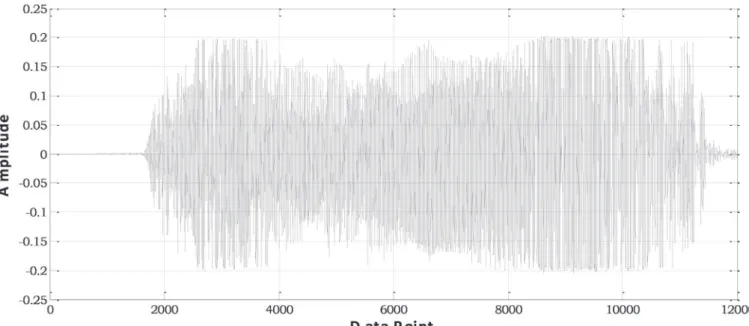
In this section, two examples of sound signals from healthy and unhealthy chickens are shown. As given in Figure 2 and 3, the vocalization of healthy chickens presented higher intensity and uniformity in the shape of vocalization than the unhealthy ones. This was also reported in the literature (Engel et al., 2000; Mckay et al., 2005).
These figures demonstrate that the vocalization of infected chickens presented lower sound intensity than healthy ones, but presented higher frequency within the main low frequency range. The mentioned differences in the feature extraction section were also confirmed.
Data mining results
Figure 5 shows the importance of selecting a good feature using FDA. Part a shows the signal value for a not-so-good feature. As can be seen in part a, there
was not much difference between the two classes. However, in part b, which shows a good feature, the distinction between two classes is evident.
Figure 3 – Infected chickens sound signals.
Figure 5 – The effect of FDA method on signal feature selection – a: worst features, b: best features.
a
Table 5 shows the mean values of some selected features of two healthy and unhealthy birds. Among the features mentioned in this table, maximum signal value and root mean square were the functions that detected the intensity and quantity of a signal. The obtained values demonstrated that maximum values and root mean squares of vocalization were higher in healthy than unhealthy chickens. These values indicate that vocalization intensity of healthy birds was higher than that of unhealthy ones. SD and crest factor showed signal uniformity. In fact, the higher the standard deviation and crest factor of a signal, the less uniform and wavier is the signal (Mckay et al., 2005). These values determined that vocalization of the infected birds was less uniform and more dispersed than that of the healthy ones. Therefore, the results obtained in the feature extraction step confirmed the results obtained during the signal step. Indeed, these values clearly showed that the sound intensity of the infected birds was higher and less uniform than that of the healthy ones (Nowak et al., 1997).
Table 5 – Mean values of the selected features.
Row Feature Healthy sample Infected sample
1 Maximum signal value + 111%
---2 Root mean square + 107%
---3 Standard deviation --- + 99%
4 Crest factor --- + 98%
Classification accuracy of the detection of infected chickens
This study included 50 vocalization samples, out of which 34 were used to train the classifier (70% of data), eight to validate the classifier structure (15% of data), and finally eight ones for testing the classifier (15% of data). Maximum accuracy of the neural network was obtained for day 22. Thirty four samples were used to train the neural network. Out of these 34 samples, 15 were related to healthy birds sand 19 to infected ones. The confusion matrix of the neural network for data training shows that the neural network was able to differentiate vocalization samples of healthy chickens from those of unhealthy ones with 100% accuracy. Out of the eight samples used in the test, the neural network was able to detect five healthy and three unhealthy samples with 100% accuracy.
According to Table 4, the accuracy of the neural network was 66%, 77%, 80%, 80%, 90%, and 95% on days 16 to 21, respectively. Based on the detection of neural network, the disease appeared on days 17, 18, and 19, and reached its peak on days 20, 21, and 22. Thus, the neural network was able to detect and
classify unhealthy and healthy chickens on day 22 with 100% accuracy.
CONCLUSION
This study analyzed the vocalization of healthy and unhealthy broilers, and proposes an intelligent system for the diagnosis and classification of birds. Twenty-three features were extracted from the 50 vocalization samples and five were selected using the FDA method for data mining and dimensionality reduction step. These features were used as neural network inputs to determine its performance. Accuracy of the neural network during the training and testing phases was 100%. The results of this study demonstrate the usefulness and effectiveness of intelligent methods to diagnose poultry diseases, and therefore, allows for the early treatment of sick birds before the disease is further disseminated. For further application of this method, other common diseases should be evaluated.
REFERENCES
Acevedo MA, Corrada-Bravo CJ, Corrada-Bravo H, Villanueva-Rivera LJ, Aide TM. Automated classification of bird and amphibian calls using machine learning: A comparison of methods. Ecological Informatics 2009;4(4):206-214.
Boddy L, Morris CW, Wilkins MF, Tarran GA, Burkill PH. Neural network analysis of flow citometric data for 40 marine phytoplankton species. Cytometry 1994;15:283-293.
Brennan J, Barnum DA, Wilson J. The efficacy of bacitracin methylene disalicylate when fed in combination with narasin in the management of necrotic enteritisin broiler chickens. Poultry Science 2003;82:360-363.
Chedad A, Moshou D, Aerts JM, Van Hirtum A, Ramon H, Berckmans D. Production technology: recognition system for pig cough based on probabilistic neural networks. Journal of Agricultural Engineering Research 2001;79(4):449-457.
Chen P, Sun Z. A review of non-destructive methods for quality evaluation and sorting of agricultural products. Journal of Agricultural Engineering Research 1991;49:85-98.
Cherfaoui M. Innovative techniques in non-destructive testing and industrial applications on pressure equipment. Procedia Engineering 2012;46:266-278.
Chesmore ED, Femminella OP, Swarbrick MD. Automated analysis of insect sounds using time-encoded signals and expert systems-a new method for species identification. Information Technology, Plant Pathology and Biodiversity 2001;273-287.
Chiang LH, Russell EL, Braatz RD. Fault diagnosis in chemical processes using Fisher discriminant analysis, discriminant partial least squares, and principal component analysis. Chemometrics and Intelligent Laboratory Systems 2000;50(2):243-252.
Engel SJ, Gilmartin BJ, Bongort K, Hess A. Prognostics, the real issues involved with predicting life remaining. Proceedings of the IEEE Aerospace Conference 2000; Bethpage, New York: Northrop Grumman Corp ; 2000. p.457-469.
Fagerlund S. Bird species recognition using support vector machines. EURASIP Journal on Advances in Signal Processing 2007;(1):64.
Ficken MD, Wages DP. Necrotic enteritis. In: Calnek BW, editor. Diseases of poultry. 10th ed. Iowa: Iowa State University Press 1997; p.261-264.
Gaston KJ, O’Neill MA. Automated species identification-why not? Philosophical Transactions of the Royal Society of London Series B: Biological Sciences 2004;359:655-667.
Helmboldt CF. The pathology of necrotic enteritis in domestic fowl. Avian Diseases 1971;15:775-780.
Huang CJ, Yang YJ, Yang DX, Chen YJ. Frog classification using machine learning techniques. Expert Systems with Applications 2009;36(2):3737-3743.
Jahan M, Asaduzzaman M, Sarkar A. Performance of broiler fed on mash, pellet and crumble. International Journal of Poultry Science 2006;5(3):265-270.
Kasten EP, McKinley PK, Gage SH. Ensemble extraction for classification and detection of bird species. Ecological Informatics 2010;5(3):153-166.
Khazaee M, Ahmadi H, Omid M, Banakar A, Moosavian A. Feature-level fusion based on wavelet transform and artificial neural network for fault diagnosis of planetary gearbox using acoustic and vibration signals. Insight-Non-Destructive Testing and Condition Monitoring 2013;55(6):323-330.
Lei Y, He Z, Zi Y. A new approach to intelligent fault diagnosis of rotating machinery. Expert Systems with Applications 2008;35(4):1593-1600.
McEnnis D, McKay C, Fujinaga I, Depalle P. JAudio: A feature extraction library. Proceedings of the 6th International Conference on Music Information Retrieval; 2005 Sept 11-15; London, UK. p. 600-603.
Nowak MA, Wagoner RV, Begelman MC, Lehr DE. The 67 Hz feature in the black hole candidate GRS 1915+ 105 as a possible. The Astrophysical Journal Letters 1997;477(2):L91-L94.
Parsons S, Jones G. Acoustic identification of twelve species of echolocating bat by discriminant function analysis and artificial neural networks. Journal of Experimental Biology 2000;203(17):2641-2656.
Simmonds JE, Armstrong F, Copland PJ. Species identification using wideband backscatter with neural network and discriminant analysis. ICES Journal of Marine Science: Journal du Conseil 1996;53(2):189-195.
Skowronski MD, Harris JG. Acoustic detection and classification of microchiroptera using machine learning: Lessons learned from automatic speech recognition. The Journal of the Acoustical Society of America 2006;119(3):1817-1833.
Sugiyama M, Idé T, Nakajima S, Sese J. Semi-supervised local fisher discriminant analysis for dimensionality reduction. Machine Learning 2010;78:35-61.
Sun T, Huang K, Xu H, Ying Y. Research advances in nondestructive determination of internal quality in watermelon/melon: A review. Journal of Food Engineering 2010;100(4):569-577.
Van I, Pasmans F, Huyghebaert G, Haesebrouck F, Ducatelle R. Clostridium perfringens in poultry: an emerging threat for animal and public health. Avian Pathology 2004; 33:537-549.