NHESSD
3, 2975–3022, 2015Evaluation of shallow landslide triggering scenarios through a physically-based
approach
L. Schilirò et al.
Title Page
Abstract Introduction
Conclusions References
Tables Figures
◭ ◮
◭ ◮
Back Close
Full Screen / Esc
Printer-friendly Version
Interactive Discussion
Discussion
P
a
per
|
Discussion
P
a
per
|
Discussion
P
a
per
|
Discussion
P
a
per
|
Nat. Hazards Earth Syst. Sci. Discuss., 3, 2975–3022, 2015 www.nat-hazards-earth-syst-sci-discuss.net/3/2975/2015/ doi:10.5194/nhessd-3-2975-2015
© Author(s) 2015. CC Attribution 3.0 License.
This discussion paper is/has been under review for the journal Natural Hazards and Earth System Sciences (NHESS). Please refer to the corresponding final paper in NHESS if available.
Evaluation of shallow landslide triggering
scenarios through a physically-based
approach: an example of application in
the southern Messina area (north-eastern
Sicily, Italy)
L. Schilirò, C. Esposito, and G. Scarascia Mugnozza
Department of Earth Sciences, “Sapienza” University of Rome, Rome, Italy
Received: 24 March 2015 – Accepted: 22 April 2015 – Published: 4 May 2015 Correspondence to: L. Schilirò ([email protected])
NHESSD
3, 2975–3022, 2015Evaluation of shallow landslide triggering scenarios through a physically-based
approach
L. Schilirò et al.
Title Page
Abstract Introduction
Conclusions References
Tables Figures
◭ ◮
◭ ◮
Back Close
Full Screen / Esc
Printer-friendly Version
Interactive Discussion
Discussion
P
a
per
|
Discussion
P
a
per
|
Discussion
P
a
per
|
Discussion
P
a
per
|
Abstract
Rainfall-induced shallow landslides are a widespread phenomenon that frequently causes substantial damage to property, as well as numerous casualties. In recent years a wide range of physically-based models has been developed to analyze the triggering process of these events. Specifically, in this paper we propose an approach for the
5
evaluation of different shallow landslide triggering scenarios by means of TRIGRS nu-merical model. For the calibration of the model, a back-analysis of the landslide event occurred in the study area (located SW of Messina, north-eastern Sicily, Italy) on 1 Oc-tober 2009 was performed, by using different methods and techniques for the definition of the input parameters. After evaluating the reliability of the model through the
com-10
parison with the 2009 landslide inventory, different triggering scenarios were defined using rainfall values derived from the rainfall probability curves, reconstructed on the basis of daily and hourly historical rainfall data. The results emphasize how these phe-nomena are likely to occur in the area, given that even short-duration (3–6 h) rainfall events having a relatively low return period (e.g. 10 years) can trigger numerous slope
15
failures. On the contrary, for the same rainfall amount, the daily simulations overesti-mate the instability conditions. The tendency of shallow landslides to trigger in this area agrees with the high number of landslide/flood events occurred in the past and sum-marized in this paper by means of archival researches. Considering the main features of the proposed approach, the authors suggest that this methodology could be applied
20
to different areas, even for the development of landslide early warning systems.
1 Introduction
Landslides triggered by rainstorms occur in many part of the world and cause signifi-cant damage and loss to affected people, organizations and institutions as well as to the environment (Glade, 1997; Nadim et al., 2006; Petley, 2012). Within this category
25
of natural disasters, shallow landslides (in particular debris-flows) pose a serious threat
NHESSD
3, 2975–3022, 2015Evaluation of shallow landslide triggering scenarios through a physically-based
approach
L. Schilirò et al.
Title Page
Abstract Introduction
Conclusions References
Tables Figures
◭ ◮
◭ ◮
Back Close
Full Screen / Esc
Printer-friendly Version
Interactive Discussion
Discussion
P
a
per
|
Discussion
P
a
per
|
Discussion
P
a
per
|
Discussion
P
a
per
|
to life or property, in particular due to their high velocity, impact forces and long runout, combined with poor temporal predictability (Jacob and Hungr, 2005). These phenom-ena consist in sudden mass movements of a mixture of water and granular material that rapidly develop downslope eroding the soil cover and increasing their original volume (Iovine et al., 2003). Due to their high destructiveness, the study of these processes
5
is an important research topic that can support decision makers in developing more detailed land-use maps and landslide hazard mitigation plans.
However, it is not simple to predict the probability of occurrence and magnitude of shallow landslides, considering the complexity of the phenomenon, mostly related to the variability of controlling factors (e.g. geology, topography, climate and hydraulic
con-10
ditions, etc.). In this respect, a relation between triggering events (i.e. rainfall) and land-slide occurrences is needed. To evaluate this cause–effect relationship, an approach widely used in the literature relies on the definition of empirical thresholds (Caine, 1980; Reichenbach et al., 1998; Wieczorek and Glade, 2005; Guzzetti et al., 2007). An em-pirical threshold defines the rainfall, soil moisture or hydrological conditions that, when
15
reached or exceeded, are likely to trigger landslides (Reichenbach et al., 1998). Rain-fall intensity-duration thresholds for the possible occurrence of landslides are defined through the statistical analysis of past rainfall events that have resulted in slope fail-ures, and can be classified on the basis of the geographical extent for which they are determined (i.e. global, national, regional or local thresholds) and the type of rainfall
20
information used to establish the threshold (Brunetti et al., 2010).
Nonetheless, the reliability of empirical thresholds is generally affected by the his-torical data quality and availability. In fact, adequate hishis-torical data on landslides and simultaneous rainfall are in most cases available only for a relatively short period, which may not be sufficiently significant from a statistical point of view. Furthermore, rainfall
25
NHESSD
3, 2975–3022, 2015Evaluation of shallow landslide triggering scenarios through a physically-based
approach
L. Schilirò et al.
Title Page
Abstract Introduction
Conclusions References
Tables Figures
◭ ◮
◭ ◮
Back Close
Full Screen / Esc
Printer-friendly Version
Interactive Discussion
Discussion
P
a
per
|
Discussion
P
a
per
|
Discussion
P
a
per
|
Discussion
P
a
per
|
during a rainfall event can vary spatially to such an extent that, from a theoretical point of view, the rainfall threshold can be different for each landslide (Lo et al., 2012). Finally, further criticisms are based on the observation that it is not the amount of precipitation but the (largely unknown) amount of water that infiltrates and moves into the ground to cause failure (Guzzetti et al., 2008).
5
For this reason, in recent years different models have been developed to define phys-ical (process-based) thresholds. Specifphys-ically, these models can determine the amount of precipitation needed to trigger slope failures, as well as the location and time of expected landslides, using spatially variable characteristics (e.g. slope gradient, soil depth and shear resistance) with a simplified dynamic hydrological model that predicts
10
the pore pressure response to rainfall infiltration (Montgomery and Dietrich, 1994; Wil-son and Wieczorek, 1995; Terlien, 1998; Frattini et al., 2009). These models, although they are challenging to apply over large areas where a detailed knowledge of input parameters is very difficult to acquire (Berti et al., 2012), are usually calibrated us-ing rainfall events for which rainfall measurements and the location and time of slope
15
failures are known.
In this paper we propose an approach based on TRIGRS (Baum et al., 2002), a physically-based model that predicts the timing and distribution of shallow, rainfall-induced landslides combining an infinite slope stability calculation with a transient, one-dimensional analytic solution for pore-pressure response to rainfall infiltration. This
20
model has been used in order to define different shallow landslide triggering scenar-ios in the study area (located SW of Messina in north-eastern Sicily, Italy) by varying the rainfall input on the basis of the results deriving from the analysis of the historical rainfall data. Prior to this stage, the model has been thoroughly calibrated through the back-analysis of the disaster occurred in the same area on 1 October 2009. On that
25
day, a heavy rainstorm triggered several hundreds of shallow landslides, causing 37 fatalities and severe damage to buildings and infrastructure. Given the nature of the event, it can be considered particularly representative of the studied phenomenon and, thus, suitable for testing the reliability of the physically-based model.
NHESSD
3, 2975–3022, 2015Evaluation of shallow landslide triggering scenarios through a physically-based
approach
L. Schilirò et al.
Title Page
Abstract Introduction
Conclusions References
Tables Figures
◭ ◮
◭ ◮
Back Close
Full Screen / Esc
Printer-friendly Version
Interactive Discussion
Discussion
P
a
per
|
Discussion
P
a
per
|
Discussion
P
a
per
|
Discussion
P
a
per
|
The paper is organized as follows: after a brief description of the study area and the 1 October 2009 event (Sect. 2), a summary of the landslide/flood events occurred in the past is reported (Sect. 3). Then, the methods used for the analysis of the historical rainfall data and the parameterization of TRIGRS model are outlined (Sect. 4). After-wards, the results of the back-analysis of 2009 event and the evaluation of possible
5
future triggering scenarios are provided (Sect. 5) and discussed, along with the main features of the proposed approach (Sect. 6). Finally, in Sect. 7 the main conclusions are summarized.
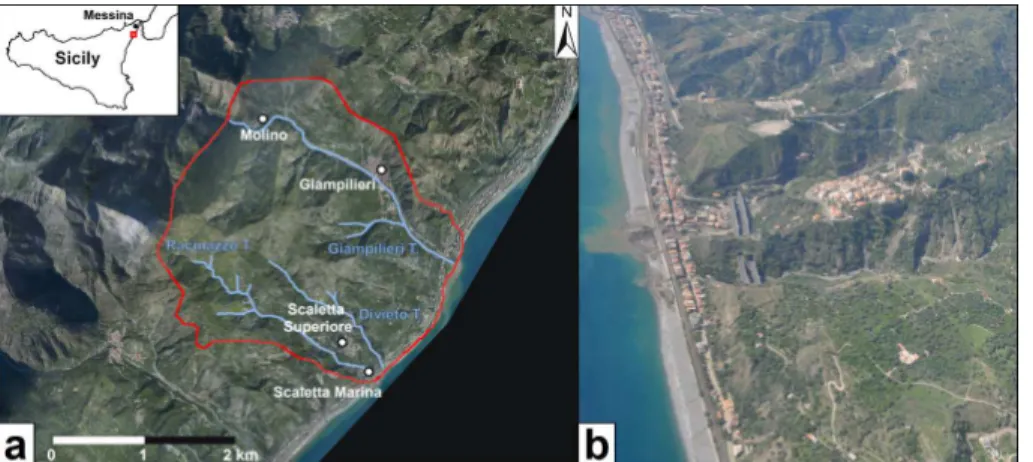
2 General features of the study area and the 1 October 2009 event
The study area (Fig. 1) is located south of Messina (north-eastern Sicily, Italy), at the
10
NE termination of the Peloritani Mountain Belt, that represents the southern border of the Calabrian–Peloritan arc. This chain is composed by different metamorphic units (Kabilo–Calabride Complex) of pre-alpine age and later involved in Hercynian and Alpine orogenic processes, and tectonically overlapping the sedimentary Maghrebidian units (Lentini et al., 2000). Since the Late Miocene, the opening of the Tyrrhenian Basin
15
led to the formation of an extensional fault system that involved and re-oriented some of the former structures. These faults, generally oriented NE–SW, have influenced the development of this region during the Pleistocene–Holocene (Antonioli et al., 2003; Di Stefano et al., 2012), resulting in a landscape characterised by steep slopes eroded by torrent-like straight watercourses, with alluvial conoids and debris-flow fans along
20
the valleys. A thin (0.5–2 m) layer of colluvial deposits or coarse-grained regolith over-lays the majority of the slopes, where small outcrops of marine terraces, documenting the different uplift-rates during the Late Pleistocene, can be found. Three orders of ter-races can be distinguished at approximately 185, 135 and 95 m a.s.l. (Catalano and De Guidi, 2003), whereas there is no evidence of fluvial terraces. Catchments generally
25
exten-NHESSD
3, 2975–3022, 2015Evaluation of shallow landslide triggering scenarios through a physically-based
approach
L. Schilirò et al.
Title Page
Abstract Introduction
Conclusions References
Tables Figures
◭ ◮
◭ ◮
Back Close
Full Screen / Esc
Printer-friendly Version
Interactive Discussion
Discussion
P
a
per
|
Discussion
P
a
per
|
Discussion
P
a
per
|
Discussion
P
a
per
|
sion of about 8 km2and a maximum height of about 700 m a.s.l., comprises three main catchments (Giampilieri, Divieto and Racinazzo torrents), highly affected by the heavy rainstorm which occurred on 1 October 2009. This event was characterised by an ex-tremely high rainfall amount in a few hours. For instance the Santo Stefano di Briga monitoring station, which is one of the rain gauges closest to the study area (Fig. 2a),
5
recorded very high rainfall peaks (e.g. 18.5 mm of cumulated rain between 17:00 and 17:10 UTC) for a total of 225 mm of rain falling in just seven hours (i.e. between 14:00 and 21:00 UTC). The analysis of satellite data (Fig. 2b) highlights the marked localisa-tion of the weather system, also confirmed by the low rainfall values recorded in two rain gauge stations approximately 20 km from the study area (Antillo and Messina
Isti-10
tuto Geofisico monitoring stations, see Fig. 2a). Furthermore, it is worth noting that in the days preceding the event, the area was affected by two intense rainfall events: one on 16 September and one on the night between 23 and 24 September. The cumulative rain in this period was approximately 300 mm and thus the total rainfall from 15 Septem-ber to 1 OctoSeptem-ber amounted to about 500 mm, which is 80 mm higher than the average
15
October–December precipitation (421 mm), calculated from 79 years of historical plu-viometric data recorded in Santo Stefano di Briga monitoring station. These data are directly available on the Sicily Region website (http://www.osservatorioacque.it).
As a consequence of such an extreme event, numerous shallow landslides were trig-gered, mainly debris-flows (Fig. 3a), but also debris-slides (Fig. 3b), frequently evolved
20
to debris-avalanches (Fig. 3c) (Hungr et al., 2001). On the basis of witness reports, it results that between 15:00 and 17:00 UTC the critical conditions rapidly developed due to a large increase in precipitation. Afterwards, first landslide events occurred: for in-stance, a witness asserts that the debris-flow in Via Puntale in Giampilieri village would have occurred between 17:10–17:15 UTC. Finally, after a further rainfall peak
(approxi-25
mately at 18:00 UTC), many other shallow landslides were triggered in Giampilieri and the surrounding areas. In particular, a devastating debris-flow suddenly rushed down the Racinazzo valley, crushing buildings, infrastructure and killing 14 people in Scaletta Marina village. On the other hand, similar events were recorded slightly later in Molino
NHESSD
3, 2975–3022, 2015Evaluation of shallow landslide triggering scenarios through a physically-based
approach
L. Schilirò et al.
Title Page
Abstract Introduction
Conclusions References
Tables Figures
◭ ◮
◭ ◮
Back Close
Full Screen / Esc
Printer-friendly Version
Interactive Discussion
Discussion
P
a
per
|
Discussion
P
a
per
|
Discussion
P
a
per
|
Discussion
P
a
per
|
village, approximately between 18:30–18:45 UTC, due to the storm motion towards the inner areas. However, the experiences reported by witnesses along with the damage to buildings, both indicate very fast-moving debris-flows.
3 Previous flooding and related events
The regional climatic setting of north-eastern Sicily is typical Mediterranean, whereby
5
rainfall is concentrated during the wet season (October–April), which is when extreme rainfall events generally occur. However, the local orographic control coupled with ma-rine effect can highly influence the occurrence and magnitude of such events. Further-more, the particular drainage network of the area, characterised by low order streams with high gradient and short length, increases the energy of runoffwaters during
rain-10
fall events, favouring the erosion processes and the transport of the loosened material, even of large dimensions. For these reasons, this part of Sicily has been affected in the past by recurring flood/landslide events. According to the results of an archival research, based on the review of technical reports from local Authorities, newspapers, local churches archives etc., about 46 landslide/flood events would have occurred since
15
the 17th century, the most of whom during the autumn-winter period (Fig. 4). In this re-spect, it is worth mentioning the “quadruple rainstorm” that affected the whole Messina area on 13 November 1855, during which more than 100 people lost their lives due to the triggering of countless landslides and a widespread flooding (Cuppari, 1856). Extreme rainfall events affected this region also in recent years: in particular, an event
20
similar to the 1 October 2009 one occurred just two years before, on 25 October 2007. On this day, approximately 134 mm of rain fell in the area, and this event also featured extremely high intensity peaks (i.e. 29.1 mm in 10 min). The damage to buildings and infrastructure was remarkable; however, unlike the 1 October event, there were no ca-sualties. Heavy rainstorms hit the area also after the 1 October 2009 event, i.e. in the
25
NHESSD
3, 2975–3022, 2015Evaluation of shallow landslide triggering scenarios through a physically-based
approach
L. Schilirò et al.
Title Page
Abstract Introduction
Conclusions References
Tables Figures
◭ ◮
◭ ◮
Back Close
Full Screen / Esc
Printer-friendly Version
Interactive Discussion
Discussion
P
a
per
|
Discussion
P
a
per
|
Discussion
P
a
per
|
Discussion
P
a
per
|
to declare the state of natural disaster for the villages of southern Messina area. How-ever, even though the largest number of events recorded during the last twenty years also depends on the increasing number of sources of information, it is important to em-phasize that, in the same period, the landslide risk exposure of the area has increased, substantially due to the enlargement of the urban area as a consequence of poor
land-5
use planning (Del Ventisette et al., 2012). Finally, recent studies (Bonaccorso et al., 2005; Arnone et al., 2013) indicate an increasing trend for extreme, short-duration rainfall events over the last few decades in Sicily, especially in coastal areas.
4 Methodology
4.1 Analysis of historical rainfall data
10
In order to depict different shallow landslide triggering scenarios in the study area, firstly it is necessary to evaluate the recurrence of specific rainfall events, which can be used as input for the physically-based model. Therefore, a statistical analysis of historical rainfall data has been performed. The hydrological-statistical model is based on the analysis of the maximum values assumed by the chosen hydrological variable (i.e.
15
cumulative rainfall at different time intervals). Once the significant hydrological variables are identified, the recurrence of the rainfall event can be expressed in terms of return period. In this study the probability model relied on the Generalized Extreme Value (GEV) distribution introduced by Jenkinson (1955). This distribution is a generalized version of the more known Gumbel distribution, which is largely used in the study of
20
extreme events. The variables of “rainfall cumulated” (P Cn) i.e., in 1, 2, 5, 10, 30, 60, 90, 120 and 180 days are computed from daily rainfall data by means of the expression:
P Cn,j = j X
i=j−n+1
Pi withn=1, 2, 5, 10, 30, 60, 90, 120, 180 (1)
NHESSD
3, 2975–3022, 2015Evaluation of shallow landslide triggering scenarios through a physically-based
approach
L. Schilirò et al.
Title Page
Abstract Introduction
Conclusions References
Tables Figures
◭ ◮
◭ ◮
Back Close
Full Screen / Esc
Printer-friendly Version
Interactive Discussion
Discussion
P
a
per
|
Discussion
P
a
per
|
Discussion
P
a
per
|
Discussion
P
a
per
|
wherej is the progressive number of days that form the analyzed time interval and
Pi is the rainfall value recorded theith day. The maximum values of each variable are extracted, year by year, from the datasets so generated and the parameters of the GEV function are determined from the above values, by applying the Probability Weighted Moments (PWM) method introduced by Greenwood et al. (1979) and subsequently
5
modified by Hosking et al. (1985). Finally, the inversion of the probability function yields the values of cumulated rainfallx for each of the variables (1, 2, 5, 10. . .180 days) and for different return periods. Then, these values are interpolated with a view to build the rainfall probability curves.
To yield reliable results, this type of analysis requires sufficiently long and continuous
10
time series of rainfall data (at least 20 years of recorded data according to Houghton et al., 2001 and Serrano, 2010). For this reason, use was made of daily rainfall data from Santo Stefano di Briga and Messina Istituto Geofisico rainfall stations, that are operational since 1925 and 1952, respectively. However, if we consider that the extreme rainfall events which periodically affect the study area are usually of short duration, as
15
in the case of the 1 October 2009 event, it would be extremely interesting to analyze the historical data of maximum hourly rainfall intensity. Unfortunately, these data are not available for the above mentioned stations. For this reason, use was made of hourly rainfall data (i.e. cumulated in 1, 3, 6, 12 and 24 h) from Alì Terme station, that is located approximately 4 km SE of Fiumedinisi station (see Fig. 8b); thus, this station has been
20
considered sufficiently close to be used to assess the recurrence of the rainfall events recorded in Fiumedinisi station.
4.2 Theoretical basis of TRIGRS model
TRIGRS (Transient Rainfall Infiltration and Grid-based Slope Stability model) is a For-tran program designed for modelling the timing and distribution of shallow,
rainfall-25
NHESSD
3, 2975–3022, 2015Evaluation of shallow landslide triggering scenarios through a physically-based
approach
L. Schilirò et al.
Title Page
Abstract Introduction
Conclusions References
Tables Figures
◭ ◮
◭ ◮
Back Close
Full Screen / Esc
Printer-friendly Version
Interactive Discussion
Discussion
P
a
per
|
Discussion
P
a
per
|
Discussion
P
a
per
|
Discussion
P
a
per
|
linearized solution of Richards’ equation, with implementation of complex storm histo-ries, an impermeable basal boundary at finite depth and a simple runoffrouting scheme (Savage et al., 2003; Salciarini et al., 2006). Introducing a time-varying rainfall input on the ground surfaceIZ(t), the pressure head responseΨ(Z,t) can be computed using
the following input parameters (variable from cell to cell throughout the model): slope,
5
soil layer depthdlb, depth of the initial steady-state water tabledwt, long term
(steady-state) surface fluxIZLT and saturated hydraulic conductivityKs. However, this solution is appropriate for initial conditions where the hillslope is tension-saturated (Fig. 5a). In the second version (Baum et al., 2008), TRIGRS model was expanded to address infiltration into a partially unsaturated surface layer above the water table by using an
10
analytical solution of the Richards’ equation for vertical infiltration (Fig. 5b). TRIGRS uses four hydrodynamic parameters (θs,θr,αGandKs) to linearize the Richards’
equa-tion through the unsaturated zone, according to Gardner (1958) hydraulic model. If the amount of infiltrating water reaching the water table exceeds the maximum amount that can be drained by gravity, TRIGRS simulates the water-table rise comparing the
15
exceeding water quantity to the available pore space directly above the water table or capillary fringe and then, for each time step, applies the water weight at the initial top of the saturated zone to compute the new pressure head (Baum et al., 2010). For the calculation of the Safety Factor in the unsaturated configuration, the pressure head is multiplied by the effective stress parameter:
20
χ=(θ−θr)/(θs−θr) (2)
as suggested by Vanapalli and Fredlund (2000). This approximation has application to a generalized effective stress law and represents a simplified form of the suction-stress characteristic curve (Lu and Godt, 2008; Lu et al., 2010).
4.3 Parameterization of the numerical model
25
In order to define the input parameters of TRIGRS model, use was made of different methods and techniques. To estimate the spatial variation of soil thickness, the model
NHESSD
3, 2975–3022, 2015Evaluation of shallow landslide triggering scenarios through a physically-based
approach
L. Schilirò et al.
Title Page
Abstract Introduction
Conclusions References
Tables Figures
◭ ◮
◭ ◮
Back Close
Full Screen / Esc
Printer-friendly Version
Interactive Discussion
Discussion
P
a
per
|
Discussion
P
a
per
|
Discussion
P
a
per
|
Discussion
P
a
per
|
proposed by Saulnier et al. (1997), which correlates soil depth to the local slope angle, has been applied to the study area (Fig. 6a). The maximum and minimum values of slope and soil thickness, which were measured within the source areas of the shallow landslides triggered during the 1 October 2009 event, have been used as constraints of the model. These values, equal to 58–17◦ and 1.5–0.5 m respectively, can be
consid-5
ered reliable since the 2009 landslides mostly involved the entire soil profile. Although this model relies heavily on geomorphological simplifications, it is frequently used to estimate a spatially distributed soil depth field in basin scale modelling (e.g. Salciarini et al., 2006).
To reproduce the spatial rainfall distribution of the 1 October 2009 rainstorm, the
10
conditional merging technique (Ehret, 2002; Pegram, 2003) has been chosen as in-terpolating method. In this approach, the information from the satellite radar is used to condition the spatial rainfall field obtained by the interpolation of rain gauge mea-surements. Although there are numerous deterministic methods for estimating spatial rainfall distribution (e.g. Thiessen polygon, Inverse Distance Weighted, polynomial
in-15
terpolation, etc.), geostatistical methods are commonly preferred because they allow not only to account for spatial correlation between neighboring observations to esti-mate values at ungauged locations, but also to include more densely sampled sec-ondary attributes (i.e. weather radar data) with sparsely sampled measurements of the primary attribute (i.e. rainfall) to improve rainfall estimation (Mair and Fares, 2011).
20
In particular, meteorological satellite radars give a large-scale vision of precipitation fields compared to scattered point estimates from rainfall gauges. In this study, use was made of the precipitation rate maps deriving from the processing of EUMETSAT (European Organisation for the Exploitation of Meteorological Satellites) satellite data. These maps, that were made available by the National Center of Aeronautical
Meteo-25
un-NHESSD
3, 2975–3022, 2015Evaluation of shallow landslide triggering scenarios through a physically-based
approach
L. Schilirò et al.
Title Page
Abstract Introduction
Conclusions References
Tables Figures
◭ ◮
◭ ◮
Back Close
Full Screen / Esc
Printer-friendly Version
Interactive Discussion
Discussion
P
a
per
|
Discussion
P
a
per
|
Discussion
P
a
per
|
Discussion
P
a
per
|
derestimation of precipitation (Mugnai et al., 2013). Ten-minute rainfall records of six stations (Antillo, Colle San Rizzo, Fiumedinisi, Ganzirri, Messina Istituto Geofisico and Santo Stefano di Briga) have been used as input data, after conveniently converting them into fifteen-minute data for the comparison with the corresponding radar rainfall maps. Thus, sequential rainfall maps (Fig. 6b) have been obtained referred to the time
5
period between 13:00 and 21:00 UTC.
The hydraulic properties of the colluvial deposit, the steady-state water-table depth and the initial soil moisture conditions have been estimated using HYDRUS 1-D model (Šimůnek et al., 1998), a USDA (United States Department of Agriculture) Salinity Laboratory software which can simulate the water flow into unsaturated porous
me-10
dia resulting from a rainfall event. The software describes infiltration in vadose zone using a modified version of Richards’ equation. In this paper, numerical simulations have been performed for the period 1–30 September 2009 in order to quantify the ef-fect of the 1 month antecedent rainfall on soil moisture conditions. As hydraulic model, van Genuchten–Mualem model (van Genuchten, 1980) was chosen to simulate the
15
water flow, whereas the hydrodynamic parameters θs, θr, αG and Ks are predicted
from soil grain size distribution using the ROSETTA Lite module (Schaap et al., 2001). This module uses a database of measured water retention and other properties for a wide variety of media. For a given grain size distribution and other soil properties the model estimates a retention curve (i.e. the relationship between soil water suctionΨ
20
and the amount of water remaining in the soilθ) with good statistical comparability to known retention curves of other media with similar physical properties (Nimmo, 2005). Daily rainfall data have been used as input for the model, whereas evapotranspiration is accounted for by inserting into the Hargreaves equation (Jensen et al., 1997) the maximum and minimum temperature values recorded during the investigated period.
25
As lower boundary, a zero-flux condition was assumed due to the presence of an im-permeable bedrock below the soil cover. A 80 cm soil profile inclined of 38◦ (i.e. the average soil thickness and slope observed within the landslide source areas) was
NHESSD
3, 2975–3022, 2015Evaluation of shallow landslide triggering scenarios through a physically-based
approach
L. Schilirò et al.
Title Page
Abstract Introduction
Conclusions References
Tables Figures
◭ ◮
◭ ◮
Back Close
Full Screen / Esc
Printer-friendly Version
Interactive Discussion
Discussion
P
a
per
|
Discussion
P
a
per
|
Discussion
P
a
per
|
Discussion
P
a
per
|
sen as the most representative geometric configuration of the slope prior to 1 October event.
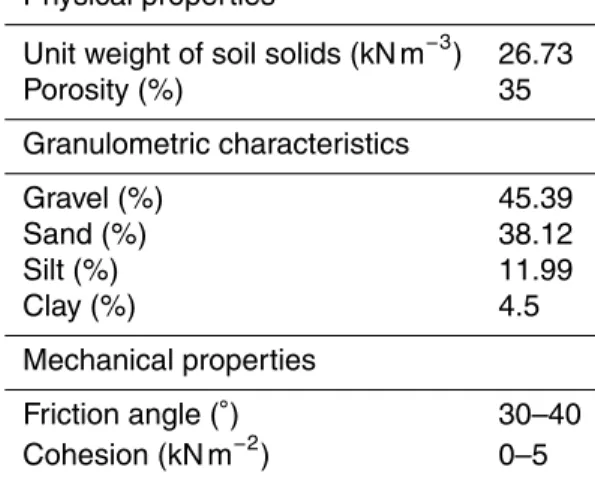
Laboratory tests have been performed to measure physical and mechanical proper-ties of the colluvial deposit (Table 1). The grain size distribution analysis shows a soil composed mainly of gravel (45.4 %) and sand (38.1 %) with minor components of
5
silt and clay (12 and 4.5 % respectively). With regard to the mechanical parameters, drained triaxial tests have been conducted on three large reconstituted specimens (H=200 mm, D=100 mm). To reconstitute each specimen, the soil was compacted inside a mould in different layers of decreasing depth, in order to account for under-compaction. The tested material was sieved leaving the maximum grain size of 10 mm
10
and imposing 35 % of porosity (i.e. the average porosity obtained from different soil samples) and 8 % of initial water content. The latter value can be considered repre-sentative of the investigated soil on the basis of the results of HYDRUS 1-D model (see Sect. 5.2). For the same material other authors (Aronica et al., 2012; Peres and Cancelliere, 2014; Penna et al., 2014) reported values which vary between 30 and 40◦
15
for the friction angle and between 0 and 5 kN m−2for the cohesion; thus the resulting internal friction angle (i.e. 36.3◦), obtained by assuming a null cohesion, substantially agrees with these values. However, it is important to stress that this difference can de-pend on both the natural spatial variability of soil shear strength parameters and the type of deposit, characterized by an extremely variable texture resulting from erosion
20
and weathering areas.
Finally; as regards the 1 October 2009 landslide inventory, it is important to note that for each of more than 700 mapped landslides, identified through analysis of high resolution aerial orthophotos integrated by field surveys in the days after the event, the landslide deposit has been distinguished from the source area. Therefore, in
or-25
NHESSD
3, 2975–3022, 2015Evaluation of shallow landslide triggering scenarios through a physically-based
approach
L. Schilirò et al.
Title Page
Abstract Introduction
Conclusions References
Tables Figures
◭ ◮
◭ ◮
Back Close
Full Screen / Esc
Printer-friendly Version
Interactive Discussion
Discussion
P
a
per
|
Discussion
P
a
per
|
Discussion
P
a
per
|
Discussion
P
a
per
|
5 Results
5.1 Rainfall probability curves and return period of the 1 October 2009 event
Figure 7a–c shows the graphic comparison between cumulative frequency (symbols) and GEV probability function (continuous line), obtained by using the daily rainfall records from Santo Stefano di Briga and Messina Istituto Geofisico stations. As it can
5
be observed, the good fitting between data and probability function confirms the re-liability of the applied method. With regard to the probability curves (Fig. 7b–d), the comparison reveals that the highest rainfall values are attributed to the Santo Stefano di Briga curves for the same return period. This finding emphasizes that, in the past, this station (the most representative of the sector most severely hit by the 2009 event)
10
has recorded more intense and severe rainfall events than the other one. On the basis of the same curves, the return periods of the rainfall accumulated up to 1 October 2009 have been estimated (Table 2). An estimation has been made also for the rainfall ac-cumulated up to 30 September (i.e. the day prior to the event), but the obtained values infer that the rainfall amount, at both stations, is far from exceptional (estimated return
15
periods of 1 year); thus, rainfall prior to the event practically lies within the standard range, in contrast with rainfall accumulated up to 1 October. In this case, while rainfall recorded at Messina Istituto Geofisico continues to be unexceptional (estimated return period of 4–5 years), rainfall accumulated in a single day (1 October) at Santo Stefano di Briga has a return period of 47 years. This means that the event under review was
20
not only strongly localized in space, but also particularly severe in that specific sector. This finding is also substantiated by what has been previously pointed out, i.e. the high-est return periods have been obtained for the station with the highhigh-est rainfall probability curves.
With regard to the analysis of the historical data of maximum hourly rainfall intensity
25
from Alì Terme station, the results shows that the fit between cumulative frequency and probability (Fig. 8a) is not as good as in the preceding analyses. However, it is worth stressing that data about intense precipitation are generally scantier than daily
NHESSD
3, 2975–3022, 2015Evaluation of shallow landslide triggering scenarios through a physically-based
approach
L. Schilirò et al.
Title Page
Abstract Introduction
Conclusions References
Tables Figures
◭ ◮
◭ ◮
Back Close
Full Screen / Esc
Printer-friendly Version
Interactive Discussion
Discussion
P
a
per
|
Discussion
P
a
per
|
Discussion
P
a
per
|
Discussion
P
a
per
|
ones and that the resulting statistical analyses are usually less reliable. The resulting rainfall probability curves (Fig. 8b) define a return period of 78 years for the 1 h rainfall recorded on 1 October 2009 in Fiumedinisi station, a value greater than that estimated for the 1 day rainfall recorded in Santo Stefano di Briga station (47 years). Therefore, the 1 h rainfall event can be classified as an extreme event. Nevertheless, it is particularly
5
interesting to analyze the sub-event of maximum duration equal to three hours, a time after which major damage was observed in the area. In this case the estimated return period is equal to 26 years (Table 3): this value infers that, even if the return period of the 1 h rainstorm allows to assert that it was an extreme event, the 3 h sub-event is characterized by a return period much lower, which suggests its classification as
10
not severe. However, it is worth noting that the probabilistic analysis is affected by several uncertainties, related to the type of probabilistic model and the definition of the parameters of the model itself. Generally speaking, the uncertainty tends to increase with decreasing the sample size (i.e. the number of measurement years) and increasing the considered return period.
15
5.2 Back-analysis of the 1 October 2009 event
As previously mentioned, before applying the TRIGRS model to back-analyze the 1 Oc-tober 2009 event, it was necessary to evaluate the soil moisture conditions prior to the event through HYDRUS 1-D model. According to the simulation results, the absence of a steady-state water table within the soil cover can be assumed, whereas in Fig. 9a the
20
resulting volumetric water content trend with depth at four different times (1, 24, 25 and 30 September) is reported. The initial soil moisture (θ=0.049) is assumed near to the residual water content value considering the hot, dry conditions during the preceding summer months. The effect of the September rainfall (Fig. 9b) results in a progressive increase in soil water content, that is equal to 0.202 on 25 September (the day after
25
NHESSD
3, 2975–3022, 2015Evaluation of shallow landslide triggering scenarios through a physically-based
approach
L. Schilirò et al.
Title Page
Abstract Introduction
Conclusions References
Tables Figures
◭ ◮
◭ ◮
Back Close
Full Screen / Esc
Printer-friendly Version
Interactive Discussion
Discussion
P
a
per
|
Discussion
P
a
per
|
Discussion
P
a
per
|
Discussion
P
a
per
|
process. On the other hand, the water content trend is much more homogeneous in the first 70 cm of soil on 30 September, resulting in an average value of 0.145, which corresponds to a gravimetric water content (w) of approximately 8 % and a degree of saturation (Sr) equal to 41.5 % (on the basis of the physical properties reported in
Table 1).
5
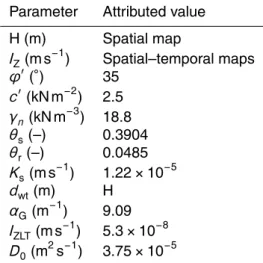
Once the initial soil moisture conditions are estimated, all the input parameters re-quired by TRIGRS can be defined (Table 5). As digital elevation model, use was made of a detailed (2×2 m) pre-event DEM, resampled at the 4×4 m resolution substan-tially due to limitations on computing time. Soil thickness (H) and rainfall intensity (IZ)
vary from cell to cell on the basis of maps obtained through the methods described in
10
Sect. 4.3. According to the available data an average friction angle and cohesion of 35◦ and 2.5 kN m−2have been used whereasγn, which represents the depth-averaged soil unit weight, is equal to 18.8 kN m−3given the porosity (35 %), the degree of saturation (41.5 %) and the unit weight of soil solids (26.73 kN m−3),θs(saturated water content), θr (residual water content) and Ks (saturated hydraulic conductivity) are directly pre-15
dicted using HYDRUS-1D model. Given the absence of an initial water table, its depth (dwt) so corresponds to the bedrock–soil interface. To evaluate αG parameter, that is
typical of Gardner hydraulic model, use was made of the conversion formula introduced by Ghezzehei et al. (2007) which defines a correspondence between Gardner and van Genuchten–Mualem models through the capillary length approach (Warrick, 1995). On
20
the basis of the results of the same simulations the IZLT parameter, that represents
the long-term background rainfall rate, was assumed equal to the cumulative actual surface flux value (5.3×10⁻⁸m s−1). Finally, the saturated hydraulic diffusivity (D0) has been calculated according to:
D0=
(KsH) Sy
(3)
25
whereKs is the saturated hydraulic conductivity,H the average soil thickness (80 cm)
andSy the specific yield (Grelle et al., 2014). If we consider that the investigated soil
NHESSD
3, 2975–3022, 2015Evaluation of shallow landslide triggering scenarios through a physically-based
approach
L. Schilirò et al.
Title Page
Abstract Introduction
Conclusions References
Tables Figures
◭ ◮
◭ ◮
Back Close
Full Screen / Esc
Printer-friendly Version
Interactive Discussion
Discussion
P
a
per
|
Discussion
P
a
per
|
Discussion
P
a
per
|
Discussion
P
a
per
|
can be classified as loamy sand, the specific yield has been assumed equal to 0.26, on the basis of typical values given by Johnson (1967) (also reported in Loheide II et al., 2005) for each soil textural class.
With regard to the comparison between the numerical simulations and the landslide inventory map, Table 6 reports, as well as the number and relative percentage (PU) of 5
predicted unstable pixels (i.e. FS≤1), the percentage of correctly predicted landslide (PL) and stable (PS) pixels between 14:00 and 21:00 UTC, whereas Fig. 10 shows the temporal evolution of slope instability at the catchment scale. As can be noted, only 11.7 % of pixels are indicated as “unstable” at 14:00 UTC. After a slowly increase in the following three hours, the instability rapidly rose between 17:00 and 18:00 UTC (PU:
10
+25.1 %) in correspondence of a rainfall peak, and the critical stage continued until
21:00 UTC, given that PU passed from 47.7 to 100 % in just 3 h. This temporal
evo-lution of the phenomenon substantially agrees with both the witnesses and amateur videos, although during the real event no particular increase of slope instability has been recorded after 20:00 UTC. To fully evaluate the accuracy of the model, a ROC
15
(Receiver Operating Characteristics) curve analysis has been performed by compar-ing the final safety factor map (21:00 UTC) with the landslide inventory. The ROC curve measures the goodness of the model prediction plotting, for different threshold val-ues, the True Positive rate, i.e. the proportion of correctly predicted positive values (“landslide presence”) and the False Positive rate, i.e. the proportion of negative values
20
(“landslide absence”) erroneously reported as positive. The Area Under Curve (AUC), which varies from 0.5 (diagonal line) to 1, quantifies the predictive capability of the model.
According to the results, the FS map correctly classifies 47.0 % of source areas (True Positive) and 80.4 % of stable areas (True Negative) with FS=1, whereas the
25
NHESSD
3, 2975–3022, 2015Evaluation of shallow landslide triggering scenarios through a physically-based
approach
L. Schilirò et al.
Title Page
Abstract Introduction
Conclusions References
Tables Figures
◭ ◮
◭ ◮
Back Close
Full Screen / Esc
Printer-friendly Version
Interactive Discussion
Discussion
P
a
per
|
Discussion
P
a
per
|
Discussion
P
a
per
|
Discussion
P
a
per
|
overestimation of slope instability characterizes in particular the NW sector of the study area (Fig. 11b).
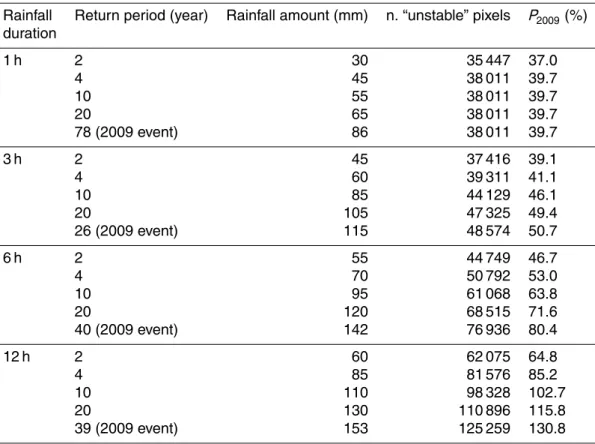
5.3 Evaluation of different triggering scenarios
Once the physically-based model was calibrated through the back-analysis of the 1 October 2009 event, different TRIGRS simulations have been performed by varying
5
the rainfall input, on the basis of the daily rainfall probability curves obtained for the rain gauge closest to the study area, i.e. Santo Stefano di Briga monitoring station. With regard to the other input parameters of the model, those used for the analysis of the 1 October event have been kept. Table 7 shows the number of unstable pixels depending on rainfall event. The four rainfall values used in the analyses correspond
10
to four different return periods (RP): 2, 4, 10 and 20 years. In this way, it is possible to evaluate the effect of more frequent rainfall events with respect to the 2009 one, whose RP has been estimated equal to 47 years. Given the short duration of the 1 October event, only 1 day rainfall events have been simulated. According to the results, a sig-nificant level of instability may be also caused by events much less severe than the 1
15
October one. For instance, an event with RP=10 years (such as the 25 October 2007 one, see Sect. 3) would cause approximately 62.7 % of the slope instability computed with the 1 October rainfall amount. Nevertheless, in the case of the 2009 event, if we compare the simulation results obtained by using the 1 day rainfall value with those gained with the 15 min rainfall maps, it can be noted how the first one identifies a much
20
higher number of unstable pixels (203 778 rather than 95 748), overestimating the in-stability phenomena. For this reason, hourly simulations have also been performed on the basis of the rainfall probability curves obtained for Alì Terme station (Table 8). In this case, the comparison shows that the 6 h rainfall simulation depicts a triggering scenario substantially similar to the one simulated with the 15 min rainfall maps. In fact, 76 936
25
pixels are predicted as “unstable” by the model, corresponding to 80.4 % of the pix-els identified in the 15 min rainfall simulation. With regard to the other results, it can be noted the importance, in terms of produced instability, of the 1 h rainfall amount even for
NHESSD
3, 2975–3022, 2015Evaluation of shallow landslide triggering scenarios through a physically-based
approach
L. Schilirò et al.
Title Page
Abstract Introduction
Conclusions References
Tables Figures
◭ ◮
◭ ◮
Back Close
Full Screen / Esc
Printer-friendly Version
Interactive Discussion
Discussion
P
a
per
|
Discussion
P
a
per
|
Discussion
P
a
per
|
Discussion
P
a
per
|
low return periods. For instance, a rainfall with RP=2 years would cause about 37 % of the slope instability calculated for the entire 1 October event. On the other hand, it is worth noting that the number of unstable pixels does not increase, even in response of extremely high 1 h rainfall events (such as the 1 October one). Recurring three and six-hour rainfall events can cause significant slope instabilities, too, even though more
5
critical conditions develop in response of rainfalls which have a return period equal or greater than 10 years. For rainfall events of longer duration (12 h), the number of predicted unstable pixels is extremely high also for very low return periods.
6 Discussion
Analyzing the results obtained from the numerical simulations, it follows that the
dura-10
tion of a rainfall event can produce completely different triggering scenarios, even with the same rainfall amount. For instance, in the case of 1 day simulation, the severity of the 1 October 2009 event results much higher compared to the real one. This confirms the need of hourly analyses for extreme but short duration rainfall events. With regard to the 1 October one, the event was characterized by a main phase of approximately five
15
hours (16:00–21:00 UTC) with a 1 h rainfall peak (17:00–18:00 UTC), thus numerical simulations not exceeding 6 h can be considered sufficiently representative of the real phenomenon. In this respect, it is worth noting that about the half (50.7 %) of the area identified as “unstable” after the entire event is related to the 3 h rainfall. This means that the sub-event which caused the most of landslides is characterized by a return
20
period much lower compared to the 1 day rainfall (26 and 47 years, respectively). On the other hand, the 1 h sub-event does not produce as much instability, although it has a higher return period (78 years). Actually, on the basis of the results obtained with different 1 h rainfall inputs, it turns out the number of unstable pixels does not increase over a certain rainfall threshold, approximately ranging from 30 to 45 mm. This point can
25
NHESSD
3, 2975–3022, 2015Evaluation of shallow landslide triggering scenarios through a physically-based
approach
L. Schilirò et al.
Title Page
Abstract Introduction
Conclusions References
Tables Figures
◭ ◮
◭ ◮
Back Close
Full Screen / Esc
Printer-friendly Version
Interactive Discussion
Discussion
P
a
per
|
Discussion
P
a
per
|
Discussion
P
a
per
|
Discussion
P
a
per
|
infiltration rate is very low, often insufficient for trigger numerous shallow landslides. Therefore, landslide phenomena similar to the 1 October one are related to extreme but sufficiently long rainfall events. Significantly, it results a clear increase in slope insta-bility in the 3 h and 6 h simulations, even with rainfall values characterized by relatively low return periods (e.g. 10 years). These results emphasize the severity of recurring
5
rainfall events in the study area and explain the high number of landslide/flood events occurred in the past (see Sect. 3). In fact, considering the high values which charac-terize the rainfall probability curves of Santo Stefano di Briga and Alì Terme rain gauge stations (see Sect. 5.1), we can assert that short duration rainfall events frequently have a high intensity in this specific area. Therefore the combination of recurring and
10
heavy rainfall events, probably due to specific geomorphological and climatic features that influence the development of localized severe storms, justifies the approximately 40 landslide/flood events that would have occurred since the last century in this area.
From a methodological point of view, it is worth noting how the approach proposed in this paper (Fig. 12) combines various techniques and methods optimizing different
15
types of data, depending on their availability. For instance, the parameterization of the physically-based model can be performed both in the absence and presence of preced-ing reference events. In the former case, only the geotechnical parameters and the soil thickness are needed, while in the latter the process used for the back-analysis of the 1 October 2009 event can be applied to any other event. Here, in particular, it is important
20
to stress that the comparison with a preceding landslide event allows to increase the reliability of the model, as long as a comprehensive and detailed event-based landslide inventory exists. With regard to the evaluation of the initial soil conditions, in this study the HYDRUS 1-D model has been used considering the 1 month antecedent rainfall. However, some recent studies have investigated the linkage between soil moisture and
25
landslide occurrence by using soil moisture data derived by in situ (Baum and Godt, 2009; Hawke and McConchie, 2011) and satellite sensors (Ray and Jacobs, 2007; Ray et al., 2010), and this type of measurements, if available, can be used to define the input parameters of the model. The last step of the approach concerns the definition
NHESSD
3, 2975–3022, 2015Evaluation of shallow landslide triggering scenarios through a physically-based
approach
L. Schilirò et al.
Title Page
Abstract Introduction
Conclusions References
Tables Figures
◭ ◮
◭ ◮
Back Close
Full Screen / Esc
Printer-friendly Version
Interactive Discussion
Discussion
P
a
per
|
Discussion
P
a
per
|
Discussion
P
a
per
|
Discussion
P
a
per
|
of the rainfall input to be used for the evaluation of a specific triggering scenario. By means of a statistical analysis of hourly rainfall data, different rainfall values having dif-ferent return periods may be used to depict different scenarios, to changing the initial soil conditions and the duration of the rainfall input. However, as emphasized in the discussion of the results, establishing which is the critical rainfall duration that triggers
5
the shallow landslides cannot be straightforward, because completely different slope stability conditions can be obtained with different combinations of single rainfall inputs within the same rainfall event, even with the same initial soil conditions. For this rea-son, and considering the chance to use also soil moisture data, a possible application of the here-proposed approach could be to develop an early warning system based
10
on rainfall thresholds, identified by the physically-based model calibrated according to the above-described process. In this way, a model in which the initial conditions are constantly updated, could depict more consistent and reliable triggering scenarios, by using any rainfall event forecasted for the next hours.
7 Conclusions
15
In this study, we introduce an approach for the analysis of shallow landslide triggering scenarios that uses the TRIGRS code, a physically-based model which describes the stability conditions of natural slopes in response to specific rainfall events. As a first step, the model has been calibrated through the back-analysis of a reference landslide event, i.e. the disaster occurred in the southern Messina area on 1 October 2009.
20
Comparing the results of the numerical simulation with the 2009 landslide inventory, it turn out the model is able to reproduce quite well the reference event, both in terms of temporal evolution and spatial distribution of slope instability, identifying the areas mostly affected by shallow landslides. It is worth stressing that the model has been accurately calibrated through different methods and techniques, with specific focus on
25
NHESSD
3, 2975–3022, 2015Evaluation of shallow landslide triggering scenarios through a physically-based
approach
L. Schilirò et al.
Title Page
Abstract Introduction
Conclusions References
Tables Figures
◭ ◮
◭ ◮
Back Close
Full Screen / Esc
Printer-friendly Version
Interactive Discussion
Discussion
P
a
per
|
Discussion
P
a
per
|
Discussion
P
a
per
|
Discussion
P
a
per
|
Once the physically-based model has been calibrated, different triggering scenar-ios have been reconstructed by varying the rainfall input, on the basis of the daily and hourly rainfall probability curves obtained through a statistical analysis of histor-ical rainfall data. The results indicate that the 1 day simulations tend to overestimate landslide events triggered by extreme but short duration rainfalls (such as the 1
Octo-5
ber one). With regard to the hourly analyses, it results that even recurring 1 h rainfall events can lead to a not negligible instability level. However, if the 1 h rainfall simula-tions show a limit in the increase of unstable pixels over a certain rainfall value, the 3 and 6 h analyses predict significant slope instabilities, in particular for events which have a return period equal or greater than 10 years. This feature confirm the
destabi-10
lizing effect of recurring rainfall events in the study area, justifying the high number of landslide/flood events occurred in the past. As regards the proposed approach, the us-ing of different techniques allows its application to different case studies, on the basis of the data availability. Furthermore, if we consider the possibility to depict constantly updated triggering scenarios, this approach could be used to develop specific landslide
15
early warning systems, in order to support decision-makers in both risk prevention and emergency response.
Acknowledgements. The authors wish to thank the Geostudi Srl. Laboratory (Rome, Italy) for performing the laboratory analyses of physical and mechanical properties of the colluvial de-posit (report number 1718).
20
References
Antonioli, F., Kershaw, S., Rust, D., and Verrubbi, V.: Holocene sea-level change in Sicily and its implications for tectonic models: new data from the Taormina area, northeast Sicily, Mar. Geol., 196, 53–71, doi:10.1016/S0025-3227(03)00029-X, 2003.
Arnone, E., Pumo, D., Viola, F., Noto, L. V., and La Loggia, G.: Rainfall statistics changes in
25
Sicily, Hydrol. Earth Syst. Sc., 17, 2449–2458, doi:10.5194/hess-17-2449-2013, 2013. Aronica, G. T., Biondi, G., Brigandì, G., Cascone, E., Lanza, S., and Randazzo, G.: Assessment
NHESSD
3, 2975–3022, 2015Evaluation of shallow landslide triggering scenarios through a physically-based
approach
L. Schilirò et al.
Title Page
Abstract Introduction
Conclusions References
Tables Figures
◭ ◮
◭ ◮
Back Close
Full Screen / Esc
Printer-friendly Version
Interactive Discussion
Discussion
P
a
per
|
Discussion
P
a
per
|
Discussion
P
a
per
|
Discussion
P
a
per
|
merical simulations and GIS, Phys. Chem. Earth, 49, 52–63, doi:10.1016/j.pce.2012.04.002, 2012.
Baum, R. L. and Godt, J. W.: Early warning of rainfall-induced shallow landslides and debris flows in the USA, Landslides, 7, 259–272, doi:10.1007/s10346-009-0177-0, 2009.
Baum, R. L., Savage, W. Z., and Godt, J. W.: TRIGRS – a Fortran program for transient rainfall
5
infiltration and grid-based regional slope-stability analysis, US Geological Survey, Open-File Report 02-424, US Geological Survey – Denver Federal Center, Denver, Colorado, 61 pp., 2002.
Baum, R. L., Savage, W. Z., and Godt, J. W.: TRIGRS – A Fortran program for transient rainfall infiltration and grid-based regional slope-stability analysis, version 2.0, U SGeological
Sur-10
vey, Open-File Report 2008-1159, US Geological Survey – Denver Federal Center, Denver, Colorado, 75 pp., 2008.
Baum, R. L., Godt, J. W., and Savage, W. Z.: Estimating the timing and location of shallow rainfall-induced landslides using a model for transient, unsaturated infiltration, J. Geophys. Res., 115, F03013, doi:10.1029/2009JF001321, 2010.
15
Berti, M., Martina, M. L. V., Franceschini, S., Pignone, S., Simoni, A., and Pizziolo, M.: Proba-bilistic rainfall thresholds for landslide occurrence using a Bayesian approach, J. Geophys. Res.-Earth, 117, F04006, doi:10.1029/2012JF002367, 2012.
Bonaccorso, B., Cancelliere, A., and Rossi, G.: Detecting trends of extreme rainfall series in Sicily, Adv. Geosci., 2, 7–11, doi:10.5194/adgeo-2-7-2005, 2005.
20
Brunetti, M. T., Peruccacci, S., Rossi, M., Luciani, S., Valigi, D., and Guzzetti, F.: Rainfall thresholds for the possible occurrence of landslides, Nat. Hazard. Earth Sys., 10, 447–458, doi:10.5194/nhess-10-447-2010, 2010.
Caine, N.: The rainfall intensity-duration control of shallow landslides and debris flows, Geogr. Ann. A, 62, 23–27, doi:10.2307/520449, 1980.
25
Catalano, S. and De Guidi, G.: Late Quaternary uplift of northeastern Sicily: relation with the active normal faulting deformation, J. Geodyn., 36, 445–467, doi:10.1016/S0264-3707(02)00035-2, 2003.
Cuppari, P.: Del quadruplice temporale di Messina. Breve cenno, letto dal Prof. Antonio Cuppari nell’Adunanza ordinaria del 1◦
Marzo 1856, Atti della Reale Accademia dei Georgofili di
30
Firenze, 3, 171–187, 1856.
NHESSD
3, 2975–3022, 2015Evaluation of shallow landslide triggering scenarios through a physically-based
approach
L. Schilirò et al.
Title Page
Abstract Introduction
Conclusions References
Tables Figures
◭ ◮
◭ ◮
Back Close
Full Screen / Esc
Printer-friendly Version
Interactive Discussion
Discussion
P
a
per
|
Discussion
P
a
per
|
Discussion
P
a
per
|
Discussion
P
a
per
|
hazard and human influence, Nat. Hazard. Earth Sys., 12, 2907–2922, doi:10.5194/nhess-12-2907-2012, 2012.
Di Stefano, E., Agate, A., Incarbona, A., Russo, F., Sprovieri, R., and Bonomo, S.: Late Quater-nary high uplift rates in northeastern Sicily: evidence from calcareous nannofossils and ben-thic and planktonic foraminifera, Facies, 58, 1–15, doi:10.1007/s10347-011-0271-3, 2012.
5
Ehret, U.: Rainfall and flood nowcasting in small catchments using weather radar, Ph.D. thesis, University of Stuttgart, Stuttgart, Germany, 262 pp., 2002.
Frattini, P., Crosta, G., and Sosio, R.: Approaches for defining thresholds and re-turn periods for rainfall-triggered shallow landslides, Hydrol. Process., 23, 1444–1460, doi:10.1002/hyp.7269, 2009.
10
Gardner, W. R.: Some steady-state solutions of the unsaturated moisture flow equation with application to evaporation from a water table, Soil Sci., 85, 228–232, doi:10.1097/00010694-195804000-00006, 1958.
Ghezzehei, T. A., Kneafsey, T. J., and Su, G. W.: Correspondence of the Gardner and van Genuchten–Mualem relative permeability function parameters, Water Resour. Res., 43,
15
W10417, doi:10.1029/2006WR005339, 2007.
Glade, T.: Establishing the frequency and magnitude of landslide-triggering rainstorm events in New Zealand, Environ. Geol., 35, 160–174, doi:10.1007/s002540050302, 1997.
Greenwood, J. A., Landwehr, J. M., Matalas, N. C., and Wallis, J. R.: Probability weighted moments: definition and relation to parameters of several distribution expressable in inverse
20
form, Water Resour. Res., 15, 1049–1054, doi:10.1029/WR015i005p01049, 1979.
Grelle, G., Soriano, M., Revellino, P., Guerriero, L., Anderson, M. G., Diambra, A., Fiorillo, F., Esposito, L., Diodato, N., and Guadagno, F. M.: Space–time prediction of rainfall-induced shallow landslides through a combined probabilistic/deterministic approach, optimized for initial water table conditions, B. Eng. Geol. Environ., 73, 877–890,
doi:10.1007/s10064-013-25
0546-8, 2014.
Guzzetti, F., Peruccacci, S., Rossi, M., and Stark, C. P.: Rainfall thresholds for the initia-tion of landslides in central and southern Europe, Meteorol. Atmos. Phys., 98, 239–267, doi:10.1007/s00703-007-0262-7, 2007.
Guzzetti, F., Peruccacci, S., Rossi, M., and Stark, C. P.: The rainfall intensity-duration control
30
of shallow landslides and debris flows: an update, Landslides, 5, 3–17, doi:10.1007/s10346-007-0112-1, 2008.
NHESSD
3, 2975–3022, 2015Evaluation of shallow landslide triggering scenarios through a physically-based
approach
L. Schilirò et al.
Title Page
Abstract Introduction
Conclusions References
Tables Figures
◭ ◮
◭ ◮
Back Close
Full Screen / Esc
Printer-friendly Version
Interactive Discussion
Discussion
P
a
per
|
Discussion
P
a
per
|
Discussion
P
a
per
|
Discussion
P
a
per
|
Hawke, R. and McConchie, J.: In situ measurement of soil moisture and pore-water pressures in an “incipient” landslide: Lake Tutira, New Zealand, J. Environ. Manage., 92, 266–274, doi:10.1016/j.jenvman.2009.05.035, 2011.
Hosking, J. R. M., Wallis, J. R., and Wood, E. F.: Estimation of the generalized extreme value distribution by the method of probability weighted moments, Technometrics, 27, 251–261,
5
doi:10.1080/00401706.1985.10488049, 1985.
Houghton, J. T., Ding, Y., Griggs, D. J., Noguers, M., van der Linden, P. J., Dai, X., Maskell, K., and Johnson, C. A.: Climate Change 2001: The Scientific Basis. Contribution of Working Group I to the Third Assessment Report of the Intergovernmental Panel on Climate Change, Cambridge University Press, Cambridge, UK/New York, USA, 881 pp., 2001.
10
Hungr, O., Evans, S. G., Bovis, M. J., and Hutchinson, J. N.: A review of the classification of landslides of the flow type, Environ. Eng. Geosci., 7, 221–238, doi:10.2113/gseegeosci.7.3.221, 2001.
Iovine, G., Di Gregorio, S., and Lupiano, V.: Debris-flow susceptibility assessment through cel-lular automata modeling: an example from 15–16 December 1999 disaster at Cervinara and
15
San Martino Valle Caudina (Campania, southern Italy), Nat. Hazard. Earth Syst., 3, 457–468, doi:10.5194/nhess-3-457-2003, 2003.
Iverson, R. M.: Landslide triggering by rain infiltration, Water Resour. Res., 36, 1897–1910, doi:10.1029/2000WR900090, 2000.
Jacob, M. and Hungr, O.: Debris-flow Hazards and Related Phenomena, Springer-Praxis
Pub-20
lishing Ltd, Chichester, UK, 739 pp., 2005.
Jenkinson, A.F: The frequency distribution of the annual maximum (or minimum) values of meteorological events, Q. J. Roy. Meteorol. Soc., 87, 158–171, doi:10.1002/qj.49708134804, 1955.
Jensen, D. T., Hargreaves, G. H., Temesgen, B., and Allen, R. G.: Computation of ETo
un-25
der nonideal conditions, J. Irrig. Drain. E-ASCE, 123, 394–400, doi:10.1061/(ASCE)0733-9437(1997)123:5(394), 1997.
Johnson, A. I.: Specific yield-compilation of specific yields for various materials, US Geolog-ical Survey, Water Supply Paper 1662-D, US GeologGeolog-ical Survey – Denver Federal Center, Denver, Colorado, 74 pp., 1967.
30