www.nat-hazards-earth-syst-sci.net/11/2951/2011/ doi:10.5194/nhess-11-2951-2011
© Author(s) 2011. CC Attribution 3.0 License.
and Earth
System Sciences
Urban floods: a case study in the Savigliano area
(North-Western Italy)
C. Audisio and L. Turconi
CNR-IRPI Torino, National Research Council – Research Institute for the Geo-Hydrological Protection, Torino, Italy Received: 23 January 2011 – Revised: 15 July 2011 – Accepted: 19 July 2011 – Published: 7 November 2011
Abstract. Flood processes and effects are examined, con-cerning two rivers in an urbanized area in North-Western Italy (Piedmont – Cuneo Plain). In May 2008, some areas in Northern Italy were struck by intense and persistent rainfall. In the Cuneo province (Southern Piedmont), floodplain with some urban areas was inundated over ca. ten square kilome-tres, and the city of Savigliano (about 21 000 inhabitants) was particularly hit by flood. A purposely-made historical research has evidenced approximately fifty flood events as having occurred since 1350 in the Savigliano area. Based upon historical data, both documents and maps, GIS (Geo-graphical Information System) technique and field surveys were used to quantitatively assess the growing urbanization of the city and to describe flood processes and effects over years. This work aims to describe the dynamic behaviour of the 2008 flood, also comparing it to past events, in particular those that occurred in 1896. It is emphasized how the knowl-edge of past events can be helpful in reducing urban flooding.
1 Introduction
Floods and landslides are complex phenomena with differ-ent hazard impact. Hurricanes, cyclones, heavy and/or long-lasting rains, and snowmelt are the major triggering factors, but they are insufficient to explain why and when these phe-nomena occur (Llasat et al., 2005). In addition, these natural phenomena exert worldwide a twice interaction with human activities: land use is vulnerable to natural events and related damages, but increasing soil occupancy (i.e. by civil and hy-draulic infrastructures) can negatively influence the “natural”
Correspondence to:C. Audisio (chiaraudisio@gmail.com)
evolution of floods and landslides (Arnaud-Fassetta et al., 2005). Briefly, any event is the result of a complex inter-action between meteorological, environmental, and human factors (Audisio et al., 2009).
In 2008, severe floods and landslides all over the world caused damage of over 12 billion Euros, according to a report by Munich Re Group (2008). Such events occurred mainly in Asia, North America (34 and 30 % of cases, respectively), and Europe (13 %). Countries affected by hurricanes, cy-clones, and severe storms were India, Bangladesh, Nepal, USA, Germany, Romania, Moldova, and Italy (Munich Re Group, 2008).
Since 1950, more than 70 extreme floods imposed dam-age costs in the region of 270 billion Euro and claimed about 120 000 human lives in Southern Asia, Europe, North Amer-ica, and Oceania. Based on a collection of 26 000 cases, re-sults show an exponential raise of devasting natural catas-trophes (that is more than 500 deaths and more than 500 million US $) between 1980 and 2008 (Barredo, 2007; Munich Re Group, 2008). In recent years in Italy, instability processes have caused both casualties and considerable dam-age to property and infrastructures. In the last 80 years alone, 11 000 landslides and 5400 floods have occurred. Since 1980, the Italian State has spent 42.4 billion Euros or about 5.7 million per day in restoration and remedial works for nat-ural disasters (Luino, 2005). Results from above mean a sig-nificant increase in material damage with rising costs to na-tional governments but a decline in casualties, especially in Western countries, yet an increase of loss in human lives in Eastern countries.
human activities may interplay with natural processes during a flood event.
For centuries the cities have expanded near rivers in rea-son of the need of water. However, due to their natural evo-lution, rivers are sometimes affected by severe or extreme floods. Provided that the flood hazard in a given area can be prevented, floodplains represent a valuable resource ei-ther for urban, agricultural, and/or industrial development (Hey, 1997). Step by step, a range of engineering solutions have been developed to reduce flood risk. Channel works in-clude widening of the flow section, dredging, and straighten-ing the river course (Hey, 1997). This leads, by consequence in many cases, to abstracting the geomorphological evolu-tion of the river – disrupting the sediment transport continu-ity and promoting erosion or deposition – and this can affect adjacent stripes of land (Brookes, 1987). River channels are inherently unstable, particularly over long timescales (more than thousands of years), but they can also be unstable over a span of time of a human life (Hey, 1997).
The use of historical data can partially help to understand the evolution of a territory, provided that historical data cover a timespan reasonably wide. Careful historical research has allowed to verify that nearly all the areas affected by floods in present times suffered the same events also in the past; understanding such repetitive principle may help in hazard investigation and zonation (Burby, 2001; Fernandez de Vil-lata et al., 2001; Benito et al., 2003, 2004; Tropeano and Turconi, 2004; Dewan et al., 2007). Many studies based on historical documents are a support to estimating natural haz-ard, more frequently applied to flood hazard forecast, both in Italy (Audisio et al., 2009; Capelli et al., 1997; Guzzetti et al., 2005; Luino and Turitto, 1996; Spaliviero, 2003; Surian and Rinaldi, 2003; Tropeano and Turconi, 2004) and other coun-tries (Coeur and Lang, 2008; Glaser and Stangl, 2004; Hilker et al., 2009; Kreibich and Thieken, 2009; Naef and Bez-zola, 1990; Naulet et al., 2005; Mertz et al., 2008; Meunier, 1988). Historical data are used to draw information in studies on stream channel hydraulics (Bardsley, 1989; Bayliss and Reed, 2001; Helms et al., 2002; Sutcliffe, 1987), as well to describe phenomena and related damage (Brath et al., 2004; Copien et al., 2008; Gori and Burton, 1996; Yu et al., 2009; Zeng and Zaho, 1992).
For the purpose of this paper, the main utilities of historical documents are:
– to reconstruct the chronological sequence of floods;
– to document the phenomena and related damage. The manipulation of historical data presents some problem-atic issues. First and foremost, separating subjective compo-nents from objective ones when consulting historical sources is a very complex task (Glaser and Stangl, 2004). In addition, some documents may not bring relevant evidence (i.e. date or magnitude of a given event) or may emphasize some sec-ondary aspects without describing phenomenon or damages;
different reporting styles and presentation could induce er-rors; information could be not of first-hand source; or a same event could be reported in different archives and/or different documents (Ibsen and Brunsden, 1996). Critical evaluation of sources, comparisons with present-day information and descriptions, derivation of indices are just some of the meth-ods which may give an idea of the complexity, approaches, and results that may be obtained (Glaser and Stangl, 2004).
Positive aspects are the huge amount of data sources and available data (technical projects, reports, warnings, notes and manuscripts, drawings, maps, and photographs) and the timespan period which can be investigated (in the case here in study, since 1350). But before data can be reconstructed, var-ious types of archives need to be found and explored (Govi et al., 1990). The historical data thus represents the start-ing point in geomorphological studies about floods, together with GIS (Geographical Information System) use.
This paper deals with research on historical floods in the Cuneo plain (North Western Italy – Piedmont Region) close to the city of Savigliano (about 21 000 inhabitants). Two sim-ilar flood events in the same area, separated more or less by a century (1896–2008), are put in comparison also on the basis of urban changes that occurred in a so wide span of time. The flood in May 2008 involved the main part of the city, caus-ing a lot of economic damages. After a geomorphological description of the area, the paper illustrates the used method, the collected data, and results are discussed.
2 The case study – geomorphological setting
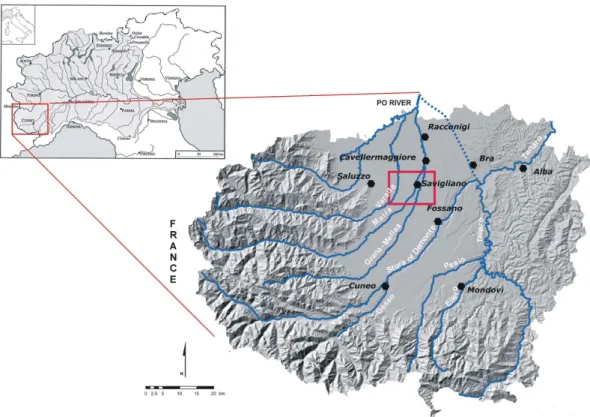
Bounded between the Maritime Alps (South) and the Po River (North), the Cuneo plain represents the geographical apex of the High Po Plain (Maraga, 1989). The area is char-acterized by a divergent stream channel network (Fig. 1). The Stura di Demonte River is a sort of division axis directed north-eastward, separating the network of Varaita, Maira, Grana streams (northward pattern direction) that inflows into the Po River; and the stream network of Gesso, Pesio, Ellero streams, together with the Stura di Demonte itself (eastward pattern direction), all tributaries of the Tanaro River.
The hydrographical pattern of recent times and the ge-ometry of the associated plain are the composite product of several morphogenetic processes which took place since the Pleistocene, from about one million years to the present. The hydrographical setting of today is the result of channel changes that occurred in the last 10–15 000 years (Maraga, 1989). In addition, the processes which have caused the nat-ural evolution of the stream networks have probably both ge-omorphological and tectonic origin (Biancotti, 1979; Carraro et al., 1994; Sacco, 1884).
Fig. 1.The Cuneo plain with the main hydrographic network, the main cities and studied area (red square). The blue dotted line north of the city of Bra indicates the old path of the Tanaro River. In the background, the Regione Piemonte DTM hillshade, with NW artificial azimuth direction (ESRI ArcGIS 9.2 processing, grid 50×50 m).
At the beginning of the Quaternary, the Tanaro was flow-ing into the Po River, followflow-ing a northward direction (dots in Fig. 1), as witnessed by the petrographic nature of buried gravel sediments (quartzite and conglomeratic quartzites) that form the alluvial deposits in the plain north of Bra. In addition, the elevation at which the abandoned riverbed takes origin is comparable with the terrace on the left bank of Tanaro, near Bra, upstream from the point of overflow (Car-raro et al., 1994). At some point in the Pleistocene, con-comitant factors, such as the headward erosion of a stream network lying in the Alba area and the lateral erosion ex-erted by Tanaro River at the hills on which ran the water-shed between the rivers near Bra, caused the overflow of the Tanaro River in the hydrographic network flowing toward ENE (east-northeast) and the abandonment of the northward-directed stretch. It is likely that the erosion in the east side of the Tanaro River was also induced by the tectonic evolution of the area and surroundings (uplift of the Alps and the north part of the Cuneo plain, Carraro et al., 1994).
The process illustrated above led to the gradual migration of the other rivers over the plain: the tributaries of the Tanaro began to flow eastward, while the plain north of the Torrente Stura di Demonte was gradually affected by a northward flu-vial migration (Maraga, 1989). A distinct watershed between the Po River and Tanaro River was so created. With a good approximation, such watershed can currently locate between
the Grana Stream and the Stura di Demonte River (Biancotti, 1979).
By the seventeenth century, substantial changes had oc-curred along the Grana: the stream, already inflowing into the Po River, was becoming a tributary of the Maira River near the town of Cavallermaggiore. Although signs of such change do not appear today, still presently floodwaters of the Grana Stream tend to flow eastward (Maraga, 1989; Sacco, 1884). This stream, downstream from the Centallo village, “takes its name Mellea” (Sacco, 1884), and for this reason is called Grana-Mellea in this paper. Apart from this particular case, the substantial changes such streams have undergone in the last centuries only concern the riverbed and are there-fore linked to changes in channel bottom conditions due to moving bars and/or islands.
Another channel system must be added to the “natural” network described above. In fact, in the Cuneo plain today, one can find a relict stream channel network of mixed origin, being the artificial one superimposed on the natural (Maraga, 1989). Sometimes this mixed channel system functions as an artificial drainage network for natural flows.
actions, including construction of roads and bridges, often contributed and continue to contribute significantly to condi-tioning the drainage direction in cases of flood.
3 Material and methods
This paragraph illustrates the data source and the used methodology based on: (i) reconstruction of flood events in the studied area; (ii) comparison between two great flood (October 1896 and May 2008) using GIS; and (iii) evalua-tion of urban growth of the city using GIS.
Since some detailed references at local scale appeared rel-evant in the context of the dynamic evolution of the two floods, they have been added to the text.
3.1 Historical data
A detailed research of historical sources (mostly unpublished documents) was conducted in the archives of the National Research Council – Institute for Geo-Hydrological Protec-tion (hereinafter CNR-IRPI) of Turin and of the Savigliano municipality. Research was also made in the Savigliano public library. In the former, several interesting documents were perused regarding the evolution of the city, past floods, restoration, and protection works (mainly embankments). In the latter, newspapers and monographs were found concern-ing both the history of the recurrent floods and the develop-ment of the urban setup of Savigliano (AA. VV, 1992; Botta, 1988, 2005; Turletti, 1879).
Being the Savigliano city and territory are crossed by three streams (Varaita, Maira, Grana-Mellea), attention was given to flood events and affected areas concerned by specific wa-tercourses above.
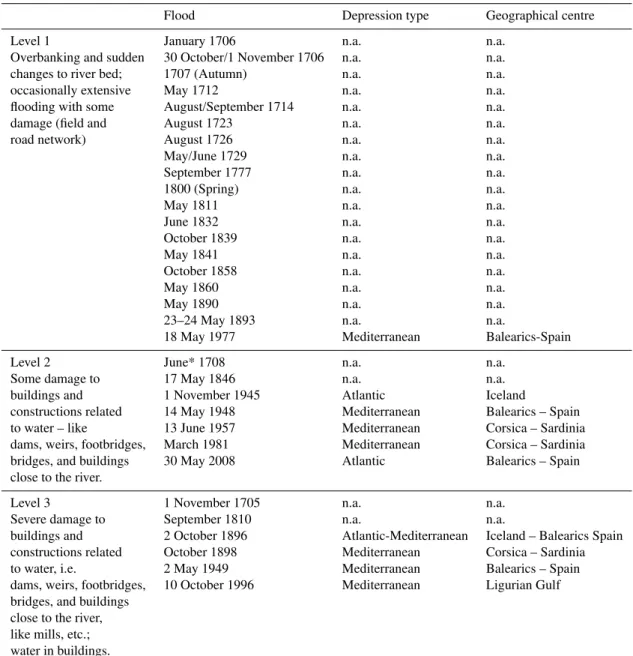
The bulk of information was collected in a database; since 1368, fifty-four floods were documented. As suggested by other works dealing with historical data (Glaser and Stangl, 2004), flood-reports were grouped into a straightforward but standardised initial 3-tiered classification following the Govi and Turitto (1994) method based mainly on damage’s grav-ity (see Table 1 for the criteria): local phenomena (level 1), above averaged phenomena with moderate damage (level 2), and regional and/or catastrophic floods (level 3). Such method and the comparison between different sources helped us to judge the reliability of historical data; the next step was their quantification and analysis. According to the detail of documents describing phenomena and related damage, most of the floods could be classified as local phenomena (level 1): more than 30, more or less equally distributed during the cen-turies. Based on such classification, the major floods that occurred since 1700 are summarized in Table 1. Maira and Grana-Mellea streams were responsible for the most damage in Savigliano and were involved in all the floods of levels 2 and 3. Varaita stream, which flows three kilometres from
Savigliano, was involved in only a few floods, all classified level 1.
The historical research has allowed the individuation of two floods of different level but with similar characteris-tics: October 1896 and May 2008, described in the following paragraphs.
3.1.1 1896 October flood
Information and descriptions on the effects and damages re-lated to the flood that occurred in 1896 October were drawn from unpublished documents (reports and maps) found in the Archives of the City of Savigliano, while the public library of Savigliano provided a local newspaper collection (“Il Sav-iglianese”) and some books and articles dealing with descrip-tions of the territory throughout history (Botta, 2005). Some partial information on the meteorological situation are avail-able on a specialized web-site (http://www.wetterzentrale.de, access: 15 February 2010 and 6 July 2011). According to the available baric maps, the region was affected by two low pressure circulations, with the minimum centered on Iceland and the Balearic islands. They remained stationary for four days because of the block exerted by an anticyclonic promon-tory with Atlantic and African origin on one side and East European origin on the other. Unfortunately, no detailed rain-fall data are available.
The event’s chronicle deals with a short article on 2 Oc-tober which describes the Grana-Mellea stream as “extraor-dinarily enlarged... menacing housings... flood hazard is im-pending with much damage to settlements; there is also fear that the bridge on the main road will collapse”.
Other documents bear witness to flooding in some vil-lages, when main walls of houses were destroyed by wa-ters overflowing the channels both of the Grana-Mellea and Maira streams. In particular, ”Il Saviglianese” (issue 9 Oc-tober 1896) offers more detailed descriptions about urban flood effects. Waters overflowed the Mellea stream chan-nel on 4 October around 17:00 near the“woody bridge on the Cuneo road” (at present National Road No. 20, south part of the city), whence they spread over the southern area of the city (Fig. 3 for location). Flowing along the railroad, floodwaters reached Borgo Marene and the southeast zone of the city, speading over the railroad station and also involving the factory (presently the ALSTOM plant; see Fig. 3 for the location).
Table 1. Savigliano: main historical floods since 1700, and different critical levels (by Govi and Turitto, 1994, modified). In level 1 the floods without exact month are not indicated. Meterological configurations and generating depression system are indicated (data derived by Nigrelli and Audisio, 2009 and http://www.wetterzentrale.de, access: 15 February 2010 and 6 July 2011; n.a. indicates not available data).
Flood Depression type Geographical centre
Level 1 January 1706 n.a. n.a.
Overbanking and sudden 30 October/1 November 1706 n.a. n.a.
changes to river bed; 1707 (Autumn) n.a. n.a.
occasionally extensive May 1712 n.a. n.a.
flooding with some August/September 1714 n.a. n.a.
damage (field and August 1723 n.a. n.a.
road network) August 1726 n.a. n.a.
May/June 1729 n.a. n.a.
September 1777 n.a. n.a.
1800 (Spring) n.a. n.a.
May 1811 n.a. n.a.
June 1832 n.a. n.a.
October 1839 n.a. n.a.
May 1841 n.a. n.a.
October 1858 n.a. n.a.
May 1860 n.a. n.a.
May 1890 n.a. n.a.
23–24 May 1893 n.a. n.a.
18 May 1977 Mediterranean Balearics-Spain
Level 2 June* 1708 n.a. n.a.
Some damage to 17 May 1846 n.a. n.a.
buildings and 1 November 1945 Atlantic Iceland
constructions related 14 May 1948 Mediterranean Balearics – Spain
to water – like 13 June 1957 Mediterranean Corsica – Sardinia
dams, weirs, footbridges, March 1981 Mediterranean Corsica – Sardinia
bridges, and buildings 30 May 2008 Atlantic Balearics – Spain
close to the river.
Level 3 1 November 1705 n.a. n.a.
Severe damage to September 1810 n.a. n.a.
buildings and 2 October 1896 Atlantic-Mediterranean Iceland – Balearics Spain
constructions related October 1898 Mediterranean Corsica – Sardinia
to water, i.e. 2 May 1949 Mediterranean Balearics – Spain
dams, weirs, footbridges, 10 October 1996 Mediterranean Ligurian Gulf bridges, and buildings
close to the river, like mills, etc.; water in buildings.
* Estimated date, the document speaks about wheat cropping.
which are reported here. The report mainly refers to the sit-uation along the Mellea stream, and description is provided step by step moving downstream. In ten sites the banks bear evidence of deep erosions over stretches up to 150 m-long, an important levee that fails to collapse being undermined. Near“Borgo Marene(Fig. 3 for location)in this city much heavier are the conditions of such torrent which is seriously menacing” over a large extent of cultivated fields and cart roads, due to bank erosion and overflow hazard well appar-ent in two sites.
Fig. 2. Area affected by the 1896 flood (oblique blue lines). The red colour represents the city at the time (derived by the 1879 map edition): all the city was involved in flood. In the red circle the Torino-Cuneo railway bridge on Grana-Mellea River is indicated. In the background the Technical Regional map, 1991 edition.
fields, are menacing the whole locality, including the railroad itself...”.
The area involved by the flood was 21 km2(Fig. 2), as cal-culated over the total municipality area. The damage claimed by factories and private citizens was 104 300 Italian liras, corresponding to 393 210.58 Euros of today.
3.1.2 2008 May flood
The rainfall event occurred on 27–30 May 2008 and was most intense in the western alpine sector, where it caused major damage to property and environment, also claiming four human losses in the Pellice valley (Nigrelli and Audisio, 2009).
In April, the rainfall was 30 % higher than the histori-cal value in the period 1960–1990 (ARPA Piemonte, 2008). Therefore, the 2008 flood was the outcome from a particu-lar meteorological situation, happening immediately after a wet spring. In addition, after 24 May the Piedmont Region was affected by a low pressure circulation of Atlantic origin,
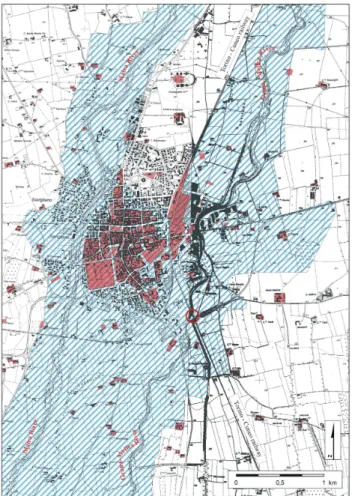
Fig. 3. Flooded area in May 2008 event (oblique green and blue lines). In the map the districts usually affected by flood are indi-cated (Borgo San Giovanni, Borgo Marene, Borgo Pieve, and Borgo Suniglia). The locations of the main factory and the business area are indicated too. In the red circle, the square flooded in Fig. 7a and b. In background the Technical Regional map, 1991 edition.
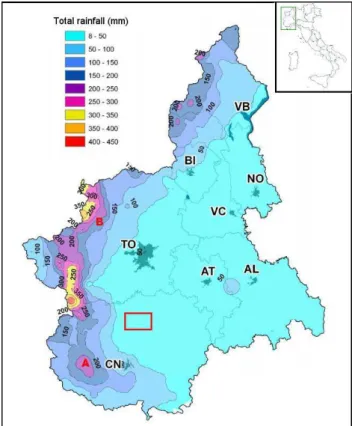
Altogether during the 27–30 May rainfall event, in the alpine area 50 % of the rain gauges registered more than 200 mm, 13 % more than 300 mm, and 2 % more than 400 mm (over 100 mm in 12 h; see Fig. 4 for details). The considered rain gauges in the alpine area are 46 in total. In addition, the freezing level was always over 3100 m. Con-sequently, falling rain instead of snow was an aggravating circumstance.
Considering the geographical distribution of the rainfall, the sectors of western alpine area more or less severely in-volved were over a strip of land N-S oriented mainly corre-spond to the middle and upper part of most alpine valleys stretching from the Stura di Demonte (south; A in Fig. 4) to the Stura di Valgrande (north; B in Fig. 4). The floodplain in the Cuneo and Torino provinces was partially involved. These considerations are further evidence as the main feature of this event, having recorded locally but not extensively very intense and persistent rainfall, contrary to what usually hap-pens during the long-lasting rainfall events (ARPA Piemonte, 2008).
As a consequence, the high rainfall depth in some sectors of the alpine area induced high stream discharges and partial flooding over a wide strip of land in the plain. In particular, during the night between 29 and 30 May, the Cuneo plain and the Savigliano area were involved by the flooding of Maira and Grana-Mellea streams.
The flood began to expand on 30 May during the night at approximately 02:30–03:00. The main flooded areas were located in the south and east of the city. Overflows along Grana-Mellea stream occurred in correspondence to the left bank of the river and near two farms in the countryside south of the city. Hence, the waters crossed fields (Fig. 3) and reached the southern part of Savigliano. In the city, houses and some factories (ALSTOM plant, a train engineering fac-tory) were involved. In the countryside, some farms and handicraft activities were affected by the floods both on right and left banks. The left bank presented the largest damage, where water depth rose to 150 cm. Then the Grana-Mellea overflowed, also in correspondence to the Torino-Cuneo rail-way bridge (Fig. 3), which significantly narrows the river. The water flooded part of southern districts and all the dis-trict of Borgo Marene (Fig. 3). In this area the stream, which flows at the edge of the city, overflowed its channel at several points. Part of the flood was also caused by an artificial chan-nel running parallel to the river for a stretch (about 500 m), interfering with it. Damages were reported also by the farms on the right bank of the stream (overflow depth: 50 cm). The buildings close to the Grana-Mellea Stream and the channel were flooded by 1 m-deep water. The railway station was involved too and closed for some hours (10 cm of water on the railroad track and underground passage submerged). The roads and the district near the railway station were slightly in-undated (5 cm of water). In general, a large number of houses and buildings used for work and commercial activities were flooded.
Fig. 4. Piedmont Region and total rainfall event of May 2008 (ARPA Piemonte, 2008, modified). CN corresponds to Cuneo. AandBindicates, respectively, Stura di Demonte valley and Stura di Valgrande valley. The red box indicates the study area. Details are in the text.
The Maira River overflowed in the countryside south of the city where a farm was flooded, and in the countryside north of the city, causing some damages to fields. The flood incomings were at 11:00–12:00 on 30 May.
The area involved by the flood was 3.2 km2. The dam-age complaints by businesses and private citizens were, re-spectively, 44 and 150, totalling 5 million Euros (respectively 3 and 2 million Euros). 650 000 Euros was the amount of damage to roads.
3.2 Field survey and data collection
Table 2. Map and aerial photography data sets for the study area. n.a. = not available.
Year Type Scale Support 1879 Maps of IGMI (First edition) 1:25 000 cartographic 1933 Maps of IGMI (Second edition) 1:25 000 cartographic 1954 Aerial photos (National flight) ∼1:33 000 cartographic
1979 Aerial photos (Regional flight) ∼1:15 000 cartographic
1991 Technical Maps of Region 1:10 000 cartographic/digital 2008 Ortophotos n.a. digital
A second campaign of surveys was conducted, aiming to assess the effects of the flood upstream and downstream the city and to analyze processes and effects outside the built-up area.
A third survey was done in the built-up area of Savigliano. The different uses of all buildings were picked up and in-serted in a GIS-supported database for analysis. Of course, only present day uses have been taken into account, being past uses for most buildings are unknown.
3.3 GIS utilization
The Geographical Information System (GIS) was necessary to apply both for (i) studying the built-up area evolution, and (ii) delimiting and comparing the flooded areas in the 1896 and 2008 floods. To such purpose some cartographic maps were collected. The Army National Geographic Institute (IGMI) provided two different editions (1879 and 1933) cov-ering the Savigliano area, and aerial photos were also consid-ered for three time spans between 1954 and 1979.
Maps and aerial photos were scanned and georeferenced, using the 1991 regional maps as topographic reference. The last aerial recognition is represented by the 2008 orthopho-tos allowed by the National Cartographic web site (Min-istero dell’Ambiente, http://www.pcn.minambiente.it/PCN/, access: 10 November 2009). Table 2 illustrates the map edi-tion, the aerial photos used, and their scale. UTM-ED50 is the Geographic Projection being used.
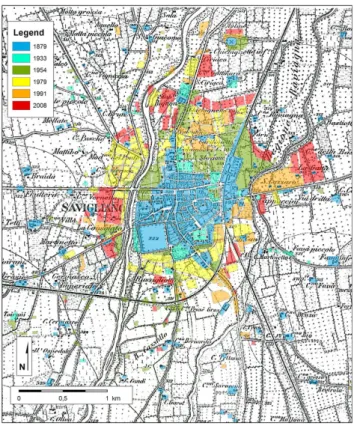
On every map or aerial photograph, boundaries of built-up areas were traced, the main districts were identified, and buildings of social and economical interest were pointed out in the GIS database. The kinds of uses were then classified as: normal buildings (purpose-built apartments and houses), buildings for public services (schools, hospital, railway sta-tion, firehouse, and police) commercial and factory areas, and farm areas. The evolution of the city was thusly doc-umented by steps of about twenty years between each step. Figure 5 illustrates the evolution of the city since 1879. Ta-bles 3 and 4 summarize the built-up areas in Savigliano in square kilometres and percentages, respectively, considering buildings, public utilities, business areas, and farm areas. The percent variation since 1879 and the percent variation
Fig. 5.The built-up area increases since 1879 (editing and area cal-culation were done with GIS). The Maira and Grana-Mellea streams are on left and right side, respectively, in the picture. Background: the Army National Geographic Institute (IGMI) map, 1879 edition.
compared to the previous survey of all the city without cate-gories distinction is illustrated in Table 5.
Flood events of 1896 and 2008 were considered in order to compare the flooded areas. Although the 1896 flood has been considered 3rd level and the 2008 one only 2nd level fol-lowing Govi and Turitto classification (1994, Table 1), they should be deemed comparable because of the important phe-nomena that occurred and the amount of economic damage. Concerning the 1896 flood, a map illustrating the affected ar-eas and related damage together with a detailed description of the flood was found in the Savigliano municipality archive. In the case of the 2008 flood, field surveys were done during and immediately after the flood for the documentation of the affected area, flow direction, and some water level measure-ments. Further data were acquired by some reports (ARPA Piemonte, 2008; Provincia di Cuneo, 2008).
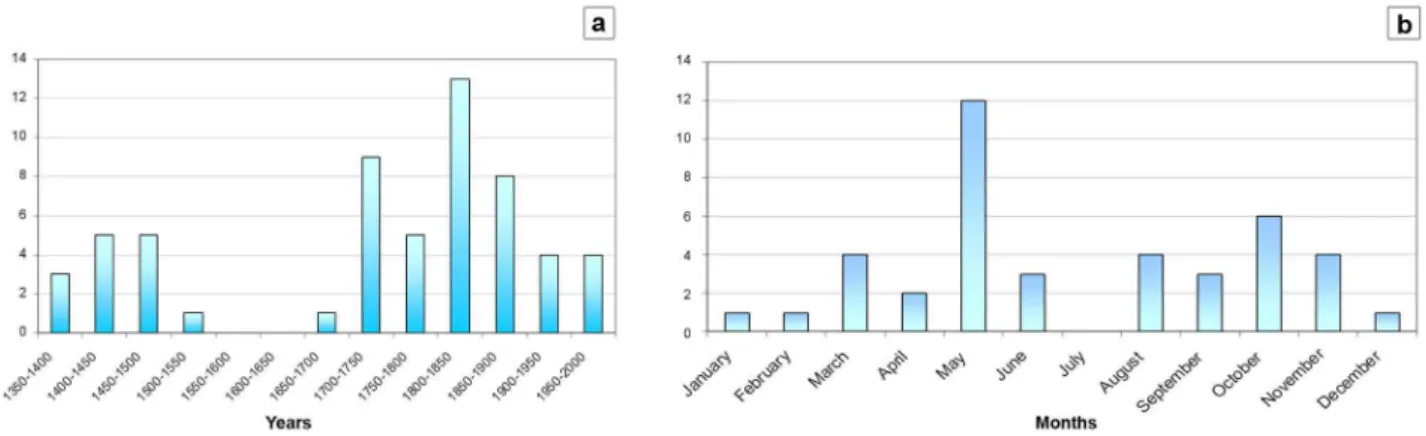
Fig. 6.Flood distribution in the area:(a)according to years (all floods collected) and(b)according to months (when the month is indicated in the source).
Table 3. Categories and built-up areas in the city of Savigliano in each investigated year. In the last column, the total occupied area, in brackets the increased area in square kilometres compared with the previous year. Numbers are in square kilometres and measurements done by GIS.
Year Building Public Business Farm TOTAL utility
1879 0.56 0.21 0.07 0.24 1.28
1933 0.75 0.23 0.09 0.30 1.50 (+0.22)
1954 1.09 0.23 0.25 0.38 2.14 (+0.64)
1979 1.49 0.28 0.30 0.40 2.74 (+0.60)
1991 1.74 0.30 0.53 0.43 3.19 (+0.45)
2008 1.96 0.33 0.80 0.43 3.73 (+0.54)
4 Results and discussion
The analysis of data and discussion focused on five main as-pects: (i) historical span of documents availability; (ii) dis-tribution of the historical floods over seasons; (iii) area af-fected by floods in the city; (iv) the built-up area evolution in the city using maps comparison; and (v) comparison between the floods that occurred in 1896 and 2008.
The collected data display a particular distribution. The lack of events between 1550 and 1650 is probably due to a scarcity of documents (Fig. 6a). The same explanation may also apply for the series of events that happened in 1500–1550 or 1650–1700. Unfortunately, no documentary sources are available in order to complete the sequence. At the same time, the distribution of the floods since 1850 do not show the typical increase due to the correspondent in-crease of documentary sources and availability, as was char-acteristic in the 20th century. An analysis of the monthly-based distribution of floods was also made (Fig. 6b), re-stricted to the events of known date of occurrence. When sharing the flood events out the year, it appears that they are
Table 4.Percent increase of the area occupied by the different cat-egories, comparison with the previous and the first year of analy-sis (in brackets). Measurements were done by GIS. The percent is calculated starting from value in Table 3, for example, considering buildings: (0.75–0.56)/0.56×100.
Year Building Public Business Farm utility
1879 0 (0) 0 (0) 0 (0) 0 (0) 1933 33 (33) 9.5 (9.5) 28.6 (28.6) 25 (25) 1954 45.3 (94.6) 0 (9.5) 177.8 (257) 26.7 (58.3) 1979 36.7 (166) 21.7 (33.3) 20 (328.6) 5.3 (66.7) 1991 13.1 (210.1) 7.1 (42.9) 76.7 (657.1) 7.5 (79.2) 2008 15.7 (250) 10 (57.1) 250.9 (1042.8) 0 (79.2)
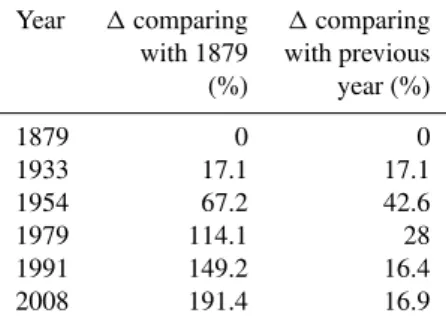
Table 5.Percent increase of the area occupied by the city, compared with the first known situation (second column) and with the previ-ous analysis (third column). Value started from the total column in Table 3 and calculated as: (1.50-1.28)/1.28×100
.
Year 1comparing 1comparing with 1879 with previous
(%) year (%)
1879 0 0
1933 17.1 17.1
1954 67.2 42.6
1979 114.1 28
1991 149.2 16.4
2008 191.4 16.9
by floods during spring and/or early summer (i.e. June 1957, May 1977, June 2000 and May 2002). Usually such floods are related to a Mediterranean low pressure area centered on Corsica and Sardinia or Balearic Island and Spain (Wet-terzentrale: http://www.wetterzentrale.de/, access: 15 Febru-ary 2010 and 6 July 2011). The different sea temperature in spring causes different atmospheric configuration, which brings more and heavy rainfall on Maritime and Cottian Alps (south and south-west of Piedmont – NW Italy). Since the Maira and Grana valleys are located in this part of the Alps, they undergo the low air pressure conditions described above, thus floods are more common in spring. The same holds true for the 2008 May flood. Concerning the 1896 October flood and considering the available baric maps, we may infer that the atmospheric configuration was quite similar, with one of the minimum centered on the Balearic Islands (Spain). Un-fortunately, no comparison can be done on rainfall values.
Through analysis of all the main floods as described in the collected reports and information, the districts in Savigliano which were mainly involved by flooding and consequently flood damage amount to four: Borgo Pieve (south east – 24.0 % of cases), Borgo Marene (east – 20.4 %) and Borgo Suniglia (south – 14.8 %), secondarily Borgo San Giovanni (North – 9.3 %), all identified in Fig. 3. The percent value is calculated referring to the floods as a whole. However, only 68.5 % of floods caused inundation and heavy damage in Savigliano; 31.5 % involved only the countryside and the fields outside the city. So, considering only the flooding in the city areas, the four districts were differently involved: 61.9 % Borgo Pieve, 52.4 % Borgo Marene, 38.1 % Suniglia, and 23.8 % Borgo San Giovanni. Some considerations are as follows. First, in the historic reports for Suniglia and Borgo Pieve, being quite close each other, were sometimes consid-ered together. As a consequence, the south–south east area is more subject to flood. Second, in the historic sequence, dam-age reporting started in different epochs for the four districts. While Borgo Pieve and Borgo San Giovanni began to suffer flood damage in the fifteenth century, similar information in
Borgo Marene first occurs in the nineteenth century. Conse-quently, since 1841, such district appears involved in 65 % of cases of flood and within a shorter lapse of time than others. As we will discuss afterwards, the main reason is the urban evolution of the city. Third, with the exception of the north part of Savigliano (Borgo San Giovanni), since 1896 the main flood events involved at the same time the set-tled areas located to South, South East and East. The 1957 June and 1977 May floods are exceptions, when floodwaters mainly spread over the countryside and the fields. Fourth, since 1896, a crucial point regarding flooding is the railway bridge on the Grana-Mellea Stream. It narrows the flow sec-tion, thus provoking overflow in cases of largest discharge, in concomitance with an artificial channel which brings wa-ter to the ALSTOM plant.
Usually the Maira and Grana-Mellea streams caused ma-jor damages, since the Varaita stream flows 2 km far from Savigliano. Analyzing the distribution of damages in rela-tion to the layout of the city, it is evident that usually the concomitant flood of Maira and Grana-Mellea rivers is the worst combination. However, when the Grana-Mellea is not involved in flood, the Borgo San Giovanni area can much easier undergo flooding.
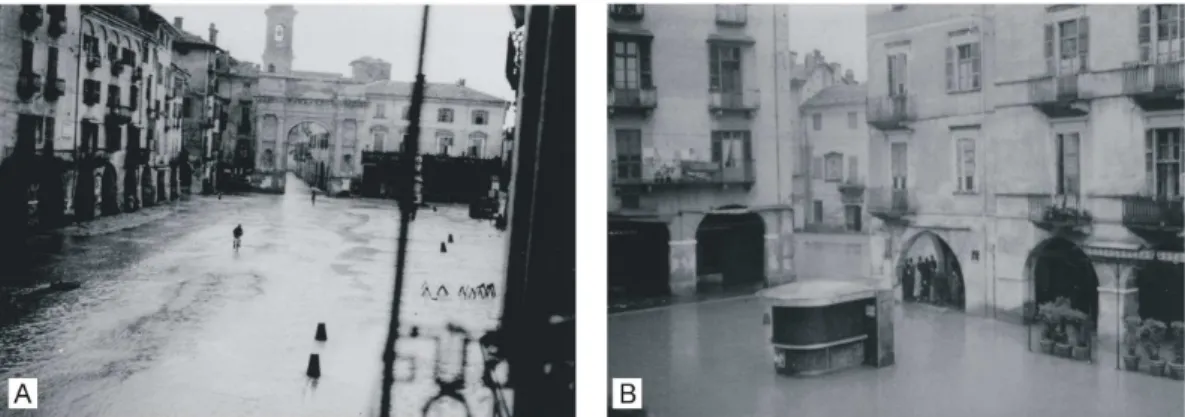
Fig. 7.South(a)and North-West view(b)of Piazza Santarosa in Savigliano historic centre. The square was flooded in May 1949. The red circle in Fig. 3 gives the location of the square.
A last point is the comparison between the 1896 Octo-ber and the 2008 May floods. It is evident from the images (Figs. 2 and 3) that the 1896 flood involved a larger area than 2008. However, we have to consider the reliability of the historic data in spite of some portions of the city having been partially flooded and maybe damaged by a modest quantity of sediment. Some proof of this is given by written docu-ments (Botta, 2005), but not by the maps. However, the in-formation is considered reliable because in minor events (i.e. during May 1949), floodwaters (also due to overflow from the Maira stream) spread up to the city centre as witnessed by some photographs (Fig. 7a and b).
The two floods have some common points and some un-avoidable differences. Both the 1896 and 2008 floods in-volved the Maira and Grana-Mellea streams, but the first caused more damage in 1896, the latter caused more dam-age in 2008. The flood dynamic appears more or less the same for the two occasions: the overflow points (particularly in correspondence of the railway bridge) along the Grana-Mellea were the same in both floods. Being the time lapse between these events is over one hundred years, damages to similar areas proved to be different both in extent and in type. During the 1896 October flood, a lot of bridges were de-stroyed and the city was flooded, but fields and countryside were severely involved, exacting heavy damage to cultiva-tions and breeding. On May 2008, floodwaters also invaded the countryside (as in 1896) but also the more commercial heart of the city. In addition, a lot of problems during the 2008 flood were caused by human influence: artificial chan-nels, roads, and other man-made obstacles influenced both direction and extent of the overflow. One should consider that in 1896 the environmental conditions were more “nat-ural” than today. Owing to the different historical and so-cial context concerning the economical status and the value of money, a comparison would be senseless. Nevertheless, the Savigliano area is an example of what could happen at a global scale with an exponential magnitude of damages, mainly due to the human pressure on the territory.
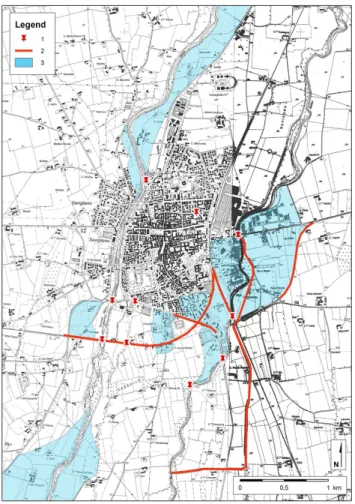
The analysis of the floods cited above, together with all the other floods, allows delimitation and individuation of the urban areas most prone to flood-hazard. Figure 8 refers to these areas, the most frequent points of overflow, and man-made obstacles for possible overflows.
Observing Fig. 8 and the historic analysis, some notes can be drawn:
– the overflow points are all located in the south part of the city;
– the railway bridge on the Grana-Mellea stream, as pointed out above, is the most critical point because it narrows the river;
– the roads and the railways represent a non-natural obsta-cle for the floodwaters: since some of them are elevated, on one hand they can be a protection for the housings, but on the hand a hindering agent for flow back;
– the small channels flowing into the plain and other arti-ficial channels can be dangerous in cases of flood since flood waters use them as fast-track ways, but they are usually too small for draining such high discharges as during the floods considered here;
– along the Maira stream, some bank protections were re-cently built: part of the works ended just before the 2008 flood.
5 Concluding remarks
Fig. 8. The most flood-hazard points and flooding-prone areas around the city. (1) Possible overflow points; (2) non-natural obsta-cle to water flow (roads, railways) and artificial channels; (3) pos-sible flooded area. In the background the Technical regional map 1991 edition.
protections) made over time. The main consideration com-ing out from the analysis of the flood events cited here is that even a minor flood that should happen in the future could ex-act greater damage to the urban, social, economic set up of a given area.
The meteorological studies can individuate for extreme events seasonality, atmospheric configuration, and geograph-ical centre, and so our target area, but they cannot exactly determine the rain effects.
This paper underlines the importance of historical re-search, when assessing forecast on flood dynamics and dam-age, added to the use of modern technologies for data analy-sis (GIS). The analyzed area, although of small extent, repre-sents a landscape where urban settlements watercourses and related floodplain may be referred to as a land use quite com-mon in Italy and all around the world. Sure enough, the stream dynamics need to be investigated from a hydraulic point of view and can be improved. Most importantly, this paper points out the importance of historical analyses for the
individuation of flood-prone areas, hence the need to join the historical-geomorphological and hydraulic studies in order to cope with floods. This does not necessarily mean that it is impossible to build in such areas, but that it is compul-sory to build foreseeing the main problems which may arise in case of flood (i.e. road embankments with adequate open-ings for water passage, prohibiting the use of undergrounds for garages, etc.).
In any case, with the increased awareness of changing climate, basin-scale studies need to be emphasized, start-ing from the important concept that a better knowledge of the past and the landscape mosaic can help us to interpret the present and the future natural events and related conse-quences in an even decreasing human-conditioned territorial situation.
Acknowledgements. We wish to thank Domenico Tropeano and Or-nella Turitto for the careful reading of the manuscript and for their helpful suggestions. Many thanks to Savigliano municipality and library employers for their helpfulness, to the editorial staff of the “Corriere di Savigliano” and “Saviglianese”, for information, data and photos.
The authors would like to thank the three anonymous referees and Fabio Luino as editor for their constructive suggestions to improve the quality of this paper.
Edited by: F. Luino Reviewed by: three referees
References
AA. VV.: Tra Maira e Mellea, Lega per l’ambiente – Savigliano, Officine Grafiche Comunicazione, Bra, Italy, 207 pp., 1992. Arnaud-Fassetta, G., Cossart, E., and Fort, M.: Hydro-geomorphic
hazards and impact of man-made structures during the catas-trophic flood of June 2000 in the Upper Guil catchment (Queyras, Southern French Alps), Geomorphology, 66, 41–67, 2005. ARPA Piemonte: Rapporto finale sull’evento alluvionale del 28–
30 maggio 2008, ARPA Piemonte, Torino, 84 pp., 2008. Audisio, C., Nigrelli, G., and Lollino, G.: A GIS tool for historical
instability processes data entry: an approach to hazard manage-ment in two Italian Alpine river basins, Comput. Geosci., 35, 1735–1747, doi:10.1016/j.cageo.2009.01.012, 2009.
Bardsley, W. E.: Using historical data in nonparametric flood esti-mation, J. Hydrol., 108, 249–255, 1989.
Barredo, J. I.: Major flood disasters in Europe: 1950–2005, Nat. Hazards, 42, 125–148, 2007.
Bayliss, A. C. and Reed, D. W.: The use of historical data in flood frequency estimation. Report to Ministry of Agriculture, Fisheries and Food (MAFF), Centre of Ecology & Hydrology, Wallingford, Oxfordshire, UK, 87 pp., 2001.
Beniston, M.: Mountains Climates and Climatic Change: An Overview of Processes Focusing on the European Alps, Pure Appl. Geophys., 162(8), 1587–1606, 2005.
Benito, G., Lang, M., Barriendos, M., Llasat, M., Franc´es, F., Ouarda, T., Thorndycraft, V. R., Enzel, Y., Bardossy, A., Coeur, D., and Bob´ee, B.: Use of systematic, paleoflood and histori-cal data for the improvement of flood risk estimation, Review of scientific methods, Nat. Hazards, 31, 623–643, 2004.
Biancotti, A.: Rapporti fra morfologia e tettonica nella pianura cuneese, Geogr. Fis. Din. Quat., 2, 51–56, 1979.
Botta, L.: Quattrocento anni di funzioni religiose a Savigliano. As-sociazione Cristoforo Beggiami Publications, Savigliano, Italy, 196 pp., 1988.
Botta, L.: Savigliano citt`a d’acqua: un millennio di convivenza tra fiumi e territorio, Associazione Cristoforo Beggiami Publi-cations, Savigliano, Italy, 189 pp., 2005.
Brath, A., Montanari, A., and Toth, E.: Analysis of the effects of different scenarios of historical data availability on the cali-bration of a spatially-distributed hydrological model, J. Hydrol., 291, 232–253, 2004.
Brookes, A.: Recovery and adjustments of aquatic vegetation within channelization works in England and Wales, J. Environ. Manage., 24, 365–382, 1987.
Burby, R. J.: Flood insurance and floodplain management: the US experience, Environ. Hazards, 3, 111–122, 2001.
Capelli, G., Miccadei, E., and Raffi, R.: Fluvial dynamics in the Castel di Sangro plain: morphological changes and human im-pact from 1875 to 1992, Catena, 30, 295–309, 1997.
Carraro, F., Collo, G., Forno, M. G., Giardino, M., Maraga, F., Perotto, A., and Tropeano, D.: L’evoluzione del reticolato idro-grafico del Piemonte centrale in relazione alla mobilit`a quater-naria, in: Proceedings of Congress “Rapporti Alpi e Appennino e Guida alle escursioni”, Peveragno (CN), Italy, 31 maggio– 1 giugno, edited by: Polino, R. and Sacchi, R., Accademia Nazionale delle Scienze, 445–461, 1994.
Carraro, F., Forno, M.G., Giardino, M., and Paro, L.: Field trip guide. 14th Meeting of the Association of European Geological Societies, 23 September 2005, Torino Hill. Il Quaternario 18(2): 3-55, 2005.
Coeur, D. and Lang, M.: Use of documentary sources on past flood events for flood risk management and land planning, C. R. Geosci., 340, 644–650, 2008.
Copien, C., Frank, C., and Becht, M.: Natural hazards in the Bavar-ian Alps: a historical approach to risk assessment, Nat. Hazards, 45, 173–181, 2008.
Dewan, A. M., Islam, M. M., Kumamoto, T., and Nishigaki, M.: Evaluating flood hazard for land-use planning in greater dhaka of Bangladesh using remote sensing and GIS techniques, Water Resour. Manage., 21, 1601–1612, 2007.
Fern´andez de Villata, M., Benito, G., and D´ıez-Herrero, A.: His-torical flood data analysis using a GIS: the paleotagus database, in: The use of historical data in natural hazards assessments, Ad-vanced in natural and technological hazards research, edited by: Glade, T., Albini, P., and Franc´es, F., Kluwer Academic Publish-ers, Dordrecht, The Netherlands 101–112, 2001.
Gori, P. L. and Burton, W. C.: Debris flow hazards in the Blue Ridge of Virginia, U.S. Geological Survey fact sheet 159-56, 4 pp., 1996.
Glaser, R. and Stangl, H.: Climate and floods in central Europe since ad 1000:data, methods, results and consequences, Surv. Geophys., 25, 485–510, 2004.
Govi, M., Serva, L., and Turitto, O.: La conoscenza delle piene storiche nelle valutazioni di sicurezza e protezione del territorio, Sicurezza e protezione 23–24, 1–13, 1990.
Govi, M. and Turitto, O.: Elementi per la valutazione della peri-colosit`a idrogeologica nei bacini tributari del Fiume Po, Autorit`a di Bacino del Fiume Po “Atlante dei rischi idrogeologici per il bacino del Fiume Po, CNR-IRPI, Internal Report 94/12, Torino, Italy, 230 pp., 1994.
Guzzetti, F., Stark, C. P., and Salvati, P.: Evaluation of flood and landslide risk to the population of Italy, Environ. Manage., 36, 15–36, 2005.
Helms, M., Buchele, B., Merkel, U., and Ihringer, J.: Statistical analysis of the flood situation and assessment of the impact of diking measures along the Elbe (Labe) river, J. Hydrol., 267, 94– 114, 2002.
Hey, R. D.: River engineering and management in the 21st cen-tury, in: Applied fluvial geomorphology for river engineering and management, edited by: Thorne, C. R., Hey, R. D., and Bathrust, M. D., John Wiley and Sons, London, England, 3–11, 1997.
Hilker, N., Badoux, A., and Hegg, C.: The Swiss flood and landslide damage database 1972-2007, Nat. Hazards Earth Syst. Sci., 9, 913–925, doi:10.5194/nhess-9-913-2009, 2009.
Ibsen, M. L. and Brunsden, D.: The nature, use and problems of historical archives for the temporal occurrence of landslides, with specific reference to the South coast of Britain, Ventnor, Isle of Wight, Geomorphology, 15, 241–258, 1996.
Kreibich, H. and Thieken, A. H.: Coping with floods in the city of Dresden, Germany, Nat. Hazards, 51, 423–436, 2009.
Llasat, M., Barriendos, M., Barrera, A., and Rigo, T.: Floods in Catalonia (NE Spain) since 14th century, Climatological and me-teorological aspect from historical documentary sources and old instrumental records, J. Hydrol., 313, 32–47, 2005.
Lollino, G., Allegra, P., Audisio, C., Cristaldi, F., Nigrelli, G., Tro-peano, D., Turconi, L., and Cirincione, M.: Eventi di piena ver-ificatisi lungo le aste fluviali e torrentizie del territorio piemon-tese ed interessanti i centri abitati distribuiti sui fondivalle dei corsi d’acqua principali e loro tributari pi`u importanti, IRPI – Re-gione Piemonte Final Report, Unpublished Report, Torino, Italy, 38 pp., 2003.
Luino, F.: Sequence of instability processes triggered by heavy rain-fall in the northern Italy, Geomorphology, 66, 13–39, 2005. Luino, F. and Turitto, O.: L’analisi storica quale elemento di
indagine per le aree soggette a rischio d’inondazione: il caso di Alba (Italia Nord-Occidentale), in: Proceedings International Conference on Prevention of Hydrogeological Hazards: the role of Scientific Research, Alba, Italy, 289–300, 1996.
Maraga, F.: Aspetti idrografici della Pianura cuneese in relazione alla geomorfologia e alla dinamica fluviale, in: Proceedings of the meetings on “Canali in Provincia di Cuneo”, Bra, Italy, 20– 21 maggio 1989, 21–37, 1989.
Merz, R., Bl¨oschl, G., and Humer, G.: National flood discharge mapping in Austria, Nat. Hazards, 46, 53–72, 2008.
Meunier, M.: La catastrophe du Grand Bornand: crue torrentielle du Borne le 14 julliet 1987, in: Proceedings International Sym-posium Interpraevent 1988, Graz, Austria, 1988, 101–112, 1988. Munich Re Group: Topics Geo Natural catastrophes 2008 Analyses,
Naef, F. and Bezzola, G. R.: Hydrology and morphological con-sequences of the 1987 flood event in the upper Reuss Valley, in: Hydrology in Mountainous Regions II, edited by: Monbaron, M., International Association of Hydrological Sciences (IAHS) Pub-lication No. 194, Wallingford, Oxfordshire, UK, 339–346, 1990. Naulet, R., Lang, M., Ouarda, T. B. M. J., Coeur, D., Bob´ee, B., Recking, A., and Moussay, D.: Flood frequency analysis on the Ard´eche river using French documentary sources from the last two centuries, J. Hydrol., 313, 58–78, 2005.
Nigrelli, G.: Analysis and characteristics of pluviometric events in the Germanasca Valley (Italian Western Alps), Geogr. Fis. Din. Quat., 28(2), 147–158, 2005.
Nigrelli, G. and Audisio, C.: The May 2008 extreme rain event in the Germanasca Valley (Italian Western Alps): processes and ef-fects observed along the hydrographic network and valley slopes, Geogr. Fis. Din. Quat., 32(2), 157–166, 2009.
Provincia di Cuneo – Servizio di Protezione Civile: Evento allu-vionale 29–30 maggio 2008, Provincia di Cuneo, Cuneo, 105 pp., 2008.
Sacco, F.: L’alta valle padana durante l’epoca delle terrazze in re-lazione al contemporaneo sollevamento della circostante catena alpino-appenninica, Atti della Regia Accademia delle Scienze di Torino, XIX, 3–24, 1884.
Spaliviero, M.: Historic fluvial development of the Alpine-foreland Tagliamento River, Italy, and consequences for floodplain man-agement, Geomorphology, 52, 317–333, 2003.
Surian, N. and Rinaldi, M.: Morphological response to river engi-neering and management in alluvial channels in Italy, Geomor-phology, 50, 307–326, 2003.
Sutcliffe, J. V.: The use of historical records in flood frequency analysis, J. Hydrol., 96, 159–171, 1987.
Tropeano, D. and Turconi, L.: Using historical documents for land-slide, debris flow and stream flood prevention. Applications in Northern Italy, Nat. Hazards., 31, 663–679, 2004.
Turletti, C.: Storia di Savigliano, Tipografia Bressa, Savigliano, Italy, 1879.
Yu, F., Chen, Z., Ren, X., and Yang, G.: Analysis of historical floods on the Yangtze River, China: Characteristics and explanations, Geomorphology, 113, 210–213, 2009.