Evaluation of shallow landslide-triggering scenarios through a
physically based approach: an example of application in the
southern Messina area (northeastern Sicily, Italy)
L. Schilirò, C. Esposito, and G. Scarascia Mugnozza
Department of Earth Sciences, Sapienza University of Rome, Rome, Italy Correspondence to:L. Schilirò ([email protected])
Received: 24 March 2015 – Published in Nat. Hazards Earth Syst. Sci. Discuss.: 4 May 2015 Revised: 1 September 2015 – Accepted: 6 September 2015 – Published: 18 September 2015
Abstract. Rainfall-induced shallow landslides are a widespread phenomenon that frequently causes substantial damage to property, as well as numerous casualties. In recent years a wide range of physically based models have been developed to analyze the triggering process of these events. Specifically, in this paper we propose an approach for the evaluation of different shallow landslide-triggering scenarios by means of the TRIGRS (transient rainfall infiltration and grid-based slope stability) numerical model. For the validation of the model, a back analysis of the landslide event that occurred in the study area (located SW of Messina, northeastern Sicily, Italy) on 1 October 2009 was performed, by using different methods and techniques for the definition of the input parameters. After evaluating the reliability of the model through comparison with the 2009 landslide inventory, different triggering scenarios were defined using rainfall values derived from the rainfall probability curves, reconstructed on the basis of daily and hourly historical rainfall data. The results emphasize how these phenomena are likely to occur in the area, given that even short-duration (1–3 h) rainfall events with a relatively low return period (e.g., 10–20 years) can trigger numerous slope failures. Furthermore, for the same rainfall amount, the daily simulations underestimate the instability conditions. The high susceptibility of this area to shallow landslides is testified by the high number of landslide/flood events that have occurred in the past and are summarized in this paper by means of archival research. Considering the main features of the proposed approach, the authors suggest that this methodology could be applied to different areas, even for the development of landslide early warning systems.
1 Introduction
Landslides triggered by rainstorms occur in many parts of the world and cause significant damage and loss to affected peo-ple, organizations and institutions as well as to the environ-ment (Glade, 1997; Nadim et al., 2006; Petley, 2012). Within this category of natural disasters, shallow landslides (in par-ticular debris flows)can pose a serious threat to life or prop-erty, in particular due to their high velocity, impact forces and long runout, combined with poor temporal predictability (Ja-cob and Hungr, 2005). These phenomena consist of sudden mass movements of a mixture of water and granular material that rapidly develop downslope, eroding the soil cover and increasing their original volume (Iovine et al., 2003). Due to their high destructiveness, the study of these processes is an important research topic that can support decision makers in developing more detailed land-use maps and landslide haz-ard mitigation plans.
thresh-olds for the possible occurrence of landslides are defined through the statistical analysis of past rainfall events that have resulted in slope failures, and can be classified on the basis of the geographical extent for which they are deter-mined (i.e., global, national, regional or local thresholds) and the type of rainfall information used to establish the thresh-old (Brunetti et al., 2010).
Nonetheless, the reliability of empirical thresholds is gen-erally affected by quality and availability of the historical data. In fact, adequate historical data on landslides and si-multaneous rainfall are in most cases available only for a relatively short period, which may not be sufficiently sig-nificant from a statistical point of view. Furthermore, rain-fall intensity and duration alone may not be able to capture most of the uncertainty related to landslide triggers (Peres and Cancelliere, 2014). Another drawback of the empirical rainfall thresholds is a general lack of spatial resolution. This aspect cannot be neglected if we consider that the terrain fac-tors which control the onset of instability during a rainfall event can vary spatially to such an extent that, from a the-oretical point of view, the rainfall threshold can be different for each landslide (Lo et al., 2012). Finally, further criticisms are based on the observation that it is not the amount of pre-cipitation but the (largely unknown) amount of water that in-filtrates and moves into the ground, and causes slope failure (Guzzetti et al., 2008).
For this reason, in recent years different models have been developed to define physical (process-based) thresh-olds. Specifically, these models can determine the amount of precipitation needed to trigger slope failures, as well as the location and time of expected landslides, using spatially vari-able characteristics (e.g., slope gradient, soil depth and shear resistance) with a simplified dynamic hydrological model that predicts the pore-pressure response to rainfall infiltration (Montgomery and Dietrich, 1994; Wilson and Wieczorek, 1995; Terlien, 1998; Frattini et al., 2009). These models, al-though they are challenging to apply over large areas where a detailed knowledge of input parameters is very difficult to acquire (Berti et al., 2012), are usually calibrated using rain-fall events for which rainrain-fall measurements and the location and time of slope failures are known.
In this paper we propose an approach based on TRIGRS (Baum et al., 2002), a physically based model that pre-dicts the timing and distribution of shallow, rainfall-induced landslides combining an infinite slope stability calculation with a transient, one-dimensional analytic solution for pore-pressure response to rainfall infiltration. This model has been used in order to define different shallow landslide-triggering scenarios in the study area (located SW of Messina in north-eastern Sicily, Italy) by varying the rainfall input on the ba-sis of the results deriving from the analyba-sis of the historical rainfall data. Prior to this stage, the model was thoroughly validated through the back analysis of the disaster which oc-curred in the same area on 1 October 2009. On that day, a heavy rainstorm triggered several hundreds of shallow
land-slides, causing 37 fatalities and severe damage to buildings and infrastructure (Schilirò and Esposito, 2013). Given the nature of the event, it can be considered particularly repre-sentative of the studied phenomenon and, thus, suitable for testing the reliability of the physically based model.
The paper is organized as follows: after a brief descrip-tion of the study area and the 1 October 2009 event (Sect. 2), a summary of the landslide/flood events that have occurred in the past is reported (Sect. 3). Then, the methods used for the parameterization of the TRIGRS model and the analysis of the historical rainfall data are outlined (Sect. 4). After-wards, the results of the back analysis of the 2009 event and the evaluation of possible future triggering scenarios are pro-vided (Sect. 5) and discussed, along with the main features of the proposed approach (Sect. 6). Finally, in Sect. 7 the main conclusions are summarized.
2 General features of the study area and the 1 October 2009 event
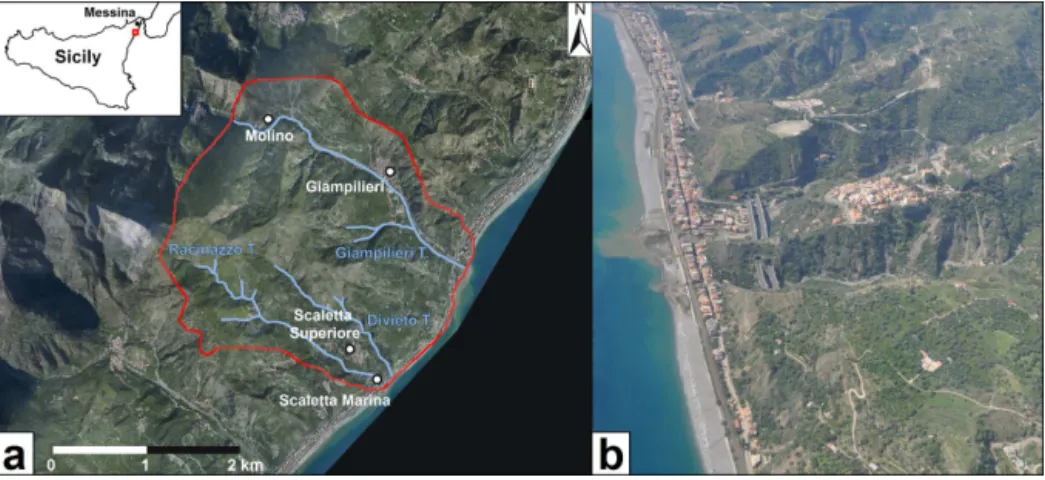
The study area (Fig. 1) is located south of Messina (north-eastern Sicily, Italy) at the NE termination of the Peloritani Mountain Belt, that represents the southern border of the Calabrian–Peloritan arc. This chain is composed of differ-ent metamorphic units (Kabilo Calabride Complex) of pre-alpine age and later involved in Hercynian and Alpine oro-genic processes, and involved in tectonically overlapping the sedimentary Maghrebidian units (Lentini et al., 2000). Since the Late Miocene, the opening of the Tyrrhenian Basin led to the formation of an extensional fault system that involved and re-oriented some of the former structures. These faults, generally oriented NE–SW, have influenced the development of this region during the Pleistocene–Holocene (Antonioli et al., 2003; Di Stefano et al., 2012), resulting in a land-scape characterized by steep slopes eroded by torrent-like straight watercourses, with alluvial conoids and debris flow fans along the valleys. A thin (0.5–2 m) layer of colluvial de-posits or coarse-grained regolith overlays the majority of the slopes, where small outcrops of marine terraces, document-ing the different uplift rates durdocument-ing the Late Pleistocene, can be found. Three orders of terraces can be distinguished at ap-proximately 185, 135 and 95 m a.s.l. (Catalano and De Guidi, 2003), whereas there is no evidence of fluvial terraces. Catch-ments generally have small dimensions and markedly elon-gated shapes, with a short time of concentration and direct discharge into the sea. In particular the study area, which has an extension of about 8 km2and a maximum height of about
Figure 1. (a)Extent of the study area (red line). The upper left sketch shows the location of the area, represented by the red square;(b)aerial view of the Giampilieri area a few days after the 1 October 2009 event.
Figure 2. (a)Cumulative hyetographs recorded at the four rain gauge stations (Santo Stefano di Briga, Fiumedinisi, Antillo and Messina Istituto Geofisico), whose locations are shown in the sketch on the upper left (the red square represents the study area). The shaded areas indicate the landslide timing during the event, on the basis of witness reports: 1 – first landslide events in Giampilieri (17:00–17:15 UTC); 2 – beginning of the most critical stage, with the triggering of hundreds of shallow landslides in Giampilieri and the surrounding areas (18:00 UTC); 3 – landslides in Molino (18:30–18:45 UTC); 4 – end of the landslide events (20:00 UTC);(b)accumulated rainfall between
18:00 and 21:00 UTC, based on radar (satellite) data (from Melfi et al., 2012).
of cumulated rain between 17:00 and 17:10 UTC) for a to-tal of 225 mm of rain falling in just 7 h (i.e., between 14:00 and 21:00 UTC). The analysis of satellite data (Fig. 2b) high-lights the marked localization of the weather system, also confirmed by the low rainfall values recorded in two rain gauge stations approximately 20 km from the study area (An-tillo and Messina Istituto Geofisico monitoring stations, see Fig. 2a). Furthermore, it is worth noting that in the days pre-ceding the event, the area was affected by two intense rain-fall events: one on 16 September and one in the night be-tween 23 September and 24 September. The cumulative rain in this period was approximately 300 mm and thus the total rainfall from 15 September to 1 October amounted to about 500 mm, which is 80 mm higher than the average October–
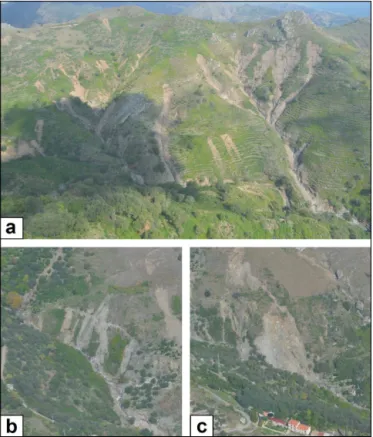
Figure 3.Different types of shallow landslides which occurred on
1 October 2009: (a)debris flows,(b)debris slides and(c)debris
avalanches.
17:15 UTC. Finally, after a further rainfall peak (at approxi-mately 18:00 UTC), many other shallow landslides were trig-gered in Giampilieri and the surrounding areas. In particular, a devastating debris flow suddenly rushed down the Raci-nazzo valley, crushing buildings, infrastructure and killing 14 people in Scaletta Marina. On the other hand, similar events were recorded slightly later in Molino, between ap-proximately 18:30 and 18:45 UTC, due to the storm motion towards the inner areas. Landslide occurrences were reported until 20:00 UTC, after which no remarkable event occurred in the area. However, the experiences reported by witnesses, along with the damage to buildings, both indicate very fast-moving debris flows.
3 Previous flooding and related events
The regional climatic setting of northeastern Sicily is typical Mediterranean, whereby rainfall is concentrated during the wet season (October–April), which is when extreme rainfall events generally occur. However, the local orographic con-trol, coupled with marine effects, can highly influence the occurrence and magnitude of such events. Furthermore, the particular drainage network of the area, characterized by low-order streams with high gradients and short lengths, increases the energy of runoff waters during rainfall events, favoring
the erosion processes and the transport of the loosened mate-rial, even of large dimensions. For these reasons, this part of Sicily has been affected by recurring flood/landslide events in the past. According to the results of archival research, based on the review of technical reports from local author-ities, newspapers, local church archives etc., about 46 land-slide/flood events have occurred since the 17th century, most of which occurred during the autumn–winter period (Fig. 4). In this respect, it is worth mentioning the “quadruple rain-storm” that affected the whole Messina area on 13 Novem-ber 1855, during which more than 100 people lost their lives due to the triggering of countless landslides and widespread flooding (Cuppari, 1856). Extreme rainfall events have also affected this region in recent years; in particular, an event similar to the 1 October 2009 one occurred just 2 years before, on 25 October 2007. On this day, approximately 134 mm of rain fell in the area, and this event also featured extremely high intensity peaks (i.e., 29.1 mm in 10 min). The damage to buildings and infrastructure was remarkable; how-ever, unlike the 1 October event, there were no casualties (Aronica et al., 2008). Heavy rainstorms also hit the area af-ter the 1 October 2009 event, i.e., in the night between 9 and 10 March 2010 and on 1 March 2011. During these events, several landslides were triggered in Scaletta Marina and Gi-ampilieri, convincing the authorities to declare a state of nat-ural disaster for the villages of the southern Messina area. However, even though the increase of recorded events dur-ing the last 20 years also depends on the increasdur-ing number of sources of information, it is important to emphasize that, in the same period, the landslide risk exposure of the area increased substantially due to the enlargement of the urban area as a consequence of poor land-use planning (Del Ven-tisette et al., 2012). Finally, recent studies (Bonaccorso et al., 2005; Arnone et al., 2013) indicate an increasing trend of ex-treme, short-duration rainfall events over the last few decades in Sicily, especially in coastal areas.
4 Methodology
As mentioned above, the approach proposed in this paper consists of two stages:
1. back analysis of the 1 October 2009 event 2. evaluation of different triggering scenarios.
Figure 4. (a)Number of landslide/flood events (red bars) and related fatalities (blue bars) recorded in the southern Messina area per
cen-tury/decade;(b)number of recorded landslide/flood events per month of occurrence;(c)frontispiece of the historical diary of S. Nicolò di Giampilieri church.
Figure 5.Summary of the back analysis process used for the 2009 event.
2015). Therefore, in order to achieve more accurate assess-ment, only the source areas have been used for the compari-son with the numerical simulations. The input parameters of the numerical model (i.e., soil thickness, spatial rainfall rate, hydraulic conditions and geotechnical properties of the collu-vial deposits) have been evaluated by means of lab tests,
em-pirical methods and numerical simulations (Sect. 4.2). In the next step, we used specific rainfall inputs for the reconstruc-tion of different triggering scenarios, whose return periods (RP) have been defined through a statistical analysis of the historical rainfall data available for the study area (Sect. 4.3). 4.1 Theoretical basis of the TRIGRS model
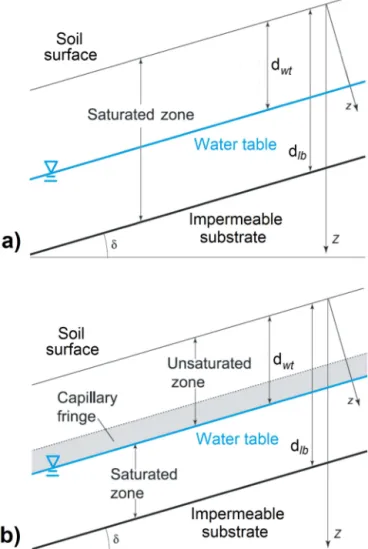
TRIGRS (transient rainfall infiltration and grid-based slope stability model) is a Fortran program designed for modeling the timing and distribution of shallow, rainfall-induced land-slides. It combines a transient, one-dimensional analytic so-lution for pore-pressure response to rainfall infiltration with an infinite slope stability calculation. In the original version (Baum et al., 2002), the infiltration model was based on Iverson’s (2000) linearized solution of Richards’ equation, with implementation of complex storm histories, an imper-meable basal boundary at finite depth and a simple runoff routing scheme (Savage et al., 2003; Salciarini et al., 2006). Introducing a time-varying rainfall input on the ground sur-faceIZ(t), the pressure head response9 (Z,t) can be com-puted using the following input parameters (locally variable throughout the model): slope, soil layer depthdlb, depth of
the initial steady-state water table dwt, long-term
(steady-state) surface flux IZLT and saturated hydraulic
conductiv-ityKs. However, this solution is appropriate for initial
the second version (Baum et al., 2008), the TRIGRS model was expanded to address infiltration into a partially unsatu-rated surface layer above the water table by using an ana-lytical solution of the Richards’ equation for vertical infil-tration (Fig. 6b). TRIGRS uses four hydrodynamic param-eters to linearize the Richards’ equation through the unsat-urated zone, according to the hydraulic model proposed by Gardner (1958): the saturated (θs) and residual (θr) water
content, the saturated hydraulic conductivity (Ks) and a
spe-cific parameter linked to the pore size distribution (αG). If
the amount of infiltrating water reaching the water table ex-ceeds the maximum amount that can be drained by gravity, TRIGRS simulates the water-table rise, comparing the ex-ceeding water quantity to the available pore space directly above the water table or capillary fringe, and then, for each time step, applies the water weight at the initial top of the saturated zone to compute the new pressure head (Baum et al., 2010). For the calculation of the safety factor in the un-saturated configuration, the pressure head is multiplied by the effective stress parameter, as suggested by Vanapalli and Fredlund (2000):
χ=(θ−θr)(θs−θr) , (1) whereθis the soil water content. This approximation has
ap-plication to a generalized effective stress law and represents a simplified form of the suction-stress characteristic curve (Lu and Godt, 2008; Lu et al., 2010). Considering the presence of a thin layer of colluvial deposits over the metamorphic bedrock, in this work we assume a finite depth for the imper-meable basal boundary and initially unsaturated conditions for the regolith.
4.2 Parameterization of the numerical model
In order to define the input parameters of the TRIGRS model, different methods and techniques were used. To estimate the spatial variation of soil thickness, the model proposed by Saulnier et al. (1997) was applied to the study area (Fig. 7a). This model correlates soil depth to the local slope angle ac-cording to the following equation:
hi=hmax
1−
tanα
i−tanαmin tanαmax−tanαmin
1−hmin hmax
, (2)
wherehi is the soil thickness computed at pixeli,hmaxand
hmin are the maximum and minimum soil thickness values
measured in the area,αi is the slope value at pixeli, while αmaxandαminare the maximum and minimum slope values
encountered in the study area. The maximum and minimum values of slope and soil thickness, which were measured within the source areas of the shallow landslides triggered during the 1 October 2009 event, are equal to 58–17◦ and 1.5–0.5 m respectively, and they can be considered reliable since the 2009 landslides mostly involved the entire soil pro-file. Although the model proposed by Saulnier et al. (1997)
Figure 6.Conceptual sketch of the hydrological model in TRIGRS
simulating tension-saturated(a)and unsaturated(b)soil conditions (modified from Baum et al., 2010).
relies heavily on geomorphological simplifications, it is fre-quently used to estimate a spatially distributed soil depth field in basin scale modeling (e.g., Salciarini et al., 2006).
Figure 7. (a)Soil thickness map for the study area;(b)an example of rainfall map resulting from the application of the conditional merging technique: in this case, the cumulative rainfall between 17:00 and 17:15 UTC is reported. Points indicate the location of the six rain gauge stations used in the method (AN: Antillo, CSR: Colle San Rizzo, FDN: Fiumedinisi, GA: Ganzirri, MIG: Messina Istituto Geofisico and SSB: Santo Stefano di Briga).
to improve rainfall estimation (Mair and Fares, 2011). In par-ticular, meteorological satellite radars give a large-scale vi-sion of precipitation fields compared to scattered point es-timates from rainfall gauges. In this study, the precipita-tion rate maps, deriving from the processing of EUMET-SAT (European Organisation for the Exploitation of Mete-orological Satellites) satellite data, were used. These maps, that were made available by the National Center of Aeronau-tical Meteorology and Climatology (CNMCA) of the Ital-ian Air Force, are generated from blending PMW (passive microwave) measurements and IR (infrared) brightness tem-peratures, coupled with the NEFODINA (DYNAmic NEFO-analysis) software, that allows the automatic detection and classification of convective cloud systems, reducing the un-derestimation of precipitation (Mugnai et al., 2013). Ten-minute rainfall records of six stations (Antillo, Colle San Rizzo, Fiumedinisi, Ganzirri, Messina Istituto Geofisico and Santo Stefano di Briga) have been used as input data, after conveniently converting them into 15 min data for the com-parison with the corresponding radar rainfall maps. Thus, se-quential rainfall maps (Fig. 7b) have been obtained for the time period of between 13:00 and 21:00 UTC.
The hydraulic properties of the colluvial deposits, the steady-state water-table depth and the initial soil moisture conditions have been estimated using the HYDRUS 1-D model (Šim˚unek et al., 1998), a USDA (United States De-partment of Agriculture) Salinity Laboratory software pack-age which can simulate the water flow into unsaturated porous media resulting from a rainfall event. The software describes infiltration in the vadose zone using a modified version of Richards’ equation. In this paper, numerical sim-ulations have been performed for the period 1–30 September 2009 in order to quantify the effect of the 1-month antecedent rainfall on soil moisture conditions. The van Genuchten– Mualem model (van Genuchten, 1980) was chosen as a
hy-draulic model to simulate water flow, whereas the hydro-dynamic parameters θs, θr, αG and Ks are predicted from
soil grain size distribution using the ROSETTA Lite module (Schaap et al., 2001). This module uses a database of mea-sured water retention and other properties for a wide variety of media. For a given grain size distribution and other soil properties, the model estimates a retention curve (i.e., the re-lationship between soil water suction9 and the amount of
water remaining in the soilθ) with good statistical
compara-bility to known retention curves of other media with similar physical properties (Nimmo, 2005). Daily rainfall data have been used as input for the model, whereas evapotranspiration is accounted for by inserting the maximum and minimum temperature values recorded during the investigated period into the Hargreaves equation (Jensen et al., 1997). As a lower boundary, a zero-flux condition was assumed due to the pres-ence of impermeable bedrock below the soil cover. A 80 cm soil profile inclined to 38◦ (i.e., the average soil thickness and slope observed within the landslide source areas) was chosen as the most representative geometric configuration of the slope prior to the 1 October event.
Laboratory tests have been performed to measure physi-cal and mechaniphysi-cal properties of the colluvial deposits (Ta-ble 1). The grain size distribution analyses show a soil com-posed mainly of coarse-grained particles (gravel and sand) with minor components of silt and clay. With regard to the mechanical parameters, drained triaxial tests have been con-ducted on three large reconstituted specimens (H=200 mm, D=100 mm). To reconstitute each specimen, the soil was
inves-Table 1. Physical and mechanical properties of the colluvial de-posits.
Physical properties
Unit weight of soil solids (kN m−3) 26.73 Porosity (%) 35
Granulometric characteristics
No. sample 1 2 3
Gravel (%) 58.1 53.9 24.2 Sand (%) 34.9 27.0 52.5
Silt (%) 5.9 14.8 15.3
Clay (%) 1.1 4.4 8.0
Mechanical properties
Friction angle (◦) 30–40 Cohesion (kN m−2) 0–5
tigated soil on the basis of the results of the HYDRUS 1-D model (see Sect. 5.1). For the same material, other authors (Aronica et al., 2012; Peres and Cancelliere, 2014; Penna et al., 2014) reported values which vary between 30◦and 40◦ for the friction angle and between 0 and 5 kN m−2for the co-hesion; thus the resulting internal friction angle (i.e., 36.3◦ ), obtained by assuming a null cohesion, substantially agrees with these values. However, it is important to stress that this difference can depend on both the natural spatial variabil-ity of soil shear strength parameters and the type of deposit, characterized by an extremely variable texture resulting from erosion and weathering areas.
4.3 Analysis of historical rainfall data
In order to depict different shallow landslide-triggering sce-narios in the study area, firstly it is necessary to evaluate the recurrence of specific rainfall events, which can be used as input for the physically based model. Therefore, a statisti-cal analysis of historistatisti-cal rainfall data has been performed. The hydrological–statistical model is based on the analysis of the maximum values assumed by the chosen hydrological variable (i.e., cumulative rainfall at different time intervals). Depending on the type of considered rainfall event (i.e., pro-longed or intense short-duration rainfall), the hydrological variables are identified and then the recurrence of the event can be expressed in terms of return period (RP). In this study the probability model relied on the generalized extreme value (GEV) distribution introduced by Jenkinson (1955). This dis-tribution is a generalized version of the more well-known Gumbel distribution, which is largely used in the study of extreme events. The variables of “cumulative rainfall” (PCn) i.e., in 1, 2, 5, 10, 30, 60, 90, 120 and 180 days are computed
from daily rainfall data by means of the expression
PCn,j= j X
i=j−n+1
Pi,
withn = 1, 2, 5, 10, 30, 60, 90, 120 and 180, and where j is the progressive number of days that form the analyzed
time interval andPiis the rainfall value recorded theith day. The maximum values of each variable are extracted, year by year, from the data sets generated in this way, and the param-eters of the GEV function are determined from the above val-ues, by applying the probability weighted moments (PWM) method introduced by Greenwood et al. (1979) and subse-quently modified by Hosking et al. (1985). Finally, the inver-sion of the probability function yields the values of cumu-lated rainfallx for each of the variables (1, 2, 5, 10. . . 180
days) and for different RPs. Then, these values are interpo-lated with a view to build the rainfall probability curves.
To yield reliable results, this type of analysis requires suf-ficiently long and continuous time series of rainfall data (at least 20 years of recorded data according to Houghton et al., 2001 and Serrano, 2010). For this reason, daily rainfall data were obtained from Santo Stefano di Briga and Messina Is-tituto Geofisico rainfall stations, that have been operational since 1925 and 1952, respectively. However, if we consider that the extreme rainfall events which periodically affect the study area are usually of short duration, as in the case of the 1 October 2009 event, it would be extremely interesting to ana-lyze the historical data of maximum hourly rainfall intensity. Unfortunately, these data are not available for the stations mentioned above. For this reason, hourly rainfall data (i.e., cumulated in 1, 3, 6, 12 and 24 h) were used from Alì Terme station that is located approximately 4 km SE of Fiumedinisi station (see Fig. 12b); thus, this station has been considered sufficiently close to be used to assess the recurrence of the rainfall events recorded in Fiumedinisi station.
5 Results
5.1 Back analysis of the 1 October 2009 event
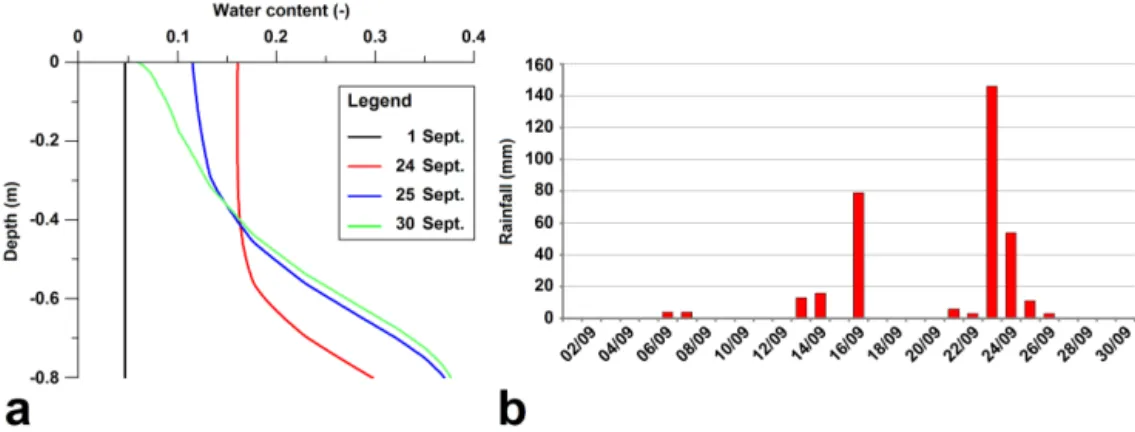
As previously mentioned, before applying the TRIGRS model to back-analyze the 1 October 2009 event, it was necessary to evaluate the soil moisture conditions prior to the event through the HYDRUS 1-D model. According to the simulation results obtained by using the grain size dis-tribution of sample no. 1 (see Table 1), the absence of a steady-state water table within the soil cover can be assumed, whereas in Fig. 8a the resulting volumetric water content trend with depth at four different times (1, 24, 25 and 30 September) is reported. The initial soil moisture (θ=0.047)
the days, due to the advance of the wetting process, resulting in an average value of 0.19 on 30 September, which corre-sponds to a gravimetric water content (w) of approximately
10.8 % and a degree of saturation (Sr) equal to 54.4 % (on the
basis of the physical properties reported in Table 1).
Once the initial soil moisture conditions are estimated, all the input parameters required by TRIGRS can be de-fined (Table 3). A detailed (2×2 m) pre-event digital
ele-vation model (DEM) was used, substantially resampled at the 4×4 m resolution due to limitations on computing time.
Soil thickness (H) and rainfall rate (IZ) vary from cell to cell on the basis of maps obtained through the methods de-scribed in Sect. 4.2. According to the available data, an av-erage friction angle of 35◦ was used, whereas the cohesion was progressively increased to 3 kN m−2, so that only very few cells (i.e., 260, which represent about 0.04 % of all grid cells in the study area) result in instability before the begin-ning of the event. In any case, the chosen value lies within the range of values reported by other authors for the same mate-rial (see Sect. 4.2). The depth-averaged soil unit weight (γn) is equal to 19.22 kN m−3given the porosity (35 %), the de-gree of saturation (54.4 %) and the unit weight of soil solids (26.73 kN m−3), whileθ
s(saturated water content),θr
(resid-ual water content) andKs(saturated hydraulic conductivity)
are directly predicted using the HYDRUS-1D model. Given the absence of an initial water table, its depth (dwt)
corre-sponds in this way to the bedrock–soil interface. To eval-uate the αG parameter, that is typical of the Gardner
hy-draulic model, the conversion formula that was introduced by Ghezzehei et al. (2007) was used, which defines a correspon-dence between Gardner and van Genuchten–Mualem mod-els through the capillary length approach (Warrick, 1995). On the basis of the results of the same simulations, theIZLT
parameter, that represents the long-term background rain-fall rate, was assumed to be equal to the cumulative actual surface flux value (8.49×10⁻⁸m s−1). Finally, the saturated
hydraulic diffusivity (D0) has been calculated according to
D0=(KsH )
Sy , (3)
whereKs is the saturated hydraulic conductivity, H the
av-erage soil thickness (80 cm) andSythe specific yield (Grelle
et al., 2014). If we consider that the investigated soil can be classified as loamy sand, the specific yield is assumed to be equal to 0.34, on the basis of typical values given by John-son (1967) (also reported in Loheide II et al., 2005) for each soil textural class.
With regard to the comparison between the numerical sim-ulations and the landslide inventory map, Table 4 reports, as well as the number and relative percentage (PU) of predicted unstable pixels (i.e., SF≤1), the percentage of correctly
pre-Date θ(−) w(%) Sr(%)
1 Sept 0.047 2.65 13.4 24 Sept 0.182 10.3 52.1 25 Sept 0.194 11.0 55.4 30 Sept 0.19 10.8 54.4
dicted landslide (PL) and stable (PS) pixels between 13:00
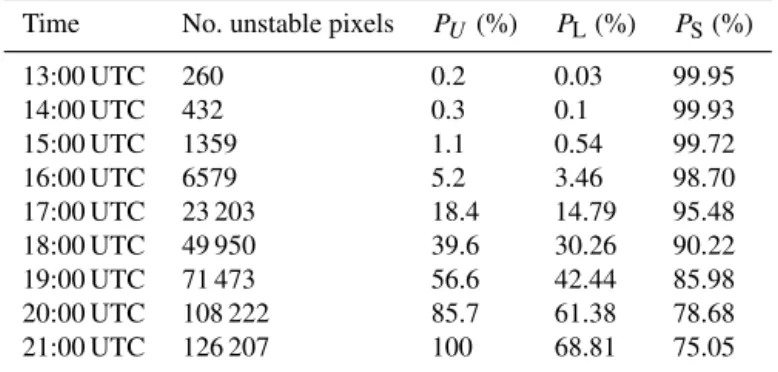
and 21:00 UTC. Figure 9 shows the temporal evolution of slope instability at the catchment scale: only 0.2 % of pix-els are indicated as unstable at 13:00 UTC (beginning of the rainfall event). After a progressive increase in the following 4 h, the instability rapidly rose between 17:00 and 18:00 UTC (PU: +21.2 %) in correspondence of a rainfall peak, and the critical stage continued until 21:00 UTC, given thatPU passed from 39.6 % to 100 % in just 3 h. This temporal evo-lution of the phenomenon substantially agrees with the wit-nesses, although during the real event no particular increase of slope instability has been recorded after 20:00 UTC. To fully evaluate the accuracy of the model, a ROC (receiver op-erating characteristic) curve analysis was performed by com-paring the final SF map (21:00 UTC) with the landslide in-ventory. The ROC curve measures the goodness of the model prediction plotting, for different threshold values, the true positive rate, i.e., the proportion of correctly predicted posi-tive values (“landslide presence”) and the false posiposi-tive rate, i.e., the proportion of negative values (“landslide absence”) erroneously reported as positive. The area under the curve (AUC), which varies from 0.5 (diagonal line) to 1, quantifies the predictive capability of the model.
According to the results, the SF map correctly classifies 68.8 % of source areas (True Positive) and 75.1 % of sta-ble areas (True Negative) with SF=1, whereas the AUC is
sec-Figure 8. (a)Resulting water content trend vs. depth at four different simulation times (1, 24, 25 and 30 September);(b)September 2009
daily rainfall data recorded at the Fiumedinisi rain gauge station.
IZ(m s−1) Rainfall rate Spatial–temporal maps Ehret (2002); Pegram (2003) ϕ′(◦) Friction angle 35 Lab tests and references c′(kN m−2) Cohesion 3 Lab tests and references γn(kN m−3) Soil unit weight 19.22 Lab tests and HYDRUS 1-D θs(−) Saturated water content 0.3831 HYDRUS 1-D
θr(−) Residual water content 0.046 HYDRUS 1-D Ks(m s−1) Saturated hydraulic conductivity 6.6×10⁻⁵ HYDRUS 1-D dwt(m) Initial water table depth H HYDRUS 1-D
αG(m−1) Gardner parameter 11.8 HYDRUS 1-D+Ghezzehei et al. (2007) IZLT(m s−1) Background rainfall rate 8.49
×10−8 HYDRUS 1-D
D0(m2s−1) Hydraulic diffusivity 1.55×10⁻⁴ Johnson (1967); Grelle et al. (2014)
Table 4.Results of the TRIGRS simulation at different times: number and relative percentage of pixels predicted as unstable (PU); percentage of correctly predicted landslide (PL) and stable (PS) pixels.
Time No. unstable pixels PU (%) PL(%) PS(%) 13:00 UTC 260 0.2 0.03 99.95
14:00 UTC 432 0.3 0.1 99.93
15:00 UTC 1359 1.1 0.54 99.72 16:00 UTC 6579 5.2 3.46 98.70 17:00 UTC 23 203 18.4 14.79 95.48 18:00 UTC 49 950 39.6 30.26 90.22 19:00 UTC 71 473 56.6 42.44 85.98 20:00 UTC 108 222 85.7 61.38 78.68 21:00 UTC 126 207 100 68.81 75.05
ond one, the instability peak occurs far too late compared to the real event (approximately at 05:00–06:00 UTC on the fol-lowing day). Furthermore, for sample no. 3 the low value of hydraulic conductivity causes not only an even greater delay of the instability, but also a lower number of unstable pix-els at maximum instability, which develops in a larger time interval (approximately between 09:00 and 13:00 UTC of 2 October). For these reasons, we consider the parameters ob-tained according to the grain size characteristics of sample no. 1 as the most representative of the investigated soil. 5.2 Rainfall probability curves and return period of
the 1 October 2009 event
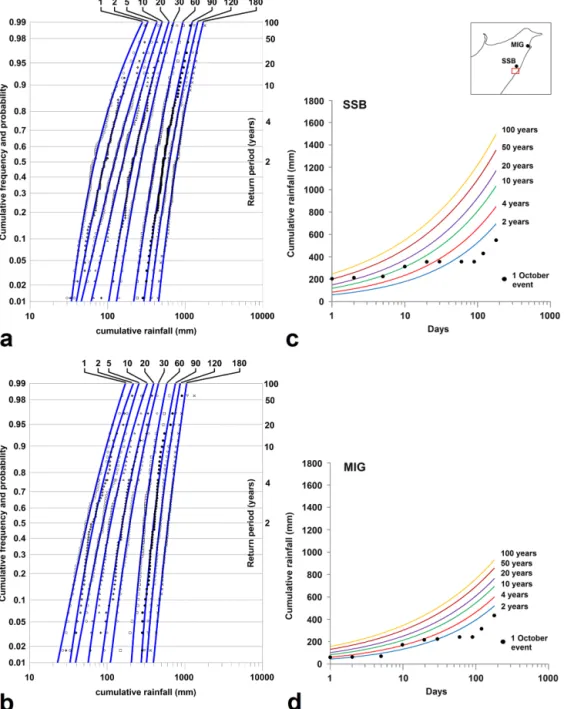
Figure 11a and b show a graphic comparison between cu-mulative frequency (symbols) and GEV probability function (continuous line), obtained by using the daily rainfall records from Santo Stefano di Briga and Messina Istituto Geofisico stations. As it can be observed, the good fitting between data and probability function confirms the reliability of the ap-plied method. With regard to the probability curves (Fig. 11c and d), the comparison reveals that the highest rainfall val-ues are attributed to the Santo Stefano di Briga curves for the same RP. This finding emphasizes that, in the past, this
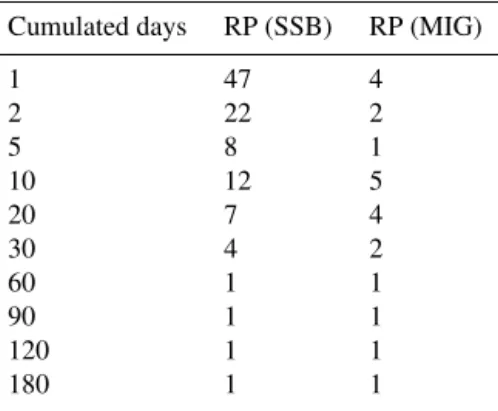
station (the most representative of the sector most severely hit by the 2009 event) has recorded more intense and severe rainfall events than the other one. On the basis of the same curves, the RPs of the rainfall accumulated up to 1 October 2009 have been estimated (Table 6). An estimation has been made also for the rainfall accumulated up to 30 September (i.e., the day prior to the event), but the obtained values in-fer that the rainfall amount, at both stations, is far from ex-ceptional (estimated RP of 1 year); thus, rainfall prior to the event practically lies within the standard range, in contrast with rainfall accumulated up to 1 October. In this case, while rainfall recorded at Messina Istituto Geofisico continues to be unexceptional (estimated RP of 4–5 years), rainfall ac-cumulated in a single day (1 October) at Santo Stefano di Briga has a RP of 47 years. This means that the event un-der study was not only strongly localized in space, but also particularly severe in that specific sector. This finding is also substantiated by what has been previously pointed out, i.e., the highest RPs have been obtained for the station with the highest rainfall probability curves.
Table 5.Parameters derived from HYDRUS 1-D simulations, considering the grain size characteristics of the three soil samples.
Parameter Sample no. 1 Sample no. 2 Sample no. 3
θs(−) Saturated water content 0.3831 0.3872 0.3837 θr(−) Residual water content 0.046 0.039 0.042 Ks(m s−1) Saturated hydraulic conductivity 6.6×10⁻⁵ 1.25×10⁻⁵ 7.91×10⁻⁶ αG(m−1) Gardner parameter 11.8 11.1 12.2 IZLT(m s−1) Background rainfall rate 8.49×10⁻⁸ 5.35×10⁻⁸ 5.37×10⁻⁸ D0(m2s−1) Hydraulic diffusivity 1.55×10⁻⁴ 3.84×10⁻⁵ 2.43×10⁻⁵
Figure 10. (a)ROC curve of the comparison between the TRIGRS final SF map and the 1 October 2009 landslide inventory map;(b)number
of unstable pixels computed by TRIGRS during the event, considering three different grain size distributions of the investigated soil.
Table 6.Estimated return period (RP) in years for rainfall
accumu-lated in the 1, 2, 5, 10, 20, 30, 60, 90, 120 and 180 days prior to 1 October 2009 for Santo Stefano di Briga (SSB) and Messina Istituto Geofisico (MIG) rainfall stations.
Cumulated days RP (SSB) RP (MIG)
1 47 4
2 22 2
5 8 1
10 12 5
20 7 4
30 4 2
60 1 1
90 1 1
120 1 1
180 1 1
probability (Fig. 12a) is not as good as in the preceding anal-yses. However, it is worth stressing that data for intense pre-cipitation are generally scantier than daily values and that the resulting statistical analyses are usually less reliable. The re-sulting rainfall probability curves (Fig. 12b) define a RP of 78 years for the 1 h rainfall recorded on 1 October 2009 in Fiumedinisi station, a value greater than that estimated for the 1-day rainfall recorded at Santo Stefano di Briga station (47 years). Therefore, the 1 h rainfall event can be classified
Table 7.Estimated return period (RP) in years for rainfall
accumu-lated in 1, 3, 6, 12 and 24 h during the 1 October 2009 event.
Cumulated hours RP
1 78
3 26
6 40
12 39
24 19
Figure 11.Cumulative frequency and probability according to GEV distribution for 1, 2, 5, 10, 20, 30, 60, 90, 120 and 180 days of cumulative
rainfall for(a)Santo Stefano di Briga (SSB) and(b)Messina Istituto Geofisico (MIG) stations;(c–d)rainfall probability curves for return periods of 2, 4, 10, 20, 50 and 100 years for the same stations, whose location is shown in the sketch on the upper right (the red square represents the study area).
5.3 Evaluation of different triggering scenarios
Once the physically based model was validated through the back analysis of the 1 October 2009 event, different TRIGRS simulations were performed by varying the rainfall input, on the basis of the rainfall probability curves described above. With regard to the other input parameters of the model, those used for the analysis of the 1 October event have been kept. It is important to note that only hourly simulations have been
Figure 12. (a)Cumulative frequency and probability according to GEV distribution for 1, 3, 6, 12 and 24 h cumulative rainfall for Alì Terme (AT) station;(b)rainfall probability curves for return periods of 2, 4, 10, 20, 50 and 100 years for the same station. The locations of this
station and the Fiumedinisi (FDN) station are shown in the sketch on the upper right (the red square represents the study area).
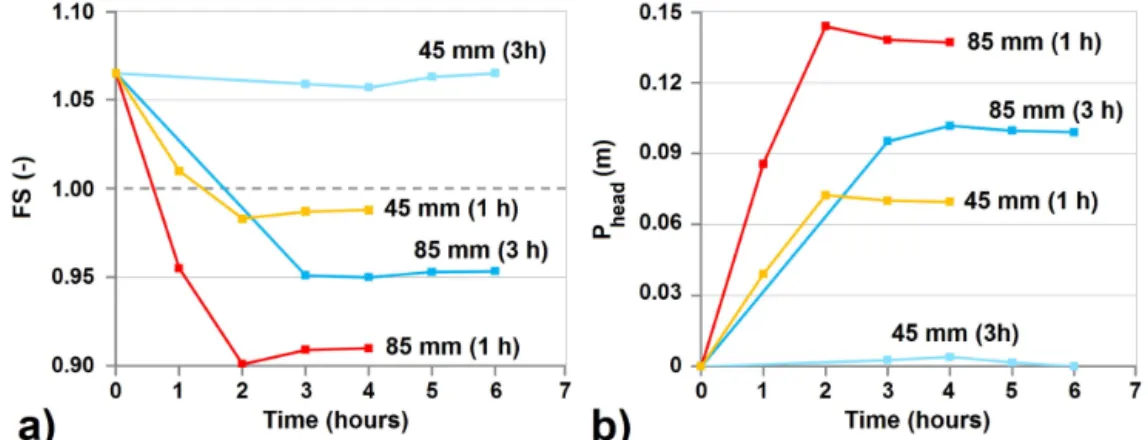
Figure 13. (a)safety factor (SF) vs. time at the selected grid cell of interest for different rainfall scenarios, based on the TRIGRS numerical simulation;(b)Pressure head vs. time at the selected grid cell of interest for different rainfall scenarios, based on the TRIGRS numerical
simulation.
20 years) have been used, in such a way as to evaluate the effect of more frequent rainfall events with respect to the 2009 event. Table 8 shows the number of unstable pixels at the end of the simulated rainfall event and in the next 2 h. In this way, it can be noted that the increase of instability con-tinues up to 1 h after the end of the rainfall, specifically for infiltration rates not less than 15 mm h−1. This aspect can be explained in that water needs a certain time to reach greater depths, so that even the deeper and flatter grid cells may be-come unstable. The results also emphasize the importance, in terms of produced instability, of the 1 and 3 h rainfall amount even for relatively low RPs (i.e., 10–20 years). For instance, 3 h rainfall with a RP of 10 years would cause about half (48.9 %) of the slope instability calculated for the entire 1 October event. In the case of 6 h rainfall, a significant level
of instability develops only for events with RP≥20 years,
Figure 14.Flux diagram describing the proposed approach for the evaluation of shallow landslide-triggering scenarios.
Table 8.Number of unstable pixels predicted by TRIGRS at the end of the simulated rainfall scenarioT(0) and in the next 2 hT(1 h) and T(2 h).P2009represents the percentage of the maximum number of predicted unstable pixels compared to those obtained in the back analysis of the 1 October 2009 event.
Rainfall duration RP (year) Rainfall amount (mm) Rainfall rate (mm h−1) No. unstable pixels P
2009(%)
T (0 h) T (1 h) T (2 h)
1 h
2 30 30 11 605 23 123 21 513 18.3
4 45 45 20 154 38 127 36 904 30.2
10 55 55 24 643 47 790 47 729 37.9
20 65 65 28 578 57 530 56 762 45.6
3 h
2 45 15 8069 8103 6623 6.4
4 60 20 29 632 34 464 32 448 27.3
10 85 28.3 51 268 61 745 59 361 48.9
20 105 35 65 558 82 398 79 865 65.3
6 h
2 55 9.2 5387 4608 4446 4.3
4 70 11.7 5641 4654 4451 4.5
10 95 15.8 35 671 36 053 34 091 28.6
20 120 20 63 992 68 697 65 910 54.4
12 h
2 60 5 4983 4494 4419 3.9
4 85 7.1 5187 4528 4425 4.1
10 110 9.2 5387 4571 4429 4.3
20 130 10.8 5552 4602 4436 4.4
to the greater rainfall rate. Furthermore, also in this analysis the increase of instability occurs in the hour following the event. In this sense, the maximum variations are observed in the 85 mm/1 h rainfall, in which the SF and the pressure head pass from 0.96 to 0.9 and from 0.08 to 0.14 m, respectively. Furthermore, in all the four cases a very slow recovery of the
preceding stability conditions can be noted over the 2 h after the instability peak.
6 Discussion
short-Table 9.Number of unstable pixels predicted by TRIGRS by using the rainfall amounts recorded during the 25 October 2007 and 1 October 2009 event. Data have been computed at the end of the simulated rainfall scenarioT(0) and in the next 2 hT(1 h) andT(2 h).P2009represents the percentage of the maximum number of predicted unstable pixels compared to those obtained in the back analysis of the 1 October 2009 event.
Rainfall duration RP (year) Rainfall amount (mm) Rainfall rate (mm h−1) No. unstable pixels
P2009(%) T (0 h) T (1 h) T (2 h)
1 h 20 (2007)78 (2009) 6585 6585 28 57835 041 57 53078 291 56 76275 913 45.662.0
3 h 26 (2009)30 (2007) 115120 38.340 72 49385 348 92 322106 568 90 391104 704 73.284.4
6 h 28 (2007)40 (2009) 130142 21.723.7 83 70485 777 92 94493 831 90 53290 952 73.674.3
12 h 20 (2007)39 (2009) 130153 10.812.7 55529377 46026938 44366036 4.47.4
duration rainfall events, but also the influence of 1 and 3 h rainstorms on the slope stability conditions, at least in the study area. In this respect, if we observe the characteristics of the 1 October 2009 event, we can distinguish a main phase of approximately 6 h (15:00–21:00 UTC) with a 1 h rainfall peak (17:00–18:00 UTC); thus numerical simulations not ex-ceeding 6 h can be considered to be sufficiently representa-tive of the real phenomenon. However, the results reported in Table 9 indicate that the 3 h sub-event would have pro-duced approximately the same instability of the 6 h rainfall amount (73.2 vs. 74.3 %). This means that the 3-h sub-event alone would have caused almost all landslides, and if we con-sider that this event is characterized by a relatively low re-turn period (26 years), it can be understood how such insta-bility phenomena are likely to occur in this area. The same statements can be inferred by simulating a preceding land-slide event which occurred on 25 October 2007 (Table 9). On the basis of the evidence, this event, comparable to the 2009 event (see Sect. 3) and the 3 h sub-event, and charac-terized by a similar RP (30 years), produces, in fact a similar level of instability (84.4 % of the slope instability calculated for the 2009 event). However, analyzing the event on a 6 h scale, once again a slight underestimation of the entire event is observed, according to the decrease of the percentage of unstable pixels (73.6 %). Although the 1 h rainfall amount is lower in the 2007 case (65 vs. 85 mm), the fact that both 1 and 3 h rainstorms with relatively low RP can cause a sub-stantial instability level emphasizes the severity of recurring rainfall events in the study area and explains the high num-ber of landslide/flood events that have occurred in the past (see Sect. 3). In fact, considering the high values that charac-terize the rainfall probability curves of Alì Terme rain gauge station (see Sect. 5.2), we can assert that short-duration rain-fall events frequently have a high intensity in this specific area. Therefore the combination of recurring and heavy rain-fall events, probably due to specific geomorphological and
climatic features that influence the development of localized severe storms, justifies the approximately 40 landslide/flood events that have occurred since the last century in this area.
velop an early warning system based on rainfall thresholds, identified by the physically based model validated accord-ing to the process described above. In this way, a model in which the initial conditions are constantly updated could de-pict more consistent and reliable triggering scenarios by us-ing any rainfall event forecasted for the next hours.
7 Conclusions
In this study, we introduce an approach for the analysis of shallow landslide-triggering scenarios that uses the TRIGRS code, a physically based model which describes the stability conditions of natural slopes in response to specific rainfall events. As a first step, the model has been validated through the back analysis of a reference landslide event, i.e., the dis-aster that occurred in the southern Messina area on 1 Oc-tober 2009. Comparing the results of the numerical simula-tion with the 2009 landslide inventory, it turns out that the model is able to reproduce the reference event quite well, both in terms of temporal evolution and spatial distribution of slope instability, identifying the areas most affected by shallow landslides. It is worth stressing that the model has been accurately parameterized through different methods and techniques, with specific focus on the evaluation of the spa-tial pattern of the triggering storm and inispa-tial soil moisture conditions.
Once the physically based model has been validated, dif-ferent triggering scenarios have been reconstructed by vary-ing the rainfall input, on the basis of the rainfall probabil-ity curves obtained through a statistical analysis of histor-ical rainfall data. The results indicate that the 1-day simu-lations strongly underestimate the landslide events triggered by extreme but short-duration rainfall events (such as the 1 October one). With regard to the hourly analyses, it results that even recurring (with a RP of 10–20 years) 1 and 3 h rainfall events can lead to significant slope instabilities. This feature confirms the destabilizing effect of recurring rainfall events in the study area, justifying the high number of land-slide/flood events that have occurred in the past. With regards to the proposed approach, the use of different techniques al-lows its application to different case studies, on the basis of the data availability. Furthermore, if we consider the possibil-ity of depicting constantly updated triggering scenarios, this approach could be used to develop specific landslide early warning systems in order to support decision makers in both risk prevention and emergency response.
Acknowledgements. The authors wish to thank an anonymous referee for his/her helpful suggestions and constructive comments, which have contributed greatly in improving the quality of the
Edited by: O. Katz
References
Antonioli, F., Kershaw, S., Rust, D., and Verrubbi, V.: Holocene sea-level change in Sicily and its implications for tectonic models: new data from the Taormina area, northeast Sicily, Mar. Geol., 196, 53–71, doi:10.1016/S0025-3227(03)00029-X, 2003. Arnone, E., Pumo, D., Viola, F., Noto, L. V., and La Loggia, G.:
Rainfall statistics changes in Sicily, Hydrol. Earth Syst. Sci., 17, 2449–2458, doi:10.5194/hess-17-2449-2013, 2013.
Aronica, G. T., Brigandì, G., Marletta, C., and Manfrè, B.: Hydro-logical and hydraulic analysis of the flash flood event on 25 Oc-tober 2007 in North-Eastern part of Sicily, Italy, Proceedings of Floodrisk 2008, Oxford, UK, 2008.
Aronica, G. T., Biondi, G., Brigandì, G., Cascone, E., Lanza, S., and Randazzo G.: Assessment and mapping of debris-flow risk in a small catchment in eastern Sicily through integrated nu-merical simulations and GIS, Phys. Chem. Earth, 49, 52–63, doi:10.1016/j.pce.2012.04.002, 2012.
Baum, R. L. and Godt, J. W.: Early warning of rainfall-induced shal-low landslides and debris fshal-lows in the USA, Landslides, 7, 259– 272, doi:10.1007/s10346-009-0177-0, 2009.
Baum, R. L., Savage, W. Z., and Godt, J. W.: TRIGRS – A Fortran program for transient rainfall infiltration and grid-based regional slope-stability analysis, US Geological Survey, Open-File Report 02-424, 61 pp., 2002.
Baum, R. L., Savage, W. Z., and Godt, J. W.: TRIGRS - A For-tran program for For-transient rainfall infiltration and grid-based re-gional slope-stability analysis, version 2.0, US Geological Sur-vey, Open-File Report 2008-1159, 75 pp., 2008.
Baum, R. L., Godt, J. W., and Savage, W. Z.: Estimating the tim-ing and location of shallow rainfall-induced landslides ustim-ing a model for transient, unsaturated infiltration, J. Geophys. Res., 115, F03013, doi:10.1029/2009JF001321, 2010.
Berti, M., Martina, M. L. V., Franceschini, S., Pignone, S., Simoni, A., and Pizziolo, M.: Probabilistic rainfall thresholds for land-slide occurrence using a Bayesian approach, J. Geophys. Res.-Earth, 117, F04006, doi:10.1029/2012JF002367, 2012. Bonaccorso, B., Cancelliere, A., and Rossi, G.: Detecting trends
of extreme rainfall series in Sicily, Adv. Geosci., 2, 7–11, doi:10.5194/adgeo-2-7-2005, 2005.
Brunetti, M. T., Peruccacci, S., Rossi, M., Luciani, S., Valigi, D., and Guzzetti, F.: Rainfall thresholds for the possible occur-rence of landslides, Nat. Hazards Earth Syst. Sci., 10, 447–458, doi:10.5194/nhess-10-447-2010, 2010.
Caine, N.: The rainfall intensity-duration control of shallow landslides and debris flows, Geogr. Ann. A, 62, 23–27, doi:10.2307/520449, 1980.
Cuppari, P.: Del quadruplice temporale di Messina. Breve cenno, letto dal Prof. Antonio Cuppari nell’Adunanza ordinaria del 1◦ Marzo 1856, Atti della Reale Accademia dei Georgofili di Firenze, 3, 171–187, 1856.
Del Ventisette, C., Garfagnoli, F., Ciampalini, A., Battistini, A., Gigli, G., Moretti, S., and Casagli, N.: An integrated approach to the study of catastrophic debris-flows: geological hazard and human influence, Nat. Hazards Earth Syst. Sci., 12, 2907–2922, doi:10.5194/nhess-12-2907-2012, 2012.
Di Stefano, E., Agate, A., Incarbona, A., Russo, F., Sprovieri, R., and Bonomo, S.: Late Quaternary high uplift rates in northeastern Sicily: evidence from calcareous nannofossils and benthic and planktonic foraminifera, Facies, 58, 1–15, doi:10.1007/s10347-011-0271-3, 2012.
Ehret, U.: Rainfall and flood nowcasting in small catchments using weather radar, PhD thesis, University of Stuttgart, Germany, 262 pp., 2002.
Frattini, P., Crosta, G., and Sosio, R.: Approaches for defining thresholds and return periods for rainfall-triggered shallow land-slides, Hydrol. Process., 23, 1444–1460, doi:10.1002/hyp.7269, 2009.
Gardner, W. R.: Some steady-state solutions of the unsaturated moisture flow equation with application to evaporation from a water table, Soil Sci., 85, 228–232, doi:10.1097/00010694-195804000-00006, 1958.
Ghezzehei, T. A., Kneafsey, T. J., and Su, G. W.: Correspon-dence of the Gardner and van Genuchten-Mualem relative per-meability function parameters, Water Resour. Res., 43, W10417, doi:10.1029/2006WR005339, 2007.
Glade, T.: Establishing the frequency and magnitude of landslide-triggering rainstorm events in New Zealand, Environ. Geol., 35, 160–174, doi:10.1007/s002540050302, 1997.
Greenwood, J. A., Landwehr, J. M., Matalas, N. C., and Wallis, J. R.: Probability weighted moments: definition and relation to parameters of several distribution express-able in inverse form, Water Resour. Res., 15, 1049–1054, doi:10.1029/WR015i005p01049, 1979.
Grelle, G., Soriano, M., Revellino, P., Guerriero, L., Anderson, M. G., Diambra, A., Fiorillo, F., Esposito, L., Diodato, N., and Guadagno, F. M.: Space-time prediction of rainfall-induced shal-low landslides through a combined probabilistic/deterministic approach, optimized for initial water table conditions, B. Eng. Geol. Environ., 73, 877–890, doi:10.1007/s10064-013-0546-8, 2014.
Guzzetti, F., Peruccacci, S., Rossi, M., and Stark, C. P.: Rain-fall thresholds for the initiation of landslides in central and southern Europe, Meteorol. Atmos. Phys., 98, 239–267, doi:10.1007/s00703-007-0262-7, 2007.
Guzzetti, F., Peruccacci, S., Rossi, M., and Stark, C. P.: The rainfall intensity-duration control of shallow landslides and debris flows: an update, Landslides, 5, 3–17, doi:10.1007/s10346-007-0112-1, 2008.
Hawke, R. and McConchie, J.: In situ measurement of soil mois-ture and pore-water pressures in an ‘incipient’ landslide: Lake Tutira, New Zealand, J. Environ. Manage., 92, 266==274, doi:10.1016/j.jenvman.2009.05.035, 2011.
Hosking, J. R. M., Wallis, J. R., and Wood, E. F.: Estimation of the generalized extreme value distribution by the method
of probability weighted moments, Technometrics, 27, 251–261, doi:10.1080/00401706.1985.10488049, 1985.
Houghton, J. T., Ding, Y., Griggs, D. J., Noguers, M., van der Lin-den, P. J., Dai, X., Maskell, K., and Johnson, C. A.: Climate Change 2001: The Scientific Basis. Contribution of Working Group I to the Third Assessment Report of the Intergovernmen-tal Panel on Climate Change, Cambridge University Press, Cam-bridge, UK/New York, USA, 881 pp., 2001.
Hungr, O., Leroueil, S., and Picarelli, L: The Varnes classifica-tion of landslide types, an update, Landslides, 11, 167–194, doi:10.1007/s10346-013-0436-y, 2014.
Iovine, G., Di Gregorio, S., and Lupiano, V.: Debris-flow suscep-tibility assessment through cellular automata modeling: an ex-ample from 15–16 December 1999 disaster at Cervinara and San Martino Valle Caudina (Campania, southern Italy), Nat. Hazards Earth Syst. Sci., 3, 457–468, doi:10.5194/nhess-3-457-2003, 2003.
Iverson, R. M.: Landslide triggering by rain infiltration, Water Re-sour. Res., 36, 1897–1910, doi:10.1029/2000WR900090, 2000. Jacob, M. and Hungr, O.: Debris-flow Hazards and Related
Phe-nomena, Springer-Praxis Publishing Ltd, Chichester, UK, 739 pp., 2005.
Jenkinson, A. F: The frequency distribution of the annual maximum (or minimum) values of meteorological events, Q. J. Roy. Me-teor. Soc., 87, 158–171, doi:10.1002/qj.49708134804, 1955. Jensen, D. T., Hargreaves, G. H., Temesgen, B., and Allen,
R. G.: Computation of ETo under nonideal conditions, J. Ir-rig. Drain. E-Asce, 123, 394–400, doi:10.1061/(ASCE)0733-9437(1997)123:5(394), 1997.
Johnson, A. I.: Specific yield-compilation of specific yields for vari-ous materials, US Geological Survey, Water Supply Paper, 1662-D, 74 pp., 1967.
Lentini, F., Catalano, S., and Carbone, S.: Note illustrative della carta geologica della Provincia di Messina scala 1:50.000 S.EL.CA., Florence, Italy, 19 pp., 2000.
Lo, W. C., Lin, B. S., Ho, H. C., Keck, J., Yin, H. Y., and Shan, H. Y.: A simple and feasible process for using multi-stage high-precision DTMs, field surveys and rainfall data to study debris flow occurrence factors of Shenmu area, Taiwan, Nat. Hazards Earth Syst. Sci., 12, 3407–3419, doi:10.5194/nhess-12-3407-2012, 2012.
Loheide II, S. P., Butler Jr., J. J., and Gorelick, S. M.: Estimation of groundwater consumption by phreatophytes using diurnal wa-ter table fluctuations: a saturated-unsaturated flow assessment, Water Resour. Res., 41, W07030, doi:10.1029/2005WR003942, 2005.
Lu, N. and Godt, J. W.: Infinite-slope stability under steady unsaturated conditions, Water Resour. Res., 44, W11404, doi:10.1029/2008WR006976, 2008.
Lu, N., Godt, J. W., and Wu, D. T.: A closed-form equation for effective stress in unsaturated soil, Water Resour. Res., 46, W05515, doi:10.1029/2009WR008646, 2010.
Mair, A. and Fares, A.: Comparison of rainfall interpola-tion methods in a mountainous region of a tropical island, J. Hydrol. Eng., 16, 371–383, doi:10.1061/(ASCE)HE.1943-5584.0000330, 2011.
EUMET-Res., 30, 1153–1171, doi:10.1029/93WR02979, 1994.
Mugnai, A., Casella, D., Cattani, E., Dietrich, S., Laviola, S., Lev-izzani, V., Panegrossi, G., Petracca, M., Sanò, P., Di Paola, F., Biron, D., De Leonibus, L., Melfi, D., Rosci, P., Vocino, A., Zauli, F., Pagliara, P., Puca, S., Rinollo, A., Milani, L., Porcù, F., and Gattari, F.: Precipitation products from the hy-drology SAF, Nat. Hazards Earth Syst. Sci., 13, 1959–1981, doi:10.5194/nhess-13-1959-2013, 2013.
Nadim, F., Kjekstad, O., Peduzzi, P., Herold, C., and Jaedicke, C.: Global landslide and avalanche hotspots, Landslides, 3, 159–173, doi:10.1007/s10346-006-0036-1, 2006.
Nimmo, J. R.: Unsaturated zone flow processes, in: Encyclopedia of Hydrological Sciences: part 13 Groundwater, edited by: An-derson, M. G. and Bear, J., Wiley, Chichester, UK, 2299–2322, 2005.
Pegram, G.: Spatial interpolation and mapping of rainfall (SIMAR) – Volume 3: Data merging for rainfall map production, Water Resource Commission Report no. 1153/1/04, 2003.
Penna, D., Borga, M., Aronica, G. T., Brigandì, G., and Tarolli, P.: The influence of grid resolution on the prediction of natural and road-related shallow landslides, Hydrol. Earth Syst. Sci., 18, 2127–2139, doi:10.5194/hess-18-2127-2014, 2014.
Peres, D. J. and Cancelliere, A.: Derivation and evaluation of land-slide triggering thresholds by a Monte Carlo approach, Hy-drol. Earth Syst. Sci., 18, 4913–4931, doi:10.5194/hess-18-4913-2014, 2014.
Petley, D. N.: Global patterns of loss of life from landslides, Geol-ogy, 40, 927–930, doi:10.1130/G33217.1, 2012.
Ray, R. L. and Jacobs, J. M.: Relationships among remotely soil moisture, precipitation and landslide events, Nat. Hazards, 43, 211–222, doi:10.1007/s11069-006-9095-9, 2007.
Ray, R. L., Jacobs, J. M., and Cosh, M. H.: Landslide susceptibility mapping using downscaled AMSR-E soil moisture: A case study from Cleveland Corral, California, US, Remote Sens. Environ., 114, 2624–2636, doi:10.1016/j.rse.2010.05.033, 2010.
Reichenbach, P., Cardinali, M., De Vita, P., and Guzzetti, F.: Re-gional hydrological thresholds for landslides and floods in the Tiber River Basin (central Italy), Environ. Geol., 35, 146–159, doi:10.1007/s002540050301, 1998.
Salciarini, D., Godt, J. W., Savage, W. Z., Conversini, P., and Baum, R. L.: Modeling regional initiation of rainfall-induced shallow landslides in the eastern Umbria Region of central Italy, Land-slides, 3, 181–194, doi:10.1007/s10346-006-0037-0, 2006. Saulnier, G. M., Beven, K., and Obled, C.: Including spatially
vari-able effective soil depths in TOPMODEL, J. Hydrol., 202, 158– 172, doi:10.1016/S0022-1694(97)00059-0, 1997.
Savage, W. Z., Godt, J. W., and Baum, R. L.: A model for spatially and temporally distributed shallow landslide initiation by rainfall infiltration, in: Debris-Flow Hazards Mitigation: Mechanics, Pre-diction and Assessment, edited by: Rickenmann, D. and Chen, C. L., Millpress, Rotterdam, The Netherlands, 179–187, 2003.
Schilirò, L. and Esposito, C.: Susceptibility assessment and trig-gering scenarios for shallow landslides in the southern Messina province (north-eastern Sicily, Italy) using statistic-probabilistic and deterministic approaches, Rendiconti online della Società Geologica Italiana, 24, 298–300, 2013.
Schilirò, L., De Blasio, F. V., Esposito, C., and Scarascia Mugnozza, G.: Reconstruction of a destructive debris-flow event via numer-ical modeling: the role of valley geometry on flow dynamics, Earth Surf. Process., doi:10.1002/esp.3762, in press, 2015. Serrano, S. E.: Hydrology for Engineers, Geologists, and
Environ-mental Professionals: An Integrated Treatment of Surface, Sub-surface, and Contaminant Hydrology, Second Edition, Hydro-science Inc., USA, 590 pp., 2010.
Šim˚unek, J., Huang, M., Šejna, M., and van Genuchten, M. Th.: The HYDRUS-1D software package for simulating the one-dimensional movement of water, heat, and multiple solutes in variably-saturated media. Version 1.0, International Ground Wa-ter Modeling CenWa-ter, Colorado School of Mines, Golden, Col-orado, 186 pp., 1998.
Terlien, M. T. J.: The determination of statistical and deterministic hydrological landslide-triggering thresholds, Environ. Geol., 35, 124–130, doi:10.1007/s002540050299, 1998.
Trigila, A., Iadanza, C., Esposito, C., and Scarascia Mug-nozza, G.: Comparison of Logistic Regression and Random Forests techniques for shallow landslide susceptibility as-sessment in Giampilieri (NE Sicily, Italy), Geomorphology, doi:10.1016/j.geomorph.2015.06.001, in press, 2015.
Vanapalli, S. K., and Fredlund, D. G.: Comparison of different pro-cedures to predict unsaturated soil shear strength, in: Advances in Unsaturated Geotechnics, edited by: Shackelford, C. D., Hous-ton, S. L., and Chang, N. Y., Society of Civil Engineers, 2000. van Genuchten, M. Th.: A closed-form equation for predicting the
hydraulic conductivity of unsaturated soils, Soil Sci. Soc. Am. J., 44, 892–898, doi:10.2136/sssaj1980.03615995004400050002x, 1980.
Warrick, A. W.: Correspondence of hydraulic functions for unsaturated soils, Soil Sci. Soc. Am. J., 59, 292–299, doi:10.2136/sssaj1995.03615995005900020003x, 1995. Wieczorek, G. F. and Glade, T.: Climatic factors influencing
oc-currence of debris flows, in: Debris-flow Hazards and Related Phenomena, edited by: Jacob, M. and Hungr, O., Springer-Praxis Publishing Ltd, Chichester, UK, 325-362, 2005.