Georg Bergmann1*, Alwina Bender1, Friedmar Graichen1, Jo¨rn Dymke1, Antonius Rohlmann1, Adam Trepczynski1, Markus O. Heller2, Ines Kutzner1
1Julius Wolff Institute, Charite´ – Universita¨tsmedizin Berlin, Berlin, Germany,2Engineering Science Unit, University of Southampton, Highfield, Southampton, Great Britain
Abstract
The loads acting in knee joints must be known for improving joint replacement, surgical procedures, physiotherapy, biomechanical computer simulations, and to advise patients with osteoarthritis or fractures about what activities to avoid. Such data would also allow verification of test standards for knee implants. This work analyzes data from 8 subjects with instrumented knee implants, which allowed measuring the contact forces and moments acting in the joint. The implants were powered inductively and the loads transmitted at radio frequency. The time courses of forces and moments during walking, stair climbing, and 6 more activities were averaged for subjects with I) average body weight and average load levels and II) high body weight and high load levels. During all investigated activities except jogging, the high force levels reached 3,372–4,218N. During slow jogging, they were up to 5,165N. The peak torque around the implant stem during walking was 10.5 Nm, which was higher than during all other activities including jogging. The transverse forces and the moments varied greatly between the subjects, especially during non-cyclic activities. The high load levels measured were mostly above those defined in the wear test ISO 14243. The loads defined in the ISO test standard should be adapted to the levels reported here. The new data will allow realistic investigations and improvements of joint replacement, surgical procedures for tendon repair, treatment of fractures, and others. Computer models of the load conditions in the lower extremities will become more realistic if the new data is used as a gold standard. However, due to the extreme individual variations of some load components, even the reported average load profiles can most likely not explain every failure of an implant or a surgical procedure.
Citation:Bergmann G, Bender A, Graichen F, Dymke J, Rohlmann A, et al. (2014) Standardized Loads Acting in Knee Implants. PLoS ONE 9(1): e86035. doi:10.1371/journal.pone.0086035
Editor:Bart O. Williams, Van Andel Institute, United States of America
ReceivedAugust 21, 2013;AcceptedDecember 4, 2013;PublishedJanuary 23, 2014
Copyright:ß2014 Bergmann et al. This is an open-access article distributed under the terms of the Creative Commons Attribution License, which permits unrestricted use, distribution, and reproduction in any medium, provided the original author and source are credited.
Funding:This work was supported by Deutsche Forschungsgemeinschaft (Be 804/18) (http://www.dfg.de/en/index.jsp), Deutsche Arthrose-Hilfe e.V. (http:// www.arthrose.de/), and Zimmer GmbH (http://www.zimmer.com/en-US/index.jspx). The funders had no role in study design, data collection and analysis, decision to publish, or preparation of the manuscript.
Competing Interests:The authors have declared that no competing interests exist. * E-mail: [email protected]
Introduction
Why are standard loads needed?
Knowledge of contact forces and moments acting in the tibio-femoral joint is needed for testing wear, fatigue, or strength of implants, for analyses of strain distribution and remodeling at the fixation area, and for other purposes. Reliable data can also serve as a ‘gold standard’ for the verification of analytical musculo-skeletal models. Realistic finite element models of natural knee joints including the surrounding soft tissues permit the calculation of the mechanical situation in structures such as cartilage, ligaments, or menisci, for example in cases of injuries, or permit the investigation of the biomechanical consequences of surgical interventions.
Loading of the knee joint primarily depends on the physical activity. It is also determined by body weight (BW), but individually differs greatly, even between subjects with the same BW [1]. This raises the question of which loads are appropriate to use for mechanical tests or analyses. For wear and fatigue those activities are most decisive which cause very high loads and additionally act most frequently. For static strength and fixation stability, even rarely acting extreme loads may additionally be important.
One could determine the load-time patterns during the most strenuous and frequent activities of daily living (ADL) as they act on average in subjects with an average body weight. These activities are walking and climbing stairs [2]. However, the median loads will then be higher in 50% of subjects and 50% of loading cycles, and this would not be adequate for use in strength or wear tests. A more justified approach would be to take data from subjects with a high BW and joint loads which are, relative to the BW, higher than in most other subjects. However, this may cause other problems because such high loads could lead to failures of small implants.
Calculation of knee contact loads
Measurement of knee contact loads
Instrumented implants allow access to the joint contact forcesin vivo. In previous studies, forces were measured in a distal femur replacement and transformed to the knee joint [11–13]. Peak axial forces of 220–250%BW were reported for level walking and 280%BW for descending stairs.
To measure the tibio-femoral contact force directly, instru-mented knee implants were also developed by others. An initial design measured the axial force and the center of pressure [14], and a second design enabled the measurement of all six force and moment components [15]. Load data was reported for 1–3 subjects. During walking, forces between 180 and 280%BW were measured [16]. With respect to daily activities, the highest forces, approximately 350%BW, occurred during stair ascending and descending [17]. During all investigated activities, the shear forces were substantially lower than the axial forces [18]. Peak anterior shear forces of 30%BW were observed during walking.
The instrumented knee implant, developed by us, measures the tibio-femoral contact forces and moments in vivo [19]. The electronics in the tibial component are powered inductively and transmit the six load components telemetrically at radio frequency with a measuring error below 2%. During the measurements, the patient’s activities are video-taped and recorded together with the loads. Additionally, gait data can also be captured. Synchronous load and video data from many activities can be accessed from the free public database www.OrthoLoad.com, including selected data from this study.
The instrumented implant is based on the INNEX knee (Zimmer GmbH, Winterthur, Switzerland), has an ultracongruent tibial insert, and requires sacrificing the cruciate ligaments. It therefore also transfers load components which are taken up by the ligaments in cruciate ligament retaining implants or in the natural knee. If such implants or the native joint are to be tested or analyzed, they have to be modeled by finite elements and compared to models of the instrumented implant, applying the same loads. This would allow separating the fractions of loads transferred by the soft tissues and by the tibial-femoral contact areas.
Wear test standard ISO 14243
The test standard ISO 14243-1 [20] defines loads for testing wear in knee implants. The axial force, a/p force, and rotation torque can be compared to the load components Fz, Fy, and Mz now measuredin vivo. ISO only describes the loads during walking. They were obtained 43 to 25 years ago from analytical musculo-skeletal models and gait data [3,9] and were edited for the test purpose in 2000 [21]. Because the mathematical modeling has much advanced since then, it can be expected that the newin vivo
data deviate from the ISO loads. This expectation is supported by a comparison of the axial ISO force with the resultant forces during walking, obtained analytically as well as measured in our patients [22]. During the first 60% of the stance phase both loads differed markedly.
Goals of this study
The goal of this study was to standardize forces and moments acting in knee implants, based onin vivodata. These loads should be suitable as a realistic basis for experimental or analytical studies on wear, fatigue, strength, fixation stability, bone remodeling, or soft tissue loading around the implant. Different classes of loads should be defined as: average loads, high loads, and extreme loads of single force or moment components. Furthermore, the loads defined in the wear test standard ISO 14243 should be compared to the measured values. Based on previous measurements, we
hypothesized that the ISO loads are much lower than the measured loads.
Methods
Ethics Statement
The study was approved by the Charite´ Ethics committee (EA4/069/06) and registered at the ‘German Clinical Trials Register’ (DRKS00000606). All patients gave written informed consent prior to participating in this study.
Coordinate system and measured loads
The coordinate system used is fixed relative to a right-sided implant. Its origin is located in the middle of the tibial plateau at the height of the lowest part of the polyethylene insert [1]. The positive force components Fx and Fyact in lateral and anterior directions, respectively. The axial force component is reported here as -Fz(with a negative sign) and always acts distally in the direction of theimplant shaft. Positive moments Mx, My, and Mz turn clockwise around their axes during flexion, abduction, and outer rotation of the tibia, respectively. Positive values of Mx/My can be caused not only by frictional torque but also by a posterior/ lateral shift of the axial force -Fz. The resultant force Fresand the resultant moment Mres are calculated from their respective components.
If load components have to be transformed from the implant-based system, used here, to a tibia-implant-based system, the slope of the implants must be respected (Table 1). Relative to the long axis of the tibia, the implants are rotated backwards (positively) around the x-axis by the listed slope angles.
In the following sections, the terms ‘‘peak’’ force, ‘‘peak’’ component, etc. denote absolute or relative minima or maxima and can be positive or negative. The term ‘‘load’’ either indicates a force, a moment, or a combination of force and moment.
Measurements
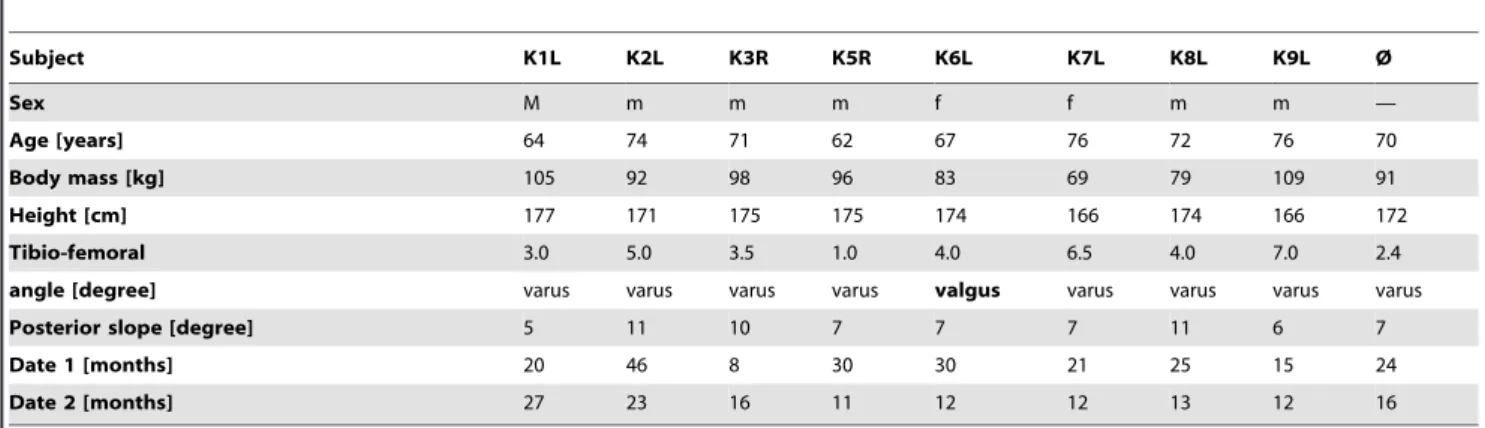
8 subjects with instrumented knee implants participated in this study (Table 1). All subjects obtained the implant due to gonarthrosis and had regained good walking abilities at the time the measurements were taken.
Measurements during 7 ADL were performed at 2 postoper-ative dates (Table 2). The step height of the staircase was 20 cm and the seat height was 45 cm (50 cm for subject K6 L). The subjects walked at a self-selected speed of approximately 4 km/h. Data from jogging at 6 km/h on a treadmill were also collected in the 3 subjects willing to perform this exercise. The jogging data does not allow statistic evaluations, but can serve as a basis for judgment of the severity of the loads during the ADL. Kinematic data was synchronously recorded by 12 cameras (Vicon, Oxford, UK) on the first postoperative date only (Table 1). More trials from the second postoperative date were added to broaden the data basis when searching for the trials with the absolute highest extreme values of Fres (PEAK100, see below) or of single components (EXTREME100).
Average and high body weight
An average and a high BW were defined, based on data from large studies conducted on the American [23] and German [24] populations. The given BWs of subjects between 60 and 69 years of age were averaged between the females and males of both studies. The average BW was 74.7 kg and 2.3% of the population had a BW above 101.5 kg. For our study, we defined an average BW of 75 kg and a high BW of 100 kg.
The 3 force and 3 moment components were measured in %BW and %BWm (percent of body weight times meter), respectively. These loads were multiplied by 7.36 (9.81 * 75/ 100) to convert them to N and Nm, respectively, for subjects with an average BW and by 9.81 for those with a high BW. If average/ high loads in subjects with a BW of X kg instead of 75/100 kg need to be known, the data given in N or Nm must be multiplied by X/75 or X/100, respectively.
Basic averaging method
The basic averaging procedure combined n loading cycles (Table 2). Averaging started on the resultant force Fres using the following ‘time warping’ procedure [25] (the software can be downloaded from www.OrthoLoad.com). First, all n cycle
durations were standardized to ‘100% cycle’ and an average cycle time Tcwas determined. Then, the time scales of all of the cycles were deformed non-uniformly in such a way that the squared differences between all of the n time-deformed functions of Fres, summed over the whole cycle time, became a minimum. The obtained deformation of the time scale of each single cycle is called its ‘warping path’. The arithmetic mean pattern of Freswas finally calculated from the deformed patterns of all of the cycles and named the ‘average’ pattern. This method minimizes the sum of the squared differences of Fresbetween the cycles evenly over the whole cycle time and preserves the typical characteristics of the analyzed patterns as their extreme values. If, for example, a relative force maximum occurs in only 50% of the n cycles, but at strongly varying times, half of its average height will be present at an average time in the final curve.
Determination of the warping paths by analysis of Fres was chosen because the characteristics of all 3 force components, as relative extrema, and their locations within the loading cycles are inherent in the force-time pattern of Fres.
The warping path of each cycle, obtained by the described analysis of Fres, was then applied to the belonging 6 load components so that they maintained their synchronization. From the time-deformed components of the n cycles, their arithmetic mean patterns were calculated. This averaging process was performed on load data which had been normalized to each subject’s individual body weight.
Average loads ‘AVER75’ for subjects with average body weight
The resultant forces Fres from several loading cycles of each subject were first averaged intra-individually (curves S1 to S3 in Figure 1A). The cycles obtained from the 8 subjects were then averaged inter-individually in %BW (curve Sa with the peak value P1 in Figure 1A) and the obtained loads were finally re-calculated for a BW of 75 kg by multiplication with 7.36 (9.81*75/100; curve with the peak value P4 in Figure 1B). This procedure delivered the force pattern AVER75, which represents the average force in subjects with a BW of 75 kg. Identical procedures were applied to all force and moment components.
High loads HIGH100 for subjects with high body weight The AVER75 pattern (curve with the peak value P4 in Figure 1B) was multiplied by 1.33 * FH. The factor 1.33 increased the BW to the high value of 100 kg. The additional factor FHwas the quotient between the highest intra-individual average found in
Table 1.Investigated subjects and postoperative measuring time.
Subject K1L K2L K3R K5R K6L K7L K8L K9L Ø
Sex M m m m f f m m —
Age [years] 64 74 71 62 67 76 72 76 70
Body mass [kg] 105 92 98 96 83 69 79 109 91
Height [cm] 177 171 175 175 174 166 174 166 172
Tibio-femoral 3.0 5.0 3.5 1.0 4.0 6.5 4.0 7.0 2.4
angle [degree] varus varus varus varus valgus varus varus varus varus
Posterior slope [degree] 5 11 10 7 7 7 11 6 7
Date 1 [months] 20 46 8 30 30 21 25 15 24
Date 2 [months] 27 23 16 11 12 12 13 12 16
doi:10.1371/journal.pone.0086035.t001
Table 2.Investigated activities, numbers of evaluated cycles per subject, average cycle times, and conversion factors Caver and Cpeak.
Date 1 Date 2 Cycle
Time Caver Cpeak
Activity Cycles Cycles Tc [s] [1] [1]
Walking 12–21 18–64 1.07 0.58 1.06
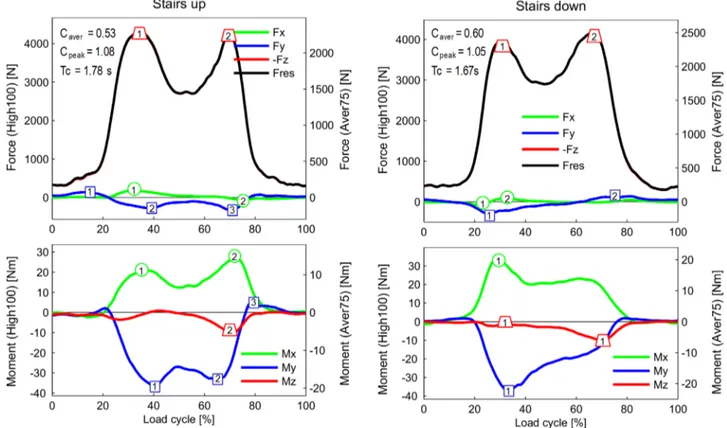
Ascending stairs 4–7 8–17 1.78 0.53 1.08 Descending stairs 4–9 8–17 1.67 0.60 1.05
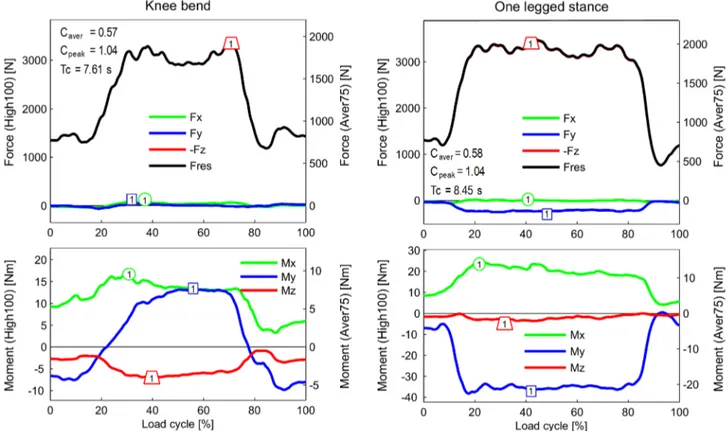
Knee bend 3–7 4–7 7.61 0.57 1.04
Standing up 4–6 4–9 2.68 0.54 1.02
Sitting down 4–6 4–8 3.56 0.54 1.09
One-legged stance 3–6 4–9 8.45 0.58 1.04 Jogging, 6 km/h on a
treadmill
- 13–20 0.68 0.57 1.07
Multiplication of the HIGH100 loads with the conversion factor Caverdelivers the
AVER75 loads. Multiplication of the HIGH100 loads with Cpeakdelivers the PEAK100
loads. Tcfrom date 2.
any of the subjects (P2 in Figure 1A) and the inter-individual average of all of the subjects (P1 in Figure 1A). The obtained HIGH100 loads can act in subjects with a BW of 100 kg (e.g. in 1 out of 8 subjects in our study). All factors were applied in the same way on all load components in the AVER75 data.
The HIGH100 loads actedon averagein 1 out of 8 investigated subjects. This indicates that such high loads are common in reality. Therefore presentation and discussion of the loads is focused on the HIGH100 loads. The AVER75 pattern can be obtained from the HIGH100 pattern by multiplication with the factor Caver. A low Caver value indicates a high variation in Fres between the investigated subjects. A Cavervalue of 50%, for example, would indicate that, for the same activity, the peak value of Fresin one of the investigated subjects was twice as high as the average of all investigated subjects.
Peak loads ‘PEAK100’ for subjects with high body weight In the AVER75 patterns of Fres, obtained from all the investigated subjects and all the loading cycles, that single trial was identified (T3 in Figure 1A) which had the absolute highest peak value P3. The load components from this trial were multiplied by 1.33 * FP(Figure 1B). FPwas the quotient between the highest peak value of any trial (P3 in Figure 1A) and the inter-individual average of all subjects (P1 in Figure 1A). The obtained pattern was named ‘PEAK100’ and represents the absolute highest force Fresthat could act during occasional trials in subjects with a BW of 100 kg. A high factor Cpeakbetween the HIGH100 and the PEAK100 loads indicates that the variation of the HIGH100 loads from trial to trial is large.
Extreme load components ‘EXTREME100’ for subjects with high body weight
The procedures described above, used to define the standard-ized average, high and peak loads, solely depend on the analysis of the resultant force Fres and its peak values. Therefore, all load components in the AVER75/PEAK100 data only differ by the factors Caver/Cpeakfrom the same components in the HIGH100 data. This means that the load directions during the whole loading cycle are the same for each of the 3 load levels. When testing wear or strength of implants, the load directions in addition to the load magnitudes influence the results. A smaller force can be more detrimental than a higher force when it acts in a different direction, for example.
The peak values of some components vary intra-individually much more than Fres. This indicates that the resultant force and/ or moment acts in directions which can deviate greatly from the directions determined by the average components. Such effects cannot be detected when only analyzing the average force and moment components. Therefore, selected relative minima maxima in the time courses of the 6 load components were specified and their lowest/highest values were determined from the data of all subjects and all single trials. Included in this analysis were the data generated from both measurement sessions (Table 2), to increase the number of evaluated trials. The obtained values were named the ‘EXTREME100’ load components. Extreme values of single components may be suited for analyzing the mechanical reasons of
untypical implant failures due to loosening, excessive wear, breakage or other factors.
Knee flexion angle
The 3D kinematics of each subject’s lower limbs were measured using reflective markers attached to the skin and tracked at 120 Hz using a 12-camera motion capture system (Vicon, Oxford, UK). The marker set consisted of 46 markers placed on the subjects’ legs and pelvis [26]. The method used for determining the skeletal kinematics has been described in detail previously [27].
The same warping paths, obtained when averaging the resultant force Fres from single cycles or subjects, were applied to the synchronously measured knee flexion angle. The obtained flexion-time patterns are valid for all standardized loads (AVER75, HIGH100, and PEAK100).
Results
All values of the load components and their resultants, stated in the following sections, refer to the HIGH100 loads. The HIGH100 data, collected during the different activities, are charted in the diagrams of Figures 2 to 5 with the left scales. Additional right scales allow reading the AVER75 data from the same diagrams. The Caver and Cpeak values, required for Figure 1. Determination of average, high, and peak forces.
Schematic illustration with fictive data from 3 subjects.Top (A):S1 to S3 = intra-individual averages in %BW. Curve with P1 = inter-individual average of S1 to S3. Curve with P2 = highest intra-individual average of any of the subjects. FH= multiplication factor between P2 and P1 for calculation of HIGH100 from AVER75 values. T1 to T3 = 3 single trials with highest peak values. Curve with P3 = trial with the highest peak value ever measured. FP= multiplication factor between P3 and P1 for calculation of PEAK100 from AVER75 values.Bottom (B):curve Sa (in %BW!) from the top diagram. Curve with P4 =AVER75= average load in N for the BW = 75 kg. Curve with P5 =HIGH100= high force in N for the BW = 100 kg. Curve with P6 =PEAK100= peak force in N for the BW = 100 kg. FH and FP= factors for calculation of HIGH100 and PEAK100 values from AVER75 values. Caver and Cpeak= multiplication factors for calculation of AVER75 and PEAK100 values from HIGH100 values.
calculation of the AVER75 and PEAK100 loads from the HIGH100 loads, are listed in Table 2 and indicated in Figures 2 to 5. Table 2 also lists the average cycle times Tcfrom the data collected at the second postoperative date.
Resultant force Fresand axial force component –Fz(upper diagrams in Figures 2 to 5)
Because the negative axial component –Fzalways nearly equals Fres, the data and findings forFrescan approximately be transferred to –Fz. When comparing the highest forces from all investigated activities except jogging, it becomes obvious that their peak values are very close together, encompassing a range of 3,372–4,218N (Figure 6).
During walking and ascending or descending stairs, Fresalways had two maxima during each loading cycle. During walking, the second peak, which occurred at the instant of contralateral heel strike (3,372N), was larger than the first peak, at the instant of contralateral toe off (2,848N). During ascending or descending stairs, both peaks were higher than the peaks that occurred during walking. Their magnitudes had all similar values between 3,718 and 4,218N. During the one-legged stance, Fresreached a height similar to that of the second peak during walking.
The peaks of Fres during exercises with 2-leg support did not deviate much from the peaks that occurred when only one leg temporarily supported the whole BW. Rising from a chair with a maximum knee flexion angle (KF) of 94uor sitting down (94uKF) caused nearly the same peak values (3,792 and 3,697N, respectively). During the knee bend exercise, the peak was lower
(3,407N) than the peak that occurred during the rising from a chair exercise, although the knee was flexed slightly more (98u
KF).
During jogging, only one force maximum was observed. The peak force of 5,165N was 53% higher than the maximum force which acted during walking.
When the AVER75 forces Fres were expressed in %BW, we obtained 226/267%BW for the 1./2. peak during walking, 311/ 305%BW (1./2. peak) when ascending stairs, and 280%BW (maximum) when rising from a chair. The forces Fzhad nearly the same values.
Transverse forces Fxand Fy(upper diagrams in Figures 2 to 5)
The medial-lateral force Fx was small during all investigated activities. Except for jogging, the forces in the medial direction (Fx,0) were always smaller than 100N. Force values higher than 100N in the lateral direction (Fx.0) were only observed when ascending stairs (167N) or jogging (246N).
The peak values of the anterior-posterior force Fywere always larger than those of Fx. During walking, ascending and descending stairs, as well as during the one-legged stance, peak values of Fy nearly always acted in the posterior direction (Fy,0). With a range of2255N to2326N, the peak values had similar magnitudes for all 4 activities. The highest force recorded in the posterior direction was2699N and occurred during jogging.
The forces recorded in the anterior direction (Fy.0) were generally much smaller than those acting in the posterior Figure 2. Forces and moments during walking and jogging.Left scales = high loads HIGH100. Right scales = average loads AVER75. Top diagrams = force components and resultant force. Bottom diagrams = moment components. Symbols with numbers = peak values for which the ranges of the ‘EXTREME100’ are listed in Table 3. Caver= factor used to convert all HIGH100 load components to AVER75 components. Cpeak= factor used to convert all HIGH100 load components to PEAK100 components. Tc = average cycle time. Data averaged for 8 subjects and all trials. Jogging data from only 3 subjects. Because –Fzis nearly identical to Fres, the curve of –Fzis mostly invisible.
Figure 3. Forces and moments during ascending and descending stairs.For explanations, see Figure 2. doi:10.1371/journal.pone.0086035.g003
direction. Forces between 102N and 137N were recorded during walking and during ascending or descending stairs. The highest values, up to 189N, were measured during jogging. Although the flexion angles during knee bends and when sitting down or standing up were higher than during the other activities (Figure 6), the positive forces Fystayed very low and did not exceed 94N. Alternating directions of Fywithin the same loading cycle and values above 100N were only found during walking, climbing stairs, and jogging.
When expressed in %BW instead of N, the peak shear forces Fz of the AVER75 data were 232/+15%BW (1./2. peak) during walking, +14/254%BW (1./2. peak) during climbing stairs and 219/+10%BW (minimum/maximum) during the chair rise exercise.
Torsional moment Mz(lower diagrams in Figures 2 to 5) High Mz values, due to an outwards rotation of the tibia (Mz.0), were only found during walking at the instant of contralateral toe off. Throughout the entire loading cycle of all of the other activities, Mz was close to zero or negative, even during jogging. The tibia then rotates or tries to rotate inwards. During all activities except the one-legged stance, the peak values of Mz were between27.0 and210.5 Nm. The largest negative torque was measured during walking at the instant of contralateral heel strike, and it was even higher than the torque measured during jogging. Walking was the only activity during which a moment Mz of non-negligible magnitude acted in alternating directions.
Transverse moments Mxand My(lower diagrams in Figures 2 to 5)
Although the knee movement changes between flexion and extension during all activities except standing, the moment Mxin the sagittal plane was always positive or close to zero. Small, negative values were recorded shortly before heel strike during jogging only. Positive values of Mxduring extension phases cannot be caused by friction, but are the result of a posterior shift of -Fz. This shift causes a moment that counteracts and exceeds the friction moment. The positive patterns of Mx in the extension phases therefore indicate that such a posterior shift of the axial force occurs during all activities. Except for descending stairs, the peak values of Mxlay between 17 and 27 Nm. If friction around the x-axis is neglected, this corresponds to backwards shifts of -Fz by about 5 to 10 mm. If friction is realistically taken into account, the shift would be even larger. While descending stairs, the highest peak values (34 Nm) were measured.
While ascending or descending stairs and during the one-legged stance, the abduction moment My was negative throughout the whole loading cycle or at least most parts of it. This negative moment indicates an adduction of the tibiaora medial shift of -Fz. The magnitudes of Mywere close to -40 Nm, corresponding to a shift of -Fzof approximately 10 mm if friction is neglected. Small, positive values of Mywere found during the extension phases of walking and jogging, but the highest magnitudes of Mywere then also negative, with values of 238 and 247 Nm, respectively. Alternating directions of Mywere measured during knee bends and when standing up or sitting down. When standing up, Mywas 2.7 times higher than when sitting down.
Figure 5. Forces and moments during knee bend and one-legged stance.Diagrams start and end with two-legged stance. For more explanations, see Figure 2.
AVER75 and PEAK100 loads (Table 2)
The multiplication factors Caveror Cpeakhave to be applied to the HIGH100 loads to obtain the AVER75 or PEAK100 data. The AVER75 loads are much smaller than the HIGH100 loads. Depending on the activity, the AVER75 load values are only 53– 60% of the HIGH100 loads. This indicates that the loads vary strongly inter-individually. The values of Cpeakwere between 1.02 and 1.09, i.e., the PEAK100 loads are no more than 9% higher than the HIGH100 loads.
Inter-individual variations of load patterns (Figure 7) Only examples of the variation of the load components between the investigated subjects can be given here. Data from all activities and subjects is accessible from www.OrthoLoad.com (menu Test Loads).
The time courses of Fz (and therefore also of Fres) from the different subjects were relatively uniform for all activities, but there were large differences observed in the magnitudes. This difference in magnitudes can also be seen indirectly from the low values of Caver(Table 2). For the cyclic activities of walking and jogging, the patterns of all of the components except Fx were relatively uniform. For all other activities, the time courses of Fx, Fy, and, to a lesser extent, the components Mx and My were extremely different between the subjects. The most pronounced
inter-individual variations were found during the non-cyclic activities: standing, knee bends, and ascending and descending stairs.
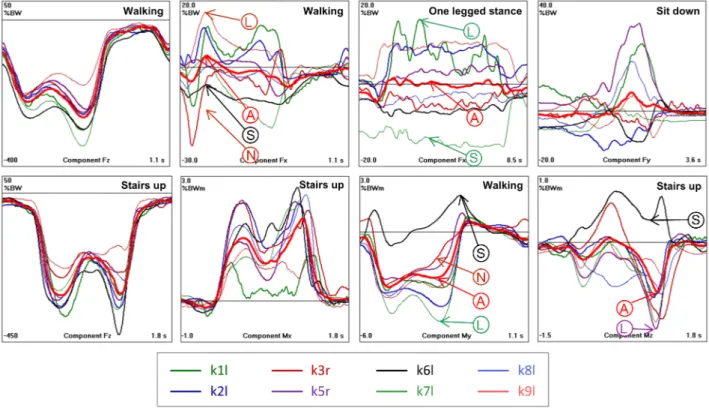
Extreme load components EXTREME100 (Table 3) Selected peak values of all load components were analyzed with respect to their extreme magnitudes, using data from all trials, all subjects, and from the two postoperative measurement sessions. The selected extrema are indicated and numbered in Figures 2 to 5. Because of the described inter-individual variations in the load patterns, the ranges of the selected peak values were sometimes difficult to determine (Figure 7). The average of a certain peak value (‘‘A’’ in Figure 7) can be positive or negative. But in some subjects, the same peak value had an opposite sign (‘‘S’’ in Figure 7), or did not even exist in others (‘‘N’’ in Figure 7). These cases were excluded in the determination of the extreme peak values. The highest values of the relative maxima and the lowest values of the relative minima (‘‘L’’ in Figure 7) are listed in Table 3. The inter-individual variations of single load components can be estimated by comparing their ranges with the peak values indicated on the component curves in Figures 2 to 5. Three examples are given here: A) peak ‘‘2’’ of Fx during walking (Figure 2) had an average value of 45N, but an EXTREME100 value of 292N was measured in subject K1L (Table 3); B) peak ‘‘3’’ of Myduring walking (Figure 2) had an average value of 7.3 Nm, but had an EXTREME100 value of 27.3 Nm in subject K8L ; C) peak ‘2’ of Fyduring ascending stairs (Figure 3) had an average Figure 6. Comparison of measured load components and knee flexion angle with wear test standard. Average time courses of measured HIGH100 load components –Fz, Fy, Mz, and knee flexion angle during all investigated activities and comparison with ISO 14243 wear test standard.
doi:10.1371/journal.pone.0086035.g006
Figure 7. Load components with modest and strong inter-individual variations.Numbers are in %BW and %BWm (before normalization of the body weight to 75 kg to obtain the AVER75 loads). Thin lines = individual averages from 8 subjects. Thick lines = averages from all subjects. Top diagrams = force components. Bottom diagrams = moment components. Left 2 diagrams = similar patterns in all subjects. Right 6 diagrams: individually very different time courses. Even the signs of the highest extrema can differ. For further explanation, see the text.
value of2276N, but had an EXTREME100 value of2679N in subject K1L.
Deviations of a factor of 5 or more were frequently observed between the average and individual peak values, especially in the transverse force and moment components.
Comparison of ISO loads with standardized loads In Figure 6, the 3 load components defined by the ISO standard 14243 for wear tests are compared with the same components in the measured HIGH100 data from all activities.
Comparison of ISO loads with data from walking The ISO loads were defined to simulate walking. However, nearly all extrema in the time courses of the ISO components were smaller than the HIGH100 values. The 1stsmall maximum in the ISO course of the axial force –Fzwas lacking in reality. The 2nd ISO maximum was only 9% smaller than the measured maximum, but the 3rd maximum was 39% smaller. For the anterior force Fy, the first ISO peak was lacking againin vivo, the 2ndISO peak was 158% smaller, but the 3rdISO peak was 43% larger than measuredin vivo. The largest differences between the ISO standard and the values measured in this study were determined for the torsional moment Mz. The 1stISO peak value was 287% smaller and the 2ndISO peak was 82% smaller thanin vivo.
Comparison of ISO loads with data from other activities A direct comparison between the mechanical effect of the ISO standard loads and the measured in vivo HIGH100 loads is not possible because the peaks of the ISO components act at flexion angles that are different than the flexion angles measured during the activities investigated in this study (Figure 6, bottom). Thein vivomaxima of -Fzwere determined to be much higher than the ISO maxima during all investigated activities. For the 1-legged
stance, knee bend, standing up and sitting down activities, the measured -Fzmaxima were 31–46% larger than the ISO maxima. During ascending or descending stairs, the measured peaks were 60–65% greater than the ISO peaks, and during jogging, the measured maxima were 97% greater than the ISO maxima.
The measured forces in the anterior direction (Fy.0) were larger than the 2nd ISO maximum only during jogging (
+7%). Posterior forces (-Fy,0) that were larger than in the ISO standard were found during ascending (+196%) or descending (+163%) stairs, the one-legged stance (+132%), and jogging (+535%).
Except for walking, only during jogging did the measured torsional moment Mzhave a higher maximum (+100%) than the ISO standard. The absolute values of the minima of Mz were higher in the measured in vivo values compared with the ISO values during standing up (+30%), sitting down (+28%), knee bends (+17%) and jogging (+53%).
Discussion
Limitations of the study
Even though the joint loads were collected from the largest group of subjects with instrumented knee implants currently available, the data would be different if more subjects were included in the study. In particular, the HIGH100 and PEAK100 loads would certainly increase. Deviating load levels can also be expected to occur in younger or very old subjects. Although the literature shows that in 2002 only 2.3% of people had a BW higher than 100 kg, this percentage may grow in the future. If that is the case, the loads reported here may even be exceeded.
Comparison with previous data
The only in vivo knee loads of other authors which can be compared with our data were measured with two different instrumented tibial trays [14,15]. In studies with 1–3 subjects axial forces of 180–280%BW were measured during walking, 250–
Table 3.EXTREME100 forces [N] and moments [Nm].
Component D Walking Ascending Stairs Descending Stairs OL stance Stand. up Sitting down Knee bend Jogging
Fres 1 3110 4209 4787 3676 3870 4036 3608 5551
2 3581 4572 4348 - - - -
-Fx 1 2294 307 2416 222 257 301 318 2423
2 292 2283 308 - - - - 697
3 2209 - - -
-Fy 1 2605 220 2565 2557 2266 392 324 21148
2 221 2679 368 - - - -
-3 - 2438 - - -
--Fz 1 3100 4169 4776 3667 3867 4033 3605 5396
2 3571 4552 4347 - - - -
-Mx 1 25.9 30.5 59.1 38.7 21.4 28.6 46.1 39.8
2 32.2 36.0 - - -
-My 1 250.2 248.8 268.8 257.3 25.1 22.8 23.3 257.1
2 253.2 255.1 - - -
-3 27.3 37.2 - - -
-Mz 1 12.0 10.5 218.5 213.3 211.4 210.8 213.9 213.7
2 218.9 213.9 - - -
-The numbers#= 1, 2, and 3 of the extrema are indicated in Figures 2–5.
260%BW during chair rise, 250–300%BW when ascending and approximately 350%BW when descending stairs [16–18,28,29]. Peak anterior shear forces of 30%BW during walking, 26%BW during stair climbing, 17%BW during chair rise, and 15%BW during squatting were previously reported from one subject [18]. The peak AVER75 values which we determined for Fresand Fy are in the same range as the values determined in these previous studies. However, the large individual variation of Fz which we found (www.OrthoLoad.com, menu Test Loads) could not have been determined in these publications, so no further comparisons could be made.
Our actual data slightly deviate from previous own measure-ments in only 5 of the subjects, taken at an earlier postoperative time [1]. Previously the average resultant forces were by 23% (walking), +8% (going up stairs), 20.5% (going down stairs), 211% (standing up),28% (sitting down), and23% (knee bends) different from the current AVER75 results. To prove whether the total force had indeed increased with the postoperative time during most activities, an analysis of the same sub-group would be required.
Adaptation of reported loads to test conditions
In joint simulators, cyclic loads which must start and end at the same values and should have the same slope are applied. Due to the time warping procedure, used to average single load cycles, these requirements are not perfectly met in this study. Therefore, curve fitting procedures must be applied to connect the last and first parts of the loading cycles reported here. Because their start and end values do not deviate much, 2 or 3% of the cycle durations may be appropriate for these transitions. The loads during standing up and sitting down may be combined to achieve cyclic loads.
Which loads for which test or analysis?
Our study shows large differences between measured loads, which can act in patients with a high body weight, and those defined in the ISO standard. Differences between this standard and analytically determined loads during walking have also been reported by others [22,30,31].
Some structural failures of knee implants and delamination of polyethylene, which occur in vivo, cannot be replicated by simulator tests [32]. When the ISO loads were replaced by a profile containing only 10% walking cycles, but 80% of cycles of ascending and descending stairs, plus cycles from chair raising and deep squatting, wear in an unicompartmental implant rose four times [33]. When neglecting either Fyor Mzin ISO tests, the wear rate dropped by 90% [34]. This indicates that wear would greatly increase if these components were higher. Under loads acting during activities of daily living, conventional polyethylene inlays had 30% higher wear rates than under ISO loads. If loads under high flexion were applied, the wear rate grew by 168% [31]. Such observations indicate that tests and analyses of replaced and natural knees should not be performed under pure walking conditions as defined by the ISO 14243 standard. Instead, more realistic loads from walking should be chosen and other activities should be included, especially those requiring high flexion angles. A more strenuous loading profile has also been proposed by others [32,35]. In light of these observations, the ISO wear test standard is presently discussed and will be modified in the future.
For testing or analyzing knee implants, the HIGH100 loads presented here (with fitted start and end intervals) should be chosen. For investigating problems of the static strength of the implant, its bony fixation, or of the surrounding soft tissues, the PEAK100 loads should be applied instead, but these are only 2–
9% larger than the HIGH100 values. Small implants might not be able to withstand such high loads, and it could be discussed whether they are better tested at lower load levels.
Replacement of single HIGH100 components by extreme EXTREME100 components
Except for the time courses of the HIGH100 loads, the most important finding of this study is the strong inter-individual load variation, especially of the transverse force components (Figure 7 and extended data from www.OrthoLoad.com). Due to the extreme variations of some load components, even the reported HIGH100 loads will most likely not suffice to explain every case of implant damage or failure of a surgical procedure. Overloading of polyethylene or of soft tissues, such as cruciate ligaments, may greatly depend on the magnitude of a single load component such as the a/p force Fy. As shown here, these components can be much higher than in the time courses given by the HIGH100 data. If a single component is suspected to cause a certain failure or contribute to it, it could be increased so that its peak value(s) corresponds to the EXTREME100 peak value (Table 3). It could be, however, that a failure is caused (or expected) by a combination of 2 or more extreme load components. The torque Mz, for example, may be more detrimental if the axial force -Fzis small. In such cases, a large number of possible combinations with increased (or possibly decreased) components must be applied. This may be performed in analytical studies, but is difficult or even impossible in experimental investigations.
Another solution for this problem could be to increase all components during sections of the cycle time so that the marked extrema (Figures 2 to 5) reach the EXTREME100 values (Table 3). For peak ‘‘1’’ of Fres during walking (Figure 2, top left diagram), peak ‘‘2’’ of Fxwould then have to be increased to 292N, peak ‘‘1’’ of Fyto2605N, and peak ‘‘1’’ of2Fz to 3,100N. This would, however, also change Fres, which would increase from 2,848 to 3,172N. Furthermore, the loading directions would also be influenced (which may be the cause of the investigated implant damage). The frontal-plane angle between Fresand the z-axis, for example, would change from 0.9uto 5.4u. In the horizontal plane, the angle between Fresand the x-axis would decrease from 80.8 to 64.2u. The application of such a strategy is also questionable because the EXTREME100 values were taken from data collected from different subjects and may possibly never act combined in the same person.
We have no optimal suggestion for defining generally applicable combinations of load components for the most severe loading conditions. This problem must remain for future discussions, but it may well be that certain extreme loading conditions act in some subjects and that these cannot be appropriately tested in simulators.
Loads acting on implants of different design and in the natural knee joint
The best method for determining how much of the loads are taken up by the soft tissues would be setting up a realistic finite element model of the natural or replaced knee, including the soft tissues and the patella and to apply the reported loads from the femur to the tibia.
Medial-lateral force distribution
The distribution of the axial tibial Force –Fzbetween the medial and lateral compartment can easily be calculated [36] from the data which is accessible from www.OrthoLoad.com (Menu Test Loads). In a previous study [37] with 5 of the subjects investigated now, up to 85% of the peak force were transferred on the medial side, depending on the valgus angle of the knee. With regard to an
even load distribution, a slight valgus angle of 2u to 3u would therefore be favorable.
Acknowledgments
We would like to thank all patients for their engaged cooperation. Surgery was performed by A. Halder and A. Beier at the Hellmuth Ulrici Kliniken in Sommerfeld, Germany.
Author Contributions
Conceived and designed the experiments: GB AB FG AR AT IK. Performed the experiments: GB AB FG JD AT MOH IK. Analyzed the data: GB AB JD AT IK. Contributed reagents/materials/analysis tools: GB AB FG JD AR AT MOH IK. Wrote the paper: GB AT IK.
References
1. Kutzner I, Heinlein B, Graichen F, Bender A, Rohlmann A, et al. (2010) Loading of the knee joint during activities of daily living measured in vivo in five subjects. Journal of Biomechanics 43: 2164–2173.
2. Bergmann G, Graichen F, Rohlmann A, Bender A, Heinlein B, et al. (2010) Realistic loads for testing hip implants. Biomed Mater Eng 20: 65–75. 3. Morrison JB (1970) The mechanics of the knee joint in relation to normal
walking. Journal of Biomechanics 3: 51–61.
4. Taylor WR, Heller MO, Bergmann G, Duda GN (2004) Tibio-femoral loading during human gait and stair climbing. Journal of Orthopaedic Research 22: 625–632.
5. Kuster MS, Wood GA, Stachowiak GW, Gachter A (1997) Joint load considerations in total knee replacement. Journal of Bone and Joint Surgery 79: 109–113.
6. Thambyah A, Pereira BP, Wyss U (2005) Estimation of bone-on-bone contact forces in the tibiofemoral joint during walking. The Knee 12: 383–388. 7. Shelburne KB, Torry MR, Pandy MG (2005) Muscle, ligament, and
joint-contact forces at the knee during walking. Medicine and Science in Sports and Exercise 37: 1948–1956.
8. Sasaki K, Neptune RR (2010) Individual muscle contributions to the axial knee joint contact force during normal walking. Journal of Biomechanics 43: 2780– 2784.
9. Mikosz RP, Andriacchi TP, Andersson GBJ (1988) Model analysis of factors influencing the prediction of muscle forces at the knee. Journal of Orthopaedic Research 6: 205–214.
10. Seireg A, Arvikar(1975) The prediction of muscular load sharing and joint forces in the lower extremities during walking. Journal of Biomechanics 8: 89–102. 11. Allen G, Sioutas C, Koutrakis P, Reiss R, Lurmann FW, et al. (1997) Evaluation
of the TEOM method for measurement of ambient particulate mass in urban areas. J Air Waste Manag Assoc 47: 682–689.
12. Taylor SJ, Walker PS, Perry JS, Cannon SR, Woledge R (1998) The forces in the distal femur and the knee during walking and other activities measured by telemetry. Journal of Arthroplasty 13: 428–437.
13. Taylor SJG, Perry JS, Meswania JM, Donaldson N, Walker PS, et al. (1997) Telemetry of forces from proximal femoral replacements and relevance to fixation. Journal of Biomechanics 30: 225–234.
14. Kaufman KR, Kovacevic N, Irby SE, Colwell CW (1996) Instrumented implant for measuring tibiofemoral forces. J Biomech 29: 667–671.
15. Kirking B, Krevolin J, Townsend C, Colwell CW Jr, D’Lima DD (2006) A multiaxial force-sensing implantable tibial prosthesis. J Biomech 39: 1744–1751. 16. Fregly BJ, Besier TF, Lloyd DG, Delp SL, Banks SA, et al. (2011) Grand challenge competition to predict in vivo knee loads. Journal of Orthopaedic Research 30: 503–513.
17. Mundermann A, Dyrby CO, D’Lima DD, Colwell CW Jr, Andriacchi TP (2008) In vivo knee loading characteristics during activities of daily living as measured by an instrumented total knee replacement. J Orthop Res 26: 1167–1172. 18. D’Lima DD, Patil S, Steklov N, Chien S, Colwell CW Jr (2007) In vivo knee
moments and shear after total knee arthroplasty. J Biomech 40 Suppl 1: 11–17. 19. Heinlein B, Graichen F, Bender A, Rohlmann A, Bergmann G (2007) Design, calibration and pre-clinical testing of an instrumented tibial tray. J Biomech 40 Suppl 1: 4–10.
20. ISO (2009) ISO 14243-1, Implants for surgery - Wear of total knee-joint prostheses. Switzerland.
21. Walker PS, Blunn GW, Perry JP, Bell CJ, Sathasivam S, et al. (2000) Methodology for long-term wear testing of total knee replacements. Clin Orthop Relat Res: 290–301.
22. Lundberg HJ, Ngai V, Wimmer MA (2012) Comparison of ISO Standard and TKR Patient Axial Force Profiles during the Stance Phase of Gait. Proc Inst Mech Eng H 226: 227–234.
23. Portier K, Tolson JK, Roberts SM (2007) Body Weight Distribution for Risk Assessment. Risk Analysis 27: 11–26.
24. Helmert U, Strube H (2004) Die Entwicklung der Adipositas in Deutschland im Zeitraum von 198 is 2002. Gesundheitswesen 77: 409–415.
25. Bender A, Bergmann G (2012) Determination of typical patterns from strongly varying signals. Comput Methods Biomech Biomed Engin 15: 761–769. 26. Taylor WR, Kornaropoulos EI, Duda GN, Kratzenstein S, Ehrig RM, et al.
(2010) Repeatability and reproducibility of OSSCA, a functional approach for assessing the kinematics of the lower limb. Gait & Posture 32: 231–236. 27. Trepczynski A, Kutzner I, Kornaropoulos E, Taylor WR, Duda GN, et al.
(2012) Patellofemoral joint contact forces during activities with high knee flexion. Journal of Orthopaedic Research 30: 408–415.
28. D’Lima DD, Patil S, Steklov N, Slamin JE, Colwell CW Jr (2005) The Chitranjan Ranawat Award: in vivo knee forces after total knee arthroplasty. Clin Orthop Relat Res 440: 45–49.
29. D’Lima DD, Patil S, Steklov N, Slamin JE, Colwell CW Jr (2006) Tibial forces measured in vivo after total knee arthroplasty. J Arthroplasty 21: 255–262. 30. Ngai V, Schwenke T, Wimmer MA (2009) In-vivo kinematics of knee prostheses
patients during level walking compared with the ISO force-controlled simulator standard. Proc Inst Mech Eng H 223: 889–896.
31. Popoola OO, Yao JQ, Johnson TS, Blanchard CR (2010) Wear, delamination, and fatigue resistance of melt-annealed highly crosslinked UHMWPE cruciate-retaining knee inserts under activities of daily living. J Orthop Res 28: 1120– 1126.
32. Schwiesau J, Schilling C, Kaddick C, Utzschneider S, Jansson V, et al. (2013) Definition and evaluation of testing scenarios for knee wear simulation under conditions of highly demanding daily activities. Med Eng Phys 35: 591–600. 33. Schwiesau J, Schilling C, Utzschneider S, Jansson V, Fritz B, et al. (2013) Knee
wear simulation under conditions of highly demanding daily activities–influence on an unicompartmental fixed bearing knee design. Med Eng Phys 35: 1204– 1211.
34. Johnson TS, Laurent MP, Yao JQ, Gilbertson LN (2001) The effect of displacement control input parameters on tibiofemoral prosthetic knee wear. Wear 250: 222–226.
35. Franta L, Kroneka J, Sucha´nekb J (2011) TKA wear testing input after kinematic and dynamic meta-analysis: Technique and proof of concept. Wear 271: 2687–2692.
36. Kutzner I, Ku¨ther S, Heinlein B, Dymke J, Bender A, et al. (2011) The effect of valgus braces on medial compartment load of the knee joint - in vivo load measurements in three subjects. Journal of Biomechanics 44: 1354–1360. 37. Halder A, Kutzner I, Graichen F, Heinlein B, Beier A, et al. (2012) Influence of
![Table 3. EXTREME100 forces [N] and moments [Nm].](https://thumb-eu.123doks.com/thumbv2/123dok_br/18257096.342973/10.918.94.836.128.485/table-extreme-forces-n-and-moments-nm.webp)
