Rules extraction from neural networks applied to the prediction
and recognition of prokaryotic promoters
Scheila de Avila e Silva, Günther J.L. Gerhardt and Sergio Echeverrigaray
Programa de Pós-Graduação em Biotecnologia, Universidade de Caxias do Sul, Caxias do Sul, RS, Brazil.
Abstract
Promoters are DNA sequences located upstream of the gene region and play a central role in gene expression. Computational techniques show good accuracy in gene prediction but are less successful in predicting promoters, primarily because of the high number of false positives that reflect characteristics of the promoter sequences. Many machine learning methods have been used to address this issue. Neural Networks (NN) have been successfully used in this field because of their ability to recognize imprecise and incomplete patterns characteristic of promoter sequences. In this paper, NN was used to predict and recognize promoter sequences in two data sets:(i) one based on nucleotide sequence information and(ii) another based on stability sequence information. The accuracy was ap-proximately 80% for simulation(i) and 68% for simulation (ii). In the rules extracted, biological consensus motifs were important parts of the NN learning process in both simulations.
Key words:neural network, promoter, rule extraction.
Received: March 26, 2010; Accepted: January 11, 2011.
Introduction
The determination of how and when genes are turned on and off is a challenge in the post-genomic era. Differ-ences between two species are often more related to gene expression and regulation than to their structures (Howard and Benson, 2002). An adequate comprehension of the complex metabolic networks present in various organisms, including cellular differentiation and cellular responses to environmental change, can be facilitated by studying of promoter sequences,i.e., short sequences located before the transcription start site (TSS) of a gene (Jáuregui et al., 2003; Pandey and Krishnamachari, 2006).
Promoters act as gene expression regulators through their ability to interact with the enzyme RNA polymerase, thereby initiating transcription. Thesfactor moiety of the
RNA polymerase, of which there are several types, are in-volved in the recognition and primary interaction with the promoters. Various bacterialsfactors interact with
differ-ent promoter sequences that are characterized by particular consensus motifs and properties. Most prokaryotic promot-ers have two consensus hexameric (six nucleotides) motifs: one centered at position -35 and another centered at posi-tion -10 relative to the TSS. For factors70, the pattern
se-quences for these motifs are ‘TTGACA’ and TATAAT’ for
positions -35 and -10, respectively, and are separated by ~17 non-conserved nucleotides (Lewin, 2008).
As an analogy, the downstream sequences (genes) represent the “computer memory” while the upstream se-quences (promoters) represent the “computer program” that acts on this memory. The study of promoters can pro-vide new models for developing computer programs and for explaining how they operate (Howard and Benson, 2002). Despite the importance of promoters in gene expres-sion, the shortness of their sequences, many of which are not highly conserved, makes them difficult to detect when compared to genes sequences. This characteristic limits the accuracy ofin silicomethods because many nucleotide al-terations may not be significant in terms of promoter func-tionality (Howard and Benson, 2002; Burdenet al., 2005; Kanhere and Bansal, 2005b).
There are many machine learning approaches for pro-moter recognition and prediction, including Hidden Mar-kov Models – HMM (Pedersen et al., 1996), Support Vector Machines – SVM (Gordonet al., 2003) and Neural Networks – NN. The earliest NN used for promoter predic-tion had a simple architecture (Demeler and Zhou, 1991; O’Neill, 1991). In these papers, the prediction had good ac-curacy but the number of false positives was high. Maha-devan and Ghosh (1994) used two NN: one to predict motifs and another to recognize the complete sequence. The Neural Networks Promoter Prediction(NNPP) pro-gram was implemented by Oppon (2000) and improved by Burdenet al.(2005), who included information about the www.sbg.org.br
Send correspondence to Scheila de Avila e Silva. Instituto de Bio-tecnologia, Universidade de Caxias do Sul, Rua Francisco Getúlio Vargas 1130, 95070-560 Caxias do Sul, RS, Brazil. E-mail: [email protected].
they are less stable, more curved and more bendable (Ka-nhere and Bansal, 2005a). The latter authors subsequently used promoter stability information to develop a procedure that recognizes promoters in whole sequences (Kanhere and Bansal, 2005b). However, despite the importance of these physical features, they have not been widely used in NN promoter prediction.
Neural networks are suitable for promoter prediction and recognition because of their ability to identify degener-ated, imprecise and incomplete patterns present in these se-quences. In addition, NNs perform well when processing large genome sequences (Kalateet al., 2003; Cotiket al., 2005). A further feature is that there is no need for prior knowledge when building a suitable model. An important procedure in NN methods is rule extraction from trained networks that can assist the user in identifying biological rules from the input data (Andrewset al., 1995). In this pa-per, we describe the use of a NN to predict and recognize prokaryotic promoters by comparing two data sets:(i) nu-cleotide sequence information and(ii) stability sequence information ofE. colipromoters, regardless of thesfactor
that recognizes the sequence.
Material and Methods
The promoter sequences used were obtained from the January 2006 version of the RegulonDB database (Gama-Castroet al., 2008). Nine hundred and forty promoters and 940 random sequences were used to train and test the NN. The promoters and sequences represented positive and neg-ative examples, respectively. The random sequences were generated with a probability of 0.22 for guanine (G) or cy-tosine (C) nucleotides and 0.28 for adenine (A) or thymine (T) nucleotides, based on the distribution of these nucleo-tides in real promoter sequences (Kanhere and Bansal, 2005a). The examples were shuffled and allocated to one of ten files in order to generate the train and test set. Two sim-ulations were done, one based on nucleotide sequences and the other on stability information. The procedures are de-scribed below.
ware ClustalW (Thompsonet al., 1994) to accommodate the variable sequence length between the motifs. Without this initial alignment, the NN does not provide good accu-racy. The alignment introduced gaps in the sequences, rep-resented by a short line (-). The gaps were inserted where necessary (at the beginning, middle or end of a sequence) (Figure 1). The short line (-) was removed from the begin-ning and end of the sequence to avoid incorrect learbegin-ning by the NN. Consequently, the resulting promoter sequences contained 72 nucleotides. After alignment, the nucleotides and gaps were encoded using a set of four binary digits as described by Demeler and Zhou (1991): A = 0100, T = 1000, C = 0001, G = 0010 and “-” = 0000.
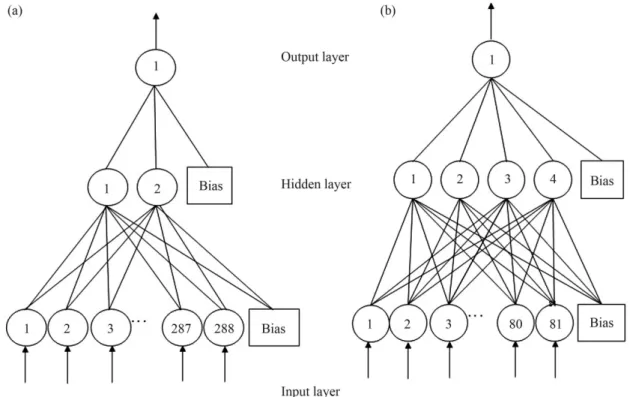
The architecture used to classify the sequences had 288 input neurons (72 bp x four digits for each nucleotide), two neurons in the hidden layer and one neuron in the out-put layer (Figure 2a). The presence of a large number of neurons in the hidden layer or in the output layer did not in-crease the accuracy of the procedure.
Simulation using promoter sequence stability
The stability of DNA molecules can be expressed in terms of their free energy (DG), which in turn depends on
the mononucleotide and dinucleotide composition (San-taLucia and Hicks, 2004). The stability of a DNA duplex can be predicted from its sequence based on the contribu-tion of each nearest-neighbor interaccontribu-tion (SantaLucia and Hicks, 2004; Kanhere and Bansal, 2005a). The contribution of each dinucleotide is described in SantaLucia and Hicks (2004).
To do the simulation using the free energy informa-tion, denoted as the stability-based simulainforma-tion,DG was
cal-culated using the following formula, described in SantaLu-cia and Hicks (2004) and Kanhere and Bansal (2005a):
DG0=DGij (1)
where DG0ij is the standard free energy change for
dinucleotides of typeij. The original formula described in Kanhere and Bansal (2005a) was modified to adjust its ade-quacy to the goals of this paper. The best architecture
tained to classify the sequences had 81 neurons in the input layer, four hidden neurons and one output neuron (Figu-re 2b).
Training and analysis procedures
Both simulations were done in the R Environment (R Development Core Team, 2005). The algorithm back-pro-pagation(BP) was chosen because it is the most popular al-gorithm for training feedfoward networks (Kalateet al., 2003). NNs based on the BP training algorithm have been successfully used for various applications in biology in-volving non-linear input-output modeling and classifica-tion (Mahadevan and Gosh, 1994; Kalate et al., 2003; Burdenet al., 2005). The ten-fold cross-validation method was used to obtain statistically valid results. The k-fold cross-validation (k-FCV) technique consists in randomly sharing the examples’ archive inkequal portions. The train and validation were repeatedktimes, usingk-1 archives to train andktharchives for validation. In each interaction, the validation archive had a different k (Polate and Günes, 2007).
The accuracy (A), specificity (S) and sensitivity (SN) were calculated from the number of true positives (TP), true negatives (TN), false positives (FP) and false negatives (FN). The TP were promoter sequences classified as pro-moters, TN were random sequences recognized as non-promoters, FP were random sequences classified as
promoters and FN, promoters classified as non-promoter sequences. The formulas used are given below:
A TP TN
TN TP FN FP
= +
+ + + (2)
S TN
TN FP
=
+ (3)
SN TP
TP FN
=
+ (4)
An input sequence was classified as a promoter if its output lay between 0.5 and 1.0. Otherwise, it was consid-ered as a non-promoter (Kalateet al., 2003).
Rule extraction
Neural networks are applicable to many different problems, but the learning process is complex (Andrewset al., 1995). How a NN classifies a given sequence as pro-moter or non-propro-moter can be understood based on rule ex-traction. Here, we extracted rules using two approaches:
since they best represented the input data. The result of this approach was a rule prototype, which we defined as the in-put data set average. The rule can be written as a linear equation: “Ifx @prototype then y= constant of a linear
equation + (coefficients of the linear equation)”. Here,xis an input example,ycorresponds to the NN output and the coefficients of the linear equation are the nucleotides of the sequence. This approach is referred to as FAGNIS, accord-ing to Cechin (1998). Rule extraction was done in the R En-vironment (R Developed Core Team, 2005).
(2) Rules by a decision tree: These rules were ob-tained using the software Weka with the algorithm J-48 (Witten and Frank, 2005). The decision tree is an analytical tool to find rules and relations by subdividing information in the data analyzed. The tree consists of nodes that repre-sent attributes and arches from the nodes that were assigned possible values for these attributes. The first node corre-sponds to the root from which the other nodes were derived. These derived nodes are referred to as leaf-nodes and
repre-Classification analysis
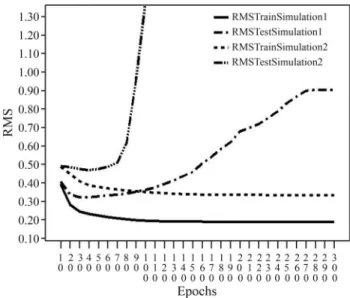
Analysis of the results initially involved a root mean square (RMS) evaluation. Figure 5 shows the RMS plot of the best NN architecture for both simulations. In the se-quence-based simulation, the lowest RMS was achieved with 30 train epochs,i.e., this number of epochs yielded the best accuracy, which was 0.8 (80%) with a standard devia-tion of 0.04 (4%). For the stability-based simuladevia-tion, the best NN yielded an RMS with 40 train epochs (Figure 3), an accuracy of 0.68 (68%) and a standard deviation of 0.023 (2.3%).
The quality of the classification is shown by the con-fusion matrix for both simulations (Table 1). The specific-ity and sensitivspecific-ity of the results for the sequence-based simulation was 0.9 (90%) and 0.65 (65%), respectively. For the stability-based simulation, the values for these two pa-rameters were 0.7 (70%) and 0.67 (67%), respectively.
The box plot (Figure 4) shows the distribution of the values for accuracy, specificity and sensitivity in the ten-fold cross-validation. The central line represents the me-dian, the base of the rectangle is proportional to the number of cases, and the lower and upper boundaries of the box show the lower and upper quartiles, respectively. The length of the box therefore corresponds to the inter-quartile range, which is a convenient and popular measure of the spread. For both simulations, the small length of the boxes indicated low variation in accuracy and sensitivity; speci-ficity showed the greatest variation.
Figure 3- The three regions defined in the sigmoid function to analyze the input data and to extract rules from the trained NN.
Figure 4- Box plot for accuracy, specificity and sensitivity in the ten-fold cross-validation for both simulations.
The classification results showed that the NN pro-vided a good generalization for the input data in the quence-based simulation. The NN classified random se-quences more correctly than it did promoter sese-quences (Table 1). This fact probably reflected the incomplete con-servation of the consensus hexameric sequence of the pro-moters and the presence of several consensus promoter se-quences for each s factor (Lewin, 2008). The NN was
unable to learn a single pattern for the input data because of different motifs present in thesfactor family,e.g., the
con-sensus sequences fors24 are ‘CTAAA’ for the -35 region
and ‘GCCGATAA’ for the -10 region. Consequently, the NN created a general classification rule based on similar features for all promoter sequences. For this reason, the sensitivity observed here was lower than that observed in other papers. This finding was reflected in the low number of epochs necessary for learning, an indication that the in-put data had noise typical of biological data (Losaet al., 1998). In contrast, the results from the stability-based simu-lation showed that the NN was unable to correctly classify the random sequences (Table 1). This finding can be ex-plained by the lack of data synchronization since it was not possible to pre-align the sequences. Sequence alignment was not feasible because it was impossible to obtain stabil-ity values for the gaps inserted during alignment.
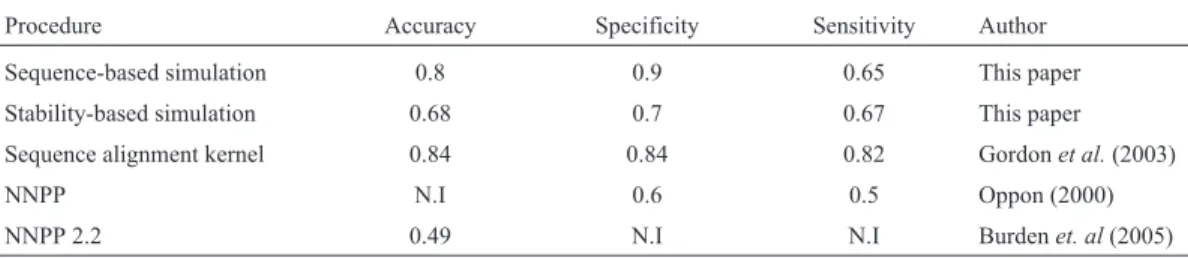
The results for the sequence-based simulation were very similar to those reported by others (Table 2). Burdenet al.(2005) reported a specificity of 0.6 (60%) and sensitivity of 0.5 (50%) for their NN-based analysis. The usefulness of this tool (referred to as NNPP) was improved when the esti-mated probability that a given sequence was a true pro-moter was reduced by 60%. Gordonet al.(2003) developed an SVM-based approach using a sequence alignment kernel and reported an accuracy of 0.84 (84%), a specificity of 0.84 (84%) and a sensitivity of 0.82 (82%). Web tools such
as BPROM claim an accuracy of 0.8 (80%). The papers or web tools described are only fors70promoter sequences
whereas our NN used all known promoter sequences. In ad-dition, in most previous studies the number of sequences used was lower than that used here. The results of the stabil-ity-based simulation were poor, but this simulation can be useful for subsequent predictions and can expand the range of tools for promoter prediction.
Rule extraction in the sequence-based simulation
In this simulation, five rules were extracted by the FAGNIS method. The decision tree was obtained by using the J-48 algorithm (Figure 7). To facilitate comprehension, only promoter rules will be discussed. The rules from FAGNIS yielded the promoter prototype shown in Figure 6 and identified the nucleotides that were most important in the learning process.
All of the nucleotides underlined in Figure 6 were the most important for the learning process. The nucleotides lo-cated in regions -35 and -10 (read left to right) are indilo-cated in bold. The similarity of the nucleotides identified by the prototype with the consensus biological sequence was clear since most of the sequences belonging to the data set were recognized bys70. In addition to these consensus
nucleo-tides, there are other nucleotides that are crucial for NN but they are not located in regions of known biological tance. The nucleotides in parentheses all have equal impor-tance for NN. The pattern shown here was also observed with the decision tree discussed below.
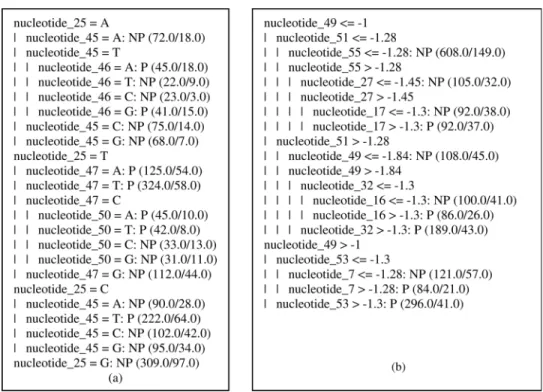
The ten-fold-cross-validation method was used to ob-tain statistically valid results for the extraction rule based on the decision tree. The resulting tree had 31 nodes and 25 leaves (Figure 7a). The frequency of correctly classified se-quences was 63% and the promoter precision was 68%. The trees showed nucleotide 25 (located in the -35 region) as the Table 1- Confusion matrix for the NN architecture described in the text. The sequences were classified as promoters and non-promoter (random) se-quences.
Sequence-based simulation Stability-based simulation
Classified as promoter Classified as non-promoter Classified as promoter Classified as non-promoter
Promoter 66 28 63 31
Non-promoter 9 85 28 66
Table 2- Comparison of different methods used to calculate accuracy, specificity and sensitivity.
Procedure Accuracy Specificity Sensitivity Author
Sequence-based simulation 0.8 0.9 0.65 This paper
Stability-based simulation 0.68 0.7 0.67 This paper
Sequence alignment kernel 0.84 0.84 0.82 Gordonet al.(2003)
NNPP N.I 0.6 0.5 Oppon (2000)
NNPP 2.2 0.49 N.I N.I Burdenet. al(2005)
root. The presence of guanine at this position was sufficient to identify a given sequence as a non-promoter. The other nucleotides present in the rules were located in the -10 re-gion that included nucleotides 46 to 54, approximately. Some of the rules identified by this approach included:
a)IfPromoterthennucleotide_25 = A, nucleotide_45 = T and nucleotide_46 = A or G
b) IfPromoter thennucleotide_25 = T and nucleo-tide_47 = A or T
c)If Promoterthen nucleotide_25 = T and nucleo-tide_47 = C and nucleotide_50 = A or T
d) IfPromoterthen nucleotide_25 = C and nucleo-tide_45 = T
These rules shared many similarities with the proto-type obtained with the trained NN. Clearly there is a strong relationship among the nucleotides located in the biological
motifs. Despite the incomplete conservation of these motifs, they are still an important feature used by NN for learning. The rules generally agreed with current biological knowledge.
Rule extraction in stability-based simulations
For this simulation, rule extraction using FAGNIS generated seven rules, of which only one classified se-quences as a non-promoter (rule 1). The prototypes of the rules are shown as plots for better comprehension (Figu-re 8). In four promoter prototypes (rules 4 to 7) the(Figu-re was a decrease in theDG values in the -10 region (located
be-tween nucleotides 45 and 52). These rules were valid for 135 promoter sequences, which were classified based on these rules. The two promoter prototypes that accounted for the majority of promoter sequences (total of 533) showed
Figure 7- Decision tree based on the J-48 algorithm. (a) Decision tree for the sequence-based simulation data. (b) Decision tree for the stability-based simulation data.
no evident decrease in this region. Four patterns of promot-ers were identified in the plots, in contrast to NN learning, and this explains the poor rate of correct sequence classifi-cation.
The rules obtained using the J-48 algorithm were ex-tracted from the decision tree shown in Figure 7b. The ten-fold cross-validation method was also used. The result-ing tree had 21 nodes and 11 leaves. The success rate for correctly classified sequences was 66.8% and the promoter precision was 68%. The rules that classified a sequence as a promoter are shown in Figure 7b. These rules showed that there was a relationship between the two consensus motifs of promoters. The root of the tree was nucleotide 49 (lo-cated in the -10 region), but there were other important nu-cleotides in the -10 and -35 regions. Some nunu-cleotides (7, 13, 16, 17 and 32) occurred at positions with no known bio-logical function. This analysis also revealed the stability low value of the nucleotides and the absence of guanine at position 49. This fact can explain the highDG value that
this nucleotide has when it occurs as a neighbor of another nucleotide.
In conclusion, the usefulness of NN for promoter pre-diction and recognition was assessed using two data sets. The accuracy of the sequence-based simulation was 0.80±0.04 while that of the stability-based simulation was
0.68 ± 0.02. These results were comparable to those
re-ported in the literature. The rules extracted from NN learn-ing can help to identify the most important nucleotide pro-moter patterns. The pattern obtained is representative of all sequences, despite thesfactor that recognizes each
moter. The data obtained by this approach can help in pro-moter prediction and increase our knowledge of the biolog-ical role of promoters. Generally, NN-based methods and
machine learning techniques for promoter prediction rely on the stability of promoter sequences less frequently than on nucleotide sequence information. The confusion matrix showed that NN could differentiate promoters and random sequences based on nucleotide information, but this was not the case when stability information alone was used. The results of this study indicate that the use of nucleotide se-quence and structural characteristics as input data may help to improve the prediction of bacterial promoters. This find-ing should provide a stimulus for developfind-ing more efficient algorithms for predicting such promoters.
Acknowledgments
We are grateful to Universidade de Caxias do Sul (UCS) for financial support.
References
Andrews R, Diederich J and Tickle AB (1995) A survey and cri-tique of techniques for extracting rules from trained artificial neural networks. Knowledge-Based Syst 6:373-389. Burden S, Lin Y-X and Zhang R (2005) Improving promoter
pre-diction for the NNPP2.2 algorithm: A case study using Esch-erichia coliDNA sequences. Bioinformatics 21:601-607. Cechin AL (1998) The Extraction of Fuzzy Rules from Neural
Networks. Shaker Verlag, Aachen, 149 pp.
Cotik V, Zaliz RR and Zwir I (2005) A hybrid promoter analysis methodology for prokaryotic genomes. Fuzzy Sets Syst 1:83-102.
tion of promoter regions. Bioinformatics 19:1964-1971. Howard D and Benson K (2002) Evolutionary computation
me-thod for pattern recognition ofcis-acting sites. BioSystems 72:19-27.
Jáuregui R, Abreu-Goodger C, Moreno-Hagelsieb G, Collado-Vides J and Merino E (2003) Conservation of DNA curva-ture signals in regulatory regions of prokaryotic genes. Nu-cleic Acids Res 31:6770-6777.
Kalate R, Tambe SS and Kulkarni B (2003) Artificial neural net-works for prediction of mycobacterial promoter sequences. Comput Biol Chem 27:555-564.
Kanhere A and Bansal M (2005a) Structural properties of promot-ers: Similarities and differences between prokaryotes and eukaryotes. Nucleic Acids Res 33:3165-3175.
Kanhere A and Bansal M (2005b) A novel method for prokaryotic promoter prediction based on DNA stability. BMC Bioin-formatics 6:1471-2105.
Lewin B (2008) Genes IX. Artmed, Porto Alegre, 955 pp. Losa GA, Merlini D, Nonnenmacher TF and Weibel ER (1998)
Fractals in Biology and Medicine. Vol. II, Mathematics and Bioscience in Interaction. Birkhäuser, Basel, 321 pp. Mahadevan I and Ghosh I (1994) Analysis ofE. colipromoter
structures using neural networks. Nucleic Acids Res 22:2158-2165.
O’Neill, MC (1991) Training back-propagation neural networks to define and detect DNA-binding sites. Nucleic Acids Res 19:313-318.
Oppon EC (2000) Synergistic Use of Promoter Prediction Algo-rithms: A Choice for a Small Training Dataset? Doctorate in
den Markov models. In: Proceedings of the Fourth Interna-tional Conference on Intelligent Systems for Molecular Biology, St. Louis, pp 182-191.
Polate K and Günes S (2007) A novel approach to estimation ofE. colipromoter gene sequences: Combining feature selection and least square support vector machine (FS_LSSVN). Appl Math Comput 190:1574-1582.
SantaLucia J and Hicks D (2004) The thermodynamics of DNA structural motifs. Annu Rev Biophys Biomol Struct 33:415-440.
Thompson JD, Higgins DD and Gibson TJ (1994) Clustal W: Im-proving the sensitivity of progressive multiple sequence alignment through sequence weighting position-specific gap penalties and weight matrix choice. Nucleic Acids Res 22:4673-4680.
Witten IH and Frank E (2005) Data Mining: Practical Machine Learning Tools and Techniques. Morgan Kaufman, San Francisco, 560 pp.
Internet Resources
R Development Core Team (2005) R: A language and environ-ment for statistical computing. R Foundation for Statistical Computing, Vienna, Austria. http://www.R-project.org (November 20, 2005).
Associate Editor: Luciano da Fontoura Costa