Genetic analysis of soybean resistance to
Fusarium solani
f.sp.
glycines
Vanoli Fronza
1, Natal Antonio Vello
2,4and Luis Eduardo Aranha Camargo
3,41
Empresa de Pesquisa Agropecuária de Minas Gerais, Centro Tecnológico do Triângulo
e Alto Paranaíba, Uberaba, MG, Brazil.
2
Universidade de São Paulo, Escola Superior de Agricultura “Luiz de Queiroz”,
Departamento de Genética, Piracicaba, SP, Brazil.
3Universidade de São Paulo, Escola Superior de Agricultura “Luiz de Queiroz”,
Departamento de Entomologia, Fitopatologia e Zoologia Agrícola, Piracicaba, SP, Brazil.
4CNPq fellowship.
Abstract
In order to study the genetic control of soybean resistance to sudden death syndrome (SDS), a 5 x 5 diallel with the F2
generation, without the reciprocals, was carried out in a greenhouse. The following parents were used: Forrest, MG/BR-46 (Conquista), IAC-4, FT-Cristalina, and FT-Estrela. The first two cultivars are more resistant to SDS than IAC-4, which is considered to be moderately resistant to SDS, and the last two cultivars are highly susceptible. The fungus was inoculated with three colonized sorghum grains placed at the bottom of the holes with two soybean seeds. Single plants were evaluated between 14 and 37 days after emergency based on foliar severity symptoms (1-5) of SDS. The disease incidence and a disease index were also calculated for each plot (clay pots with five plants each). The analysis for severity and disease index was performed only with the data of the 37th
day after emergence. Additive and dominant genetic effects were detected by Jinks-Hayman’s analysis, but the dominant genetic effects were higher. The genetic parameters estimated indicated that the average degree of dominance showed the presence of overdominance; at least three loci or genic blocks that exhibited dominance were responsible for the genetic control of SDS resistance; the estimates of narrow-sense heritabilities were moderate (0.48 to 0.62), but in the broad-sense they were higher (0.90 to 0.95), thus reinforcing the presence of dominance effects; and the resistance to SDS was controlled mostly by dominant alleles. Five microsatellite markers (Satt163, Satt309, Satt354, Satt371 and Satt570), reported as linked to five QRLs of the SDS, were used to genotype the parents and showed the possibility of occurrence of multiallelism in those loci, but this evidence did not invalidate the fitting of the data to the Jinks-Hayman’s model.
Key words: Glycine max, resistance, sudden death syndrome-SDS, diallel crosses, Jinks-Hayman, molecular markers SSR.
Received: January 27, 2003; Accepted: February 19, 2004.
Introduction
The red rot of soybean roots (PVR in Brazil), also known as sudden death syndrome (SDS), is caused by the
Fusarium solanif.sp.glycinesfungus. This disease has
re-sulted in increasing yield losses to Brazilian soybean farm-ers since the beginning of the last decade.
Up until this time, no chemical control or cultural method has been effective nor any cultivar immune to the disease. So, the use of more resistant cultivars is the best hope for SDS control or plant cohabitation with the fun-gus.
Few reports were found in the literature on the study of genetic control of soybean resistance to SDS with tradi-tional genetic techniques and all the studies showed just one biparental cross (Stephenset al., 1993; Heavneret al.,
1996; Ringler and Nickell, 1996). In one of the first studies on the inheritance of soybean resistance to SDS, with F2
and F2:3segregating populations of the Ripley and Spencer
reciprocal crosses in a greenhouse, it was found that the ability of Ripley to resist foliar disease symptoms was con-ditioned by a single dominant nuclear gene called Rfs (Stephenset al., 1993). Subsequently, in other studies, the
resistance to SDS foliar symptoms in Ripley, complete and conditioned by only one dominant gene, was reaffirmed (Heavneret al., 1996; Ringler and Nickell, 1996).
How-ever, complete monogenic inheritance was observed only www.sbg.org.br
Send correspondence to Vanoli Fronza. Empresa de Pesquisa Agropecuária de Minas Gerais, Centro Tecnológico do Triângulo e Alto Paranaíba, Caixa Postal 351, 38001-970 Uberaba, MG, Brazil. E-mail: vanoli@epamig.br.
in the cultivar Ripley. So, it is possible that Ripley has a dif-ferent mechanism of resistance.
Several studies with molecular markers showed that the resistance in the field is partial, polygenic and quantita-tive (Changet al., 1996; Hnetkovskyet al., 1996; Njitiet al., 1998; Iqbalet al., 2001; Njitiet al., 2002). Initially, four
QRLs (quantitative resistance loci) associated to the resis-tance to SDS were found (Changet al., 1996; Hnetkovsky et al., 1996). In a more recent study, six QRLs responsible
for SDS resistance were reported (Iqbalet al., 2001). Five
of them were associated to the microsatellite molecular markers Satt214, Satt309, Satt570, all of them on linkage group (LG) G, Satt371 (LG C2) and Satt354 (LG I), and an-other one was associated to the RAPD marker OE021000
(LG G). Jointly, these QRLs explained about 91% of the to-tal variation in SDS disease incidence of RILs (recombi-nant inbred lines) from the Forrest x Essex cross, and they showed only the presence of additive genic action. In an-other study with molecular markers (RFLP, RAPD, micro-satellite and AFLP), in RILs of the Pyramid x Douglas cross, Njitiet al.(2002) reported three QRLs, which jointly
explained about 60% of the total variation in SDS inci-dence. Of these markers, one was located on LG G (Satt163), near Satt309 and Satt038, another on LG C2 (Satt307), and another on LG N (Satt080), near Satt387, which also showed a strong association to SDS QRL. Ac-cording to Triwitayakornet al.(2002), there are at least
seven genes underlying resistance to SDS. They also re-ported that three genes on LG G (Rfs1, Rfs2 and Rfs6) were sequenced, and the next genes they will sequence are the genes on LG C2 and I, respectively, Rfs4 and Rfs5. How-ever, in all of these studies with molecular markers, only RILs were used. No information was supplied on the pres-ence of dominant genetic effects or whether dominant or re-cessive alleles predominate in the genetic control of SDS resistance.
Among the biometric methods used for genetic analy-sis, undoubtedly, the study of diallel crosses is the one that supplies the most information to plant breeders for con-ducting a breeding program with artificial hybridization. Therefore, the Jinks-Hayman method (Jinks and Hayman, 1953; Hayman, 1954a, b; Jinks, 1954) was considered pow-erful enough for genic action analysis, due to the degree of detailing of the analysis that makes it much more informa-tive than the other methods (Toledo and Kiihl, 1982). Thus, this method seems sufficiently adjusted for self-pollinated crops like soybeans. With some adaptation, the Jinks-Hayman method can also be used in the F2generation
(Hay-man, 1958; Singh and Singh, 1984a), when there is a large number of seeds from each cross, making the evaluation possible for a larger number of plants in one or more envi-ronments. However, the use of this methodology requires the making of some assumptions (Hayman, 1954a, 1958), which in practice are not always totally taken care of. However, if molecular markers linked to the studied genes
are used, it is possible to make more inferences on these as-sumptions and also to compare certain results.
In the present study, the Jinks-Hayman diallel analy-sis was used to investigate the inheritance of soybean reanaly-sis- resis-tance to SDS in order to provide information for future soybean breeding programs and to detail the use of this methodology with the F2generation. The use of some
mo-lecular markers reported as linked to resistance genes of the SDS is also discussed.
Materials and Methods
The F2generation of a 5 x 5-diallel, without the
recip-rocals, was used in the study. The following parents: For-rest, MG/BR-46 (Conquista), IAC-4, FT-Cristalina and FT-Estrela were used. The first two parents are more resis-tant to SDS than IAC-4, considered moderately resisresis-tant, and the two last are highly susceptible.
The experiment was carried out in a greenhouse, in the Department of Genetics/ESALQ/USP, in Piracicaba-SP. The sowing date was July 31, 2002, and a completely randomized design, with 10 replications for each parent and 30 replications for each F2population was used.
The isolate ofF. solanif.sp.glycines(SDS-5) was
ob-tained at the Embrapa Soja (Londrina-PR). It was kept in tubes (20 x 200 mm) or Petri plates by successive transfer-ence in PDA medium (250 g/L of potato: 12 g/L of dextrosol: 18 g/L of common or bacteriological agar). To increase the fungus, 100 cm3of red-sorghum grains were
soaked overnight in distilled water in a 500 mL Erlenmeyer flask, drained, and autoclaved on two consecutive days for 20 min at 120 °C. Each of the flasks containing sterilized sorghum grains was inoculated by transferring 15 (5-mm-diameter) mycelial plugs from the PDA colonies. Ten milliliters of sterile distilled water were added to each flask for better dispersion of the spores and mycelium and to maintain humidity in the sorghum grains. Cultures on sorghum grains were incubated in the dark for 24 days at temperatures ranging from 22 °C to±2 °C. To allow for a
uniform growth of the fungus around the sorghum grains and to maintain the grains untied, the flasks were agitated periodically.
The fungus was inoculated by the colonized sorghum grain technique (Hartmanet al., 1997), and was placed at
the bottom of each hole when sowing (Balardin and Rubin, 1999). Five holes, 4 cm deep, were made in each ceramic pot with three liters of unsterilized soil, which came from an uncultivated area. Each pot had five plants. Three sor-ghum grains were placed in each hole, in direct contact with the soybean seeds (two/hole). Thinning took place soon af-ter the emergency, leaving one plant per hole. Soon thereaf-ter, inoculating oil containingBradyrhizobium japonicum,
Five days after the emergency, 5-g of ammonium sul-fate was applied to each pot, followed by irrigation. The soil humidity was maintained, at a minimum of -4 cm of Hg (about -0.05 atm), and measured with a tensiometer placed 8 cm deep.
Thirteen days after the emergency another inocula-tion was done by pressing two colonized sorghum grains 1 cm deep, next to the taproot of each plant, with the aid of a glass stick.
Fifty plants of each parent and 150 plants of each F2
population were evaluated individually, with intervals of three or four days, between the 14thand 37thdays after the
emergency. Only the data from the last evaluation were used for the analyses. The severity of the SDS foliar symp-toms was evaluated based on the leaflet with the most in-tense symptoms and on the general appearance of the plant. The severity of SDS was rated 1 to 5, as used by Hartmanet al.(1997), and modified for the following:1= no visible
fo-liar symptoms; 2 = slight symptom development, with
chlorosis in mosaic, and deformation or wrinkling of the leaflets; 3 = moderate symptom development, with
interveinal chlorosis and necrosis on the border of the leaf-lets;4= heavy symptom development, with chlorosis and
interveinal necrosis (no more than 50% of foliar area af-fected by necrosis);5= severe symptom development, with
chlorosis and interveinal necrosis and/or plant death or se-vere restriction in the development of the plants (51% to 100% of foliar area affected by necrosis). The average se-verity of the disease (DS) and the percentage of disease in-cidence (DI) in each plot (ceramic pot) were calculated and a disease index [(DS x DI)/5] was obtained, according to Njitiet al.(1998).
The analyses of variance according to the design used was followed by the analyses of variance of diallel tables, according to the procedures of Ramalhoet al.(1993),
de-rived from complete diallel tables (Hayman, 1954b), and adapted to half diallel tables by Jones (1965). In these anal-yses the pooled error of the initial ANOVA was used, and it was divided by the harmonic average (18) of replications of parents and F2populations.
These analyses of variance of diallel tables were fol-lowed by the diallel analyses of the data obtained with the F2generation, according to the theoretical bases developed
for the F1generation (Hayman, 1954a), adapted for the F2
generation, using half diallel tables with “n” parents (Singh and Singh, 1984a). From these tables the following vari-ances and covarivari-ances were estimated for each trait: Vp, Vr,
Vr, Vr, Wr, and Wr. The mean of the parents (ML0) and F2
populations (ML2) were also calculated.
The goodness of fit of the additive-dominant model was performed based on the linear regression of the values ofW$
r onV$r, in two ways:1)to verify if the angular
coeffi-cient of the straight line (b) was equal to unit (H0: b = 1vs.
H1: b≠1) (Cruz and Regazzi, 1997); and2)to verify if the
angular coefficient of the straight line (b’) was zero (H0:
b’ = 0vs.H1: b’ ≠0), after the rotation of 45° on the axis of
the graph (Hayman, 1954a).
The following genetic components were estimated: D, H1, H2and F, after the fitting of the data to the genetic
model of Jinks-Hayman was verified. For the estimate of these components of genetic variation the following equa-tions, adapted to half diallel tables, were used with the data from the F2 generation, according to Singh and Singh
(1984a):
[
]
$ $
$ $ $ $
$
D V E
H 4V 16V 16W 4 nE 4(n 1)E n
H 16
p 0
1 p r r
0 2 2 = − = + − − + − = $ $
[
]
$ $ $V 16V 16 (n -1)E (n - 2n + 1)E n
F 4V W 4(n
-r r 0 2 2 2 p r − − +
= −8 − 2)E
n
0
The specific errors of the initial ANOVA, showed for E0(mean square of the error of parents divided by 10) and
E2(mean square of the error of F2populations divided by
30), were used due to the fact that the parents had 10 repli-cations and the F2populations had 30 replications each.
The standard error of each genetic component was es-timated based on the following variance (Hayman, 1954a): s2 Var(W V ) / 2
r r
= $ $ −$ . This variance was then multiplied
by the specific coefficients for each genetic component, for the F2generation with the complete diallel table according
to Hayman (1958). Each coefficient was corrected for half diallel tables, and then the square root was extracted to ob-tain the standard error of each component. The correction of each coefficient for half diallel tables was done in per-centages based on the observed difference between the spe-cific coefficients of each component, for a 5 x 5 diallel, supplied to the F1generation with complete diallel table
data according to Hayman (1954a), and supplied to the F1
generation with half diallel table data, according to Ferreira (1985). The correction factor obtained for each coefficient was then multiplied by the coefficient supplied to the F2
generation (Hayman, 1958). The significance of each com-ponent was then tested for the t test, with “n-2” degrees of freedom, in which the value of “t” was obtained by the divi-sion of the estimate of each component by its respective standard error (Singh and Chaudhary, 1979).
From the estimates of the genetic components, the following genetic parameters were estimated, and their in-terpretations are related exclusively to the group of parents used in the present study (fixed model):1) add$ = H / D$1 $;
2) $
$ $ $ $ $ $ $ K K DH F DH F D R = + − 4 4 1 1
; 3) µv = $
$ H 4H
2 1
$ ) $ N 16(ML ML
H
2
= − 0
2
2
(estimated from the equation of
Jinks, 1954, and adapted for the F2generation by Santos,
1984); 5) $
$ $ $ $ $ $ $ $ $ h D 2 H1 2 H2 2 F 2 D 2 H 2 H 4 F 2 E r ns 2 1 2 = + − − + − − + $ $ $ $ $ $ $ $ $ $ h D 2 H1 2 H2 4 F 2 D 2 H 2 H 4 F 2 E r bs 2 1 2 = + − − + − − + .
The heritability in the narrow and broad-sense was calculated in level of plot means, according to Mather and Jinks (1982). The value of Ê/r was obtained from the divi-sion of the mean square of the general error of the initial ANOVA by the harmonic average (18) of replications of parents and F2populations.
The following genetic information was also obtained (Cruz and Regazzi, 1997):1)coefficient of correlation
be-tween favorable alleles and dominance (r); and,2)
concen-tration of dominant and recessive alleles in the parents (W$r +V$r).
The diallel analyses were performed by electronic spreadsheets in the Excel program (Microsoft® Excel 97). Five microsatellite molecular markers (Satt163, Satt309, Satt354, Satt371 and Satt570), reported as linked to five QRLs of the SDS (Iqbalet al., 2001; Njitiet al., 2002), were also used to genotype the parents. This part of the study was done at the Laboratory of Molecular Genetics of the Department of Entomology, Phytopathology and Ag-ricultural Zoology of the ESALQ/USP. The extractions of DNA and PCRs (polimerase chain reactions) were done ac-cording to Schuster (1999), with some modifications. Elec-trophoresis for the microsatellite markers was performed in sequencing gel containing 6% polyacrylamide, 7 M urea and 1 X TBE (Tris-Borate 90 mM and EDTA 2 mM), at 60 W for three and half hours. The gel was then silver stained. For more details, see Fronza (2003).
Results and Discussion
The results of the goodness of fit of the Jinks-Hayman’s additive-dominant genetic model are showed in Table 1. It was observed that, in all cases, for the t test and for the F test, the coefficient of linear regression (b) was not significantly different from the unit, indicating the fitting of the data to the model and absence of epistasis in the control of SDS resistance in all the traits evaluated. However, all the values of r2 were below 90%, and all standard errors
were higher than 0.1. Thus, the influence of the environ-ment probably helped to mask the relationship ofW$ronV$r, making the assumptions of the model only marginally valid for some traits. According to Jinks and Hayman (1953), the reduction of the heterozygosity in the F2generation makes
it more difficult to detect anomalies in the data for the method, based on dominant genetic effects. Thus, the most probable causes of distortions could be the presence of multiallelism and the correlated distribution of genes among the parents. The occurrence of epistasis is not quite probable. This is because in studies with molecular markers (Njitiet al., 1998; Iqbalet al., 2001; Njitiet al., 2002), the
presence of epistasis between the markers linked to QRLs, which underlined the resistance to SDS, was not detected. The presence of multiallelism was shown by the use of the microsatellite markers Satt163, Satt309, Satt354, Satt371 and Satt570, but there is no certainty that this multiallelism in the loci of the markers corresponds to the occurrence of multiallelism in the loci responsible for the SDS resistance. The assumption that there is an independent distribution of genes among the parents may not be true. This is due to the fact that the M-2 line, one of the parents of Estrela, is a sis-ter line of Cristalina, and also because Cristalina could be the result of a natural crossing between UFV-1 and Davis, according to Spehar (1994). Thus, Cristalina and Conquista could have Davis as a common ancestor. According to Hay-man (1954a), a probable consequence of the presence of a correlated distribution of genes among the parents is the overestimation of the average degree of dominance, dis-cussed later.
Table 1- Goodness of fit of Jinks-Hayman’s additive-dominant model based on regression analysis ofW$
ronV$r.
t F = “t2”
Trait $b±sb r2(%) (H
0: b = 1) (H0: b’ = 0)
leaflet severity (LDS) 0.74±0.20 82.0*1/ -1.30ns 0.69ns
leaflet disease index (LDX) 0.43±0.23 52.0ns -2.45ns 1.94ns
plant severity (PDS) 0.80±0.18 86.7* -1.08ns 0.49ns
plant disease index (PDX) 0.50±0.24 59.8ns -2.07ns 1.45ns
1/Result of the variance analysis of the linear regression model.
* and **: significant at the 5% and 1% levels, respectively, by F test.
The results of the analyses of variance of the additive and dominance genetic components are shown in Table 2. For all traits, highly significant effects were observed for the “a” source of variation (additive genic effects). The “b” source of variation (dominant genetic effects) also showed highly significant effects (p < 0.01) for the disease index (LDX and PDX) and only significant effects (p < 0.05) for the severity of the foliar symptoms (LDS and PDS). This indicates that the additive and dominant genetic effects contributed to the control of the SDS resistance for all traits. However, the dominant genetic effects were more intense for the disease index than for the severity of the disease.
The “b1” component was highly significant for all the
traits, except for severity based on the leaflet with more in-tense symptoms (LDS) (Table 2). The significance of the “b1” component indicates that the dominance was
predomi-nantly in one direction (Ramalhoet al., 1993). Since the
av-erage of the F2populations was always lower than that of
the average of the parents (data not shown), it was con-cluded that the dominance deviations occurred in the direc-tion of an increase in the SDS resistance (Fronza, 2003).
The “b2” component was significant for the disease
index (LDX and PDX) and showed a tendency toward sig-nificance (p < 0.10) for the severity of the foliar symptoms (LDS and PDS) of the SDS (Table 2). Thus, there was evi-dence that some parents had a greater ratio of dominant al-leles than others. This implies in the presence of asymmetry
in the distribution of favorable and unfavorable alleles among the parents (Hayman, 1954b). According to Ramalhoet al.(1993) this means that there was evidence
that some parents had a significantly better performance than others, when considering the average of crosses in which each one participated.
The estimates of the genetic components D, H1, H2
and F, and the respective standard errors are shown in Table 3. The standard errors of the genetic components were generally high and the significance of the effects of these components for each trait did not always follow the results of the variance analyses (Table 2), considered to be more accurate. The absence of significant effects of the ad-ditive genetic component D, which was statistically equal zero (Table 3), in contrast to that observed for the “a” source of variation (Table 2), was the main discrepancy found.
In general, the additive and dominant genetic effects explained the differences between the treatments. It was also observed that the dominant genetic effects were higher for the disease index (LDX and PDX) than for the severity (LDS and PDS) of the foliar symptoms, since in the vari-ance analyses the effect of the “b” source of variation was highly significant (p < 0.01) only for the calculated disease index (Table 2). On the other hand, only for severity (LDS and PDS) were the estimates of D higher than the respective
Table 2- Analysis of variance of the diallel tables for the evaluated traits.
Sources of variation Mean squares
DF LDS LDX PDS PDX
Treatments 14 0.195463** 150.63** 0.186379** 135.38** a 4 0.475577** 267.27** 0.481969** 259.11**
b 10 0.083417* 103.97** 0.068143* 85.89**
b1 1 0.233307* 382.78** 0.256040** 365.40**
b2 4 0.091180 103.21** 0.063778 79.04*
b3 5 0.047229 48.82 0.034055 35.47
Pooled error 335 0.041172 30.12 0.033916 24.83 * and **: significant at the 5% and 1% levels, respectively, by F test.
Table 3- Estimates of genetic components of variation of Jinks-Hayman’s additive-dominant model with standard errors. Estimates±standard errors1/
Traits D$ H$
1 H$2 F$
LDS 0.1380±0.0705 0.6874*±0.1494 0.5575**±0.0867 -0.2334±0.1755
LDX 23.00±91.03 1127.81*±192.85 901.90**±111.84 -218.75±226.49
PDS 0.1476±0.0533 0.4753*±0.1130 0.4160**±0.0655 -0.2523±0.1327 PDX 27.74±72.35 879.35*±153.28 718.39**±88.90 -223.53±180.02
1/The standard errors of the estimates were calculated according to Hayman (1958) and corrected to half diallel tables based on Ferreira (1985).
standard errors, though not significantly higher than zero (Table 3).
The estimates of the genetic component F were gener-ally a little higher than the standard errors, but always nega-tive. Thus, even if no estimate of the genetic component F was significantly different from zero, this frequency of neg-ative values could be an indication of the predominance of recessive alleles in the group of parents. This is according to the level of resistance of the parents and is another indi-cation that dominant alleles control the SDS resistance in this group of parents. The “b2” source of variation was
sig-nificant for the disease index (LDX and PDX, Table 2), and indicates differences in the ratio of dominant and recessive alleles among the parents. This also may be an indication that the parents considered to be resistant (Forrest and Conquista) show greater concentration of dominant alleles than the others.
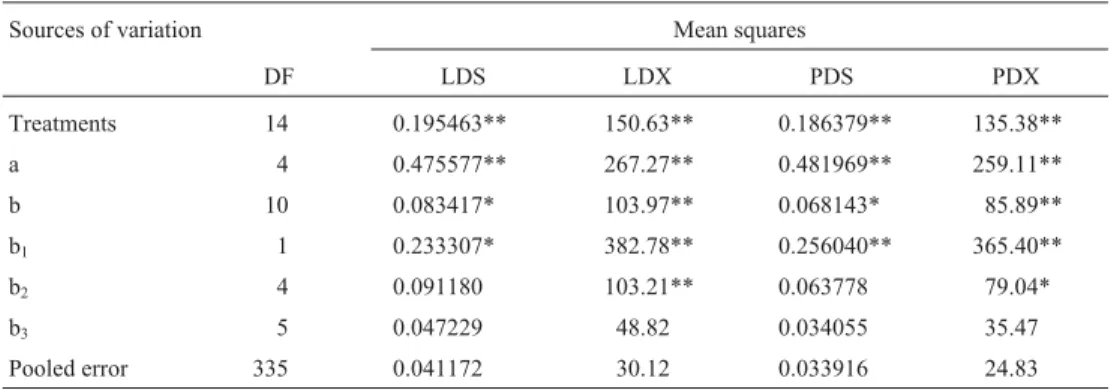
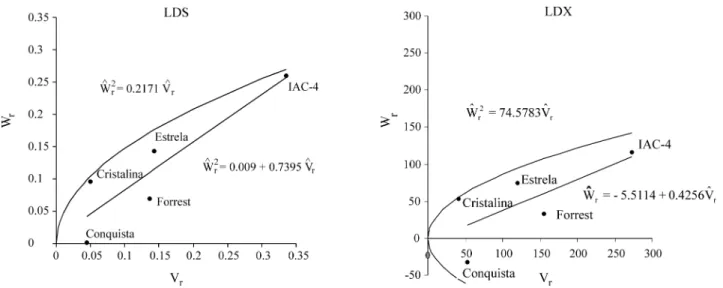
The values obtained for the average degree of domi-nance (add)$ , in general, were very high (Table 4). This dem-onstrated the presence of overdominance, which also was shown by the intercept point between the regression straight line and the covariance axis (Figures 1 and 2),i.e., below origin or below “AB/2”, according to Singh and Singh (1984b); “A” is the point of intersection of the straight line of regression with the covariance axis and “B” is the point of intersection of the parallel straight line to the straight line of regression and tangent to the limiting parab-ola with the covariance axis. For the previously commented results on the analyses of variance (Table 2) and the esti-mates obtained for the genetic components (Table 3) and the graphs (Figures 1 and 2), the existence of dominance in the control of the SDS resistance in this experiment was confirmed. However, the values of the average degree of dominance seem to be overestimated (Table 4), especially for the disease index of the foliar symptoms (LDX and PDX). According to Ferreira (1988), the equations of the genetic components of the original method of Jinks-Hayman (Jinks and Jinks-Hayman, 1953; Jinks-Hayman, 1954a; Jinks, 1954) led to overestimates of the values of D and H1,
caus-ing an 85% overestimation in the average degree of domi-nance in a 6 x 6 diallel. According to Hayman (1954a), Nassar (1965), and Ferreira (1988), the correlated distribu-tion of the genes in the parents would be the cause of
over-estimates in the average degree of dominance. However, the exclusion of Cristalina for suspicion of correlated distri-bution of genes with Conquista and Estrela decreased the value of the average degree of dominance by 20% only for the disease index (LDX and PDX) (Fronza, 2003). This ex-clusion also increased the value of the angular coefficient (b) and the “r2” of the model of regression for this trait, but
did not improve the fitting of the severity (LDS and PDS) data to the model.
The ratio of the total number of dominant and reces-sive alleles in the parents (K / K$D $R) was always lower than 1.0 (Table 4), indicating a higher frequency of recessive al-leles in the parents. This result is in accordance to the trend observed for the estimates of the genetic component F, al-though none of the F estimates was significantly different from zero (Table 3).
The product of the average frequencies of the positive and negative effects of the alleles in the loci where domi-nance occurs (µv), indicated the presence of small
asymme-try in the distribution of the positive and negative alleles in the parents (Table 4). This is in accordance to the result al-ready shown by the significance of the “b2” source of
varia-tion (Table 2).
The number of effective factors (N) varied between$ 2.01 and 2.95 (Table 4). The estimate was higher when the severity was based on the general appearance of the plant in the evaluation of the foliar symptoms of the SDS (PDS). The results indicated that there are at least two or three loci (or genic blocks) that show dominance and confer resis-tance to the manifestation of the SDS foliar symptoms. This character is probably controlled by a large number of loci because additive genic effects were also found (Table 2). In studies with molecular markers, even in field assessments, seven QRLs underlying the SDS resistance were detected (Changet al., 1996; Hnetkovskyet al., 1996; Iqbalet al., 2001; Njitiet al., 2002; Triwitayakornet al., 2002). In most all of these studies, Forrest was used as the resistant parent, presenting five out of seven QRLs found: linked to molecu-lar markers Satt080, Satt163, Satt309, Satt570 and OE021000. This confirms the underestimation of the number
of loci that controlled the SDS resistance in the present study, where Forrest was also used. Moreover, there may have been other QRLs underlying the SDS resistance in the
Table 4- Estimates of genetic parameters, dominance decreasing order and coefficient of correlation between the favorable alleles and dominance (r).
Genetic parameters Dominance decreasing order1/
Traits add$ K$ /K$
D R µv N$ h$ns2 h$bs2 r
LDS 2.23 0.45 0.20 2.01 0.58 0.90 CO, CR, FO, ES, I4 0.61 LDX 7.00 0.19 0.20 2.04 0.48 0.95 CO, CR, FO, ES, I4 0.65 PDS 1.80 0.35 0.22 2.95 0.62 0.91 CO, CR, FO, ES, I4 0.66 PDX 5.63 0.17 0.20 2.44 0.51 0.95 CO, CR, FO, ES, I4 0.66
1/Increasing order ofW$ V$
other parents that were included in this study. This is due to the fact that alleles of resistance can be present either in SDS-resistant or -susceptible parents, as already demon-strated (Changet al., 1996; Hnetkovskyet al., 1996; Njitiet al., 1998; Iqbalet al., 2001; Njitiet al., 2002). In this way,
by the molecular analysis, at least one more QRL, linked to the molecular marker Satt354, was present in the Conquista and Cristalina cultivars. This QRL was the same one found in the susceptible cultivar Essex, in the study by Iqbalet al.
(2001), because Essex was used as a check in the present study.
The values of the narrow-sense heritabilityh$
ns 2 were
about 10% higher when the severity of the foliar symptoms of SDS (LDS and PDS) was considered (Table 4). But the values of the broad-sense heritabilityh$bs2 were about 5%
lower for the severity of the foliar symptoms of the SDS
(LDS and PDS), indicating that severity was just a little more affected by the environment than the disease index. The differences observed between the narrow and broad-sense heritabilities reflected the presence of the dom-inant genetic effects on the control of the SDS resistance. The high values obtained for both heritabilities were due, probably, to the large number of replications used, since these heritabilities were estimated on plot means.
The dominance order of the parents was always the same: Conquista, Cristalina, Forrest, Estrela, and IAC-4 (Table 4). The regression graphs (Figures 1 and 2) also showed that Conquista and IAC-4 have the highest and lowest concentrations of dominant alleles, respectively. However, among the other three parents, with intermediate positions in the graphs, it would be necessary to consider the distance of each one from the origin. With regard to the severity of the foliar symptoms (LDS and PDS), Cristalina
Figure 1- Regression of Wron Vrfor severity (LDS) and disease index (LDX) of the SDS foliar symptoms based on the leaflet with the most intense
symptoms.
and Forrest were relatively similar, and they showed more dominant alleles than Estrela; however, for the disease in-dex (LDX and PDX), Estrela and Forrest were similar, and showed fewer dominant alleles than Cristalina.
The relation between the favorable alleles and domi-nance (r) indicated that the lower values of severity and dis-ease index of the foliar symptoms of the SDS were correlated with the lower values ofW$r +V$r(Table 4),i.e., a
higher concentration of dominant alleles. This was also shown by the position of the parents in the regression graphs (Figures 1 and 2). The values of “r” were not close to 1.0, and the decreasing order of dominance and the position of the parents in the regression graphs were somewhat dif-ferent from the expected. So, it may be that recessive alleles may also have contributed to the control of the manifesta-tion of the foliar symptoms of the SDS in the group of cultivars studied.
It was concluded that the resistance of the soybean to the SDS, caused byF. solanif.sp.glycinesand measured by
the foliar symptoms of the disease, was inherited quantita-tively and controlled mainly by dominant genetic effects. This suggests that the evaluations for the selection of more resistant genotypes to the SDS must be done at advanced generations of inbreeding. For these evaluations, only the severity of the foliar symptoms of the SDS, based on the scale (1-5) used in this study showed itself to be appropri-ate. The use of molecular markers linked to the QRLs of the SDS can also be of great aid in the choice of parents with different alleles of resistance, making the QRL pyramiding possible.
Acknowledgements
The authors would like to thank: FAPESP for finan-cial support; CNPq for the fellowships granted; the re-searchers of the Embrapa Soja (Londrina-PR), Dr. Leones A. Almeida for sending the seeds of the cultivars used, and Dr. José Tadashi Yorinori, for the SDS-5 isolate; Janice I.H.V. Pinto, an undergraduate student from the Agro-nomic Engineering course at ESALQ/USP, for her help during the evaluations; and Ângela C.A. Lopes, for supply-ing the first version of the electronic spreadsheet used in the diallel analyses.
References
Balardin RS and Rubin SAL (1999) Reação de germoplasma de soja àFusarium solanif.sp.glycines. Congresso Brasileiro de Soja, Londrina, PR, Brazil, p 461.
Chang SJC, Doubler TW, Kilo V, Suttner R, Klein J, Schmidt ME, Gibson PT and Lightfoot DA (1996) Two additional loci un-derlying durable field resistance to soybean sudden death syndrome (SDS). Crop Sci 36:1684-1688.
Cruz CD and Regazzi AJ (1997) Modelos Biométricos Aplicados ao Melhoramento Genético. 2nd edition. UFV, Viçosa, 390 pp.
Ferreira PE (1985) On Jinks-Hayman’s analysis of half diallels. Braz J Genet 8:149-155.
Ferreira PE (1988) A new look at Jinks-Hayman’s method for the estimation of genetical components in diallel crosses. He-redity 60:347-353.
Fronza V (2003) Genética da reação da soja aFusarium solani
f.sp.glycines. PhD Thesis, Escola Superior de Agricultura “Luiz de Queiroz”, Universidade de São Paulo, Piracicaba, SP, Brazil. (http://www.teses.usp.br/teses/disponiveis/11/ 11137/tde-19052003-160041/publico/vanoli.pdf)
Hartman GL, Huang YH, Nelson RL and Noel GR (1997) Germplasm evaluation of Glycine max for resistance to Fusarium solani, the causal organism of sudden death
syn-drome. Plant Dis 81:515-518.
Hayman BI (1954a) The theory and analysis of diallel crosses. Genetics 39:789-809.
Hayman BI (1954b) The analysis of variance of diallel tables. Biometrics 10:235-244.
Hayman BI (1958) The theory and analysis of diallel crosses. II. Genetics 43:63-85.
Heavner DL, Nickell CD and Kolb FL (1996) Genetic analysis of the response of the soybean cultivar Asgrow A4715 to
Fusarium solani. Soybean Genet Newslett 23:144-148. Hnetkovsky N, Chang SJC, Doubler TW, Gibson PT and
Lightfoot DA (1996) Genetic mapping of loci underlying field resistance to soybean sudden death syndrome (SDS). Crop Sci 36:393-400.
Iqbal MJ, Meksem K, Njiti VN, Kassem MA and Lightfoot DA (2001) Microsatellite markers identify three additional quantitative trait loci for resistance to soybean sudden-death syndrome (SDS) in Essex x Forrest RILs. Theor Appl Genet 102:187-192.
Jinks JL (1954) The analysis of continuous variation in a diallel cross ofNicotiana rusticavarieties. Genetics 39:767-788. Jinks JL and Hayman BI (1953) The analysis of diallel crosses.
Maize Genet Coop News Lett 27:48-54.
Jones RM (1965) Analysis of variance of the half diallel table. He-redity 20:117-121.
Mather K and Jinks JL (1982) Biometrical Genetics: The Study of Continuous Variation. 3rd edition. Chapman and Hall, Lon-don, 396 pp.
Nassar RF (1965) Effect of correlated gene distribution due to sampling on the diallel analysis. Genetics 52:9-20. Njiti VN, Doubler TW, Suttner RJ, Gray LE, Gibson PT and
Lightfoot DA (1998) Resistance to soybean sudden death syndrome and root colonization by Fusarium solanif.sp. glycinesin near-isogenic lines. Crop Sci 38:472-477.
Njiti VN, Meksem K, Iqbal MJ, Johnson JE, Kassem MA, Zobrist KF, Kilo VY and Lightfoot DA (2002) Common loci under-lie field resistance to soybean sudden death syndrome in Forrest, Pyramid, Essex, and Douglas. Theor Appl Genet 104:294-300.
Ramalho MAP, Santos JB and Zimmermann MJO (1993) Genética quantitativa em plantas autógamas: aplicações ao melhoramento do feijoeiro. UFG, Goiânia, 271 pp. Ringler GA and Nickell CD (1996) Genetic resistance to
Fusarium solaniin Pioneer Brand 9451 soybean. Soybean Genet Newslett 23:149-154.
Santos JB (1984) Controle genético de caracteres agronômicos e potencialidades de cultivares de feijão (Phaseolus vulgaris
Su-perior de Agricultura “Luiz de Queiroz”, Universidade de São Paulo, Piracicaba, SP, Brazil.
Schuster I (1999) Identificação de QTL para resistência ao nema-tóide de cisto da soja e capacidade de combinação de geni-tores. PhD Thesis, Universidade Federal de Viçosa, Viçosa, MG, Brazil.
Sing RK and Chaudhary BD (1979) Biometrical methods in quan-titative genetic analysis. 2nd edition. Kalyani Publishers, New Delhi, 304 pp.
Singh M and Singh RK (1984a) Some theoretical aspects of analy-sis in half diallel. Biom J 26:63-68.
Singh M and Singh RK (1984b) Hayman’s graphical analysis in segregating generations of a diallel cross. Biom J 26:69-74.
Spehar CR (1994) Breeding soybeans to the low latitudes of Bra-zilian cerrados (savannahs). Pesq Agropec Bras 29:1167-1180.
Stephens PA, Nickell CD and Kolb FL (1993) Genetic analysis of resistance toFusarium solaniin soybean. Crop Sci
33:929-930.
Toledo JFF and Kiihl RAS (1982) Métodos de análise dialélica do modelo genético em controle das características dias para floração e número de folhas trifolioladas em soja. Pesq Agropec Bras 17:745-755.
Triwitayakorn KT, Jamai A, Schulz J, Iqbal J, Meksem K, Town C and Lightfoot DA (2002) Genomic approaches to molecu-lar breeding of resistance to soybean sudden death syndrome and cyst nematode in elite cultivars. Embrapa Soja. Anais do II Congresso Brasileiro de Soja, Foz do Iguaçu, PR, Brazil, pp 70-71.