1
A Work Project, presented as part of the requirements for the Award of a Masters Degree
in Finance from the Faculdade de Economia da Universidade Nova de Lisboa.
The Impact of SFAS 123R on
CEO Equity Compensation
Rosana Inês Hipólito Quartin
Student Number 92
Professor Ana Marques
2
The Impact of SFAS 123R on CEO Equity Compensation
Abstract
In December of 2004, FASB released SFAS 123R, mandating the expensing of
executive stock options. This paper studies the changes that occurred in CEO equity
compensation in the period of 2000 to 2006. Complementary, I analyze the relevance of
performance conditions in this form of compensation. There are two main findings: (i)
in the post-SFAS 123R period executive stock options determinants become different
(ii) the use of performance equity grants contributes to the decrease of traditional stock
options, since the use of these type of grants has a statistically impact in the decrease of
traditional stock options grants between 2006 and 2003. There are also two side-results:
(i) before SFAS 123R stock options drivers were explaining CEO total compensation, in
the post-rule period total compensation drivers became less similar to stock options
ones (ii) there is a significant difference between stock options and restricted stock
drivers, that persist even after SFAS 123R be introduced.
Keywords: SFAS 123R, Executive Stock Options, Restricted Stock, CEO Total
3
1. Introduction
In the 1990s there was an explosion of executive stock options grants as
compensation and incentive tools. Over this decade, the value of options granted
increased from an average of $22 million per company to $238 million per company by
2000. This increase has occurred across a wide range of industries but especially in
HiTech and Telecommunication firms (Hall and Murphy [2003]). Through this financial
instrument it was possible to align shareholders and managers interests without the need
to record the compensation expense on the firms’ financial statements. The combination
of a stock market in overdrive and favorable accounting treatment made stock options
the “crack cocaine of incentives” (Lavelle [2005]) and the lack of stock option
expensing created an uneven playing field for virtually all other forms of executive
compensation that required expensing (Murphy [2002]). Meanwhile, the financial press
started to question whether stock options rewarded executives for their own merit or for
the market success (Johnson and Tian [2000]). Consequently, firms initiated efforts to
tie compensation to performance more closely, using other forms of compensation, like
restricted stock grants and performance options.
The current accounting standard for stock options, which requires options
expensing, is SFAS 123R (Statement of Financial Accounting Standards No.123,
Revised). The main idea behind SFAS 123R is that expensing stock options enhances
the transparency of option-based compensation, making it harder for managers to use
them to hide their excessive pay (Core et al. [2003]). However, firms were not
interested in taking a hit to their earnings numbers and several firms have accelerating
the vesting periods of their outstanding options before the issuance of SFAS 123R
4
adds controversy to the long time debate on whether CEO compensation is the result of
inefficient pay without performance (Bebchuck and Fried [2004] and Core et al.
[2004]).
Empirical evidence suggests that in practice restricted stock has been rarely used
due to the previous stock options accounting advantages (Brow and Lee [2007] and
Carter et al. [2007]). The past infrequent use of restricted stock, even though various
models predict the preference for restricted stock over stock options (Lambert and
Larcker [2004]), calls for research in what concerns the impacts of SFAS 123R in the
choice between stock options and restricted stock, hence after this rule stock options no
longer have favorable accounting treatment.
The main objective of this paper is to investigate the change in factors associated
with firms’ decisions to grant stock options after the introduction of SFAS 123R. One of
the factors considered is the existence of performance conditions in new grants.
Concurrently, this study examines if these factors are also driving the decisions on
restricted stock grants and on CEO total compensation.
In my study I develop two main hypotheses. Hypothesis 1 states that the
determinants of stock options grants have changed after SFAS 123R, given that other
studies report a significant decrease in the use of stock options in anticipation of SFAS
123R (Brow and Lee [2007] and Carter et al. [2007]). In line with critics of traditional
options over the use of performance-based equity compensation, hypothesis 2 predicts
an increase in performance equity grants, associated with the decrease of traditional
stock options. I also test two side-results: (i) assuming that the overcompensation
problem in the U.S. was caused by the excess use of stock options, I assess whether
5
123R (ii) I investigate in what terms stock options and restricted stock drivers are
different, since there has been an abusive use of stock options and an infrequent use of
restricted stock.
I use a sample of 385 firms from the S&P 500 from 2000 to 2006, with
necessary data for Execucomp and Compustat variables and for Bebchuck
Entrenchment Index (Bebchuck et al. [2004]). Additionally, in order to analyze the
impact of performance equity grants, I use the Statement of Changes of Beneficial
Ownership of Securities (Form 4) that contains information about the type of options
and stock grants given to the companies’ CEOs1.
Empirical findings do not reject hypothesis 1 and reveal that the explanatory
variables for stock options use change after SFAS 123R. Results suggest that the
increase in option performance grants have a significant impact in the decrease of
traditional stock options which is consistent with hypothesis 2. As for the side-results, I
find evidence that stock options drivers do not explain the use of restricted stock; even
after SFAS 123R was introduced. Regarding CEO total compensation, hypothesized
stock options drivers were in fact explaining CEO total compensation, however after
SFAS 123R introduction CEO total compensation determinants became less similar to
stock options ones. Consistent with Carter et al. (2007) I find no evidence of an impact
of SFAS 123R on the level of CEO total compensation, only in the composition of total
compensation. In fact the composition of CEO compensation bears dramatic changes
upon mandatory expensing of executive stock options. In line with Brow and Lee
(2007) I find that after SFAS 123R there is a significant decrease in the use of stock
options as part of total compensation (- 21.0%), while CEO total compensation levels
6
remains the same and the other types of compensation, namely restricted stock, increase
their prevalence as part of CEO compensation (8.0%). These results are evidence for the
new rule potential to alter the effective design of CEO compensation that finally
demands more thought than simply awarding “plain vanilla” options.
This paper contributes to the existent literature by using 2 years of post-SFAS
123R data, by assessing changes in factors affecting stock options grants after the
issuance of SFAS 123R and analyzing the relevance of these factors on restricted stock
and total compensation. Furthermore, the paper also investigates the impact of
performance equity grants, which are seen as a more effective way to provide incentives
to executives, in the decrease of traditional stock options. This paper is close in spirit to
Carter et al. (2007) who study the role of accounting in the design of CEO equity
compensation by assessing the relevance of financial reporting concerns on stock
options, restricted stock and total compensation; and also examine the change in CEO
compensation levels upon voluntary decision to expense stock options. My paper
extends the past literature since I am able to ascertain the changes in CEO compensation
after SFAS 123R effective date of implementation for all companies, not only for
voluntary adopters, and also to investigate how stock options drivers (both types - real
economic drivers of stock options and the determinants associated to the past
accounting advantages) change after the new rule implementation and how they are
determining decisions on restricted stock and CEO total compensation. Complementary,
I analyze the impact of performance equity grants on the use of traditional stock
options, adding empirical evidence on the use of performance based pay in U.S. that is
limited contrary to the research on traditional stock options and restricted stock. Also,
7
change model that identifies factors driving stock options cut back upon mandatory
expensing, I aim at study the impact of SFAS 123R on equity-based compensation by
assessing the impacts of this rule in CEO equity compensation using different models to
assess the effect of changes in stock options determinants after SFAS 123R effective
date on stock options, restricted stock and total compensation.
This paper is organized as follows. Section 2 discusses relevant background
regarding SFAS 123R and previous literature. Section 3 presents the sample selection
and descriptive statistics. Sections 4 and 5 develop my two hypotheses, their variables
definitions, research designs and results. Section 6 shows complementary analysis and
section 7 concludes.
2. Background
2.1. SFAS 123R
Before the issuance of SFAS 123R, accounting for executive stock options was
ruled by Accounting Principles Board (APB) Opinion 25 and by SFAS 123. APB
Opinion 25 was first released in 1972, before the publication of the Black-Scholes
model and it motivated the use of the intrinsic value method to value executive stock
options on the option grant date.At the time, most of the firms were granting
at-the-money options since for such options the intrinsic value was zero and so there was no
compensation cost reported in firms’ income statements. This omission in financial
statements distorted financial conditions and operations of firms issuing executive stock
options (Choudhary [2006]). In 1995 FASB (Financial Accounting Standards Board)
issued SFAS 123. This accounting rule motivated the expensing of executive stock
options using the fair value method, but allowed the recognition of the intrinsic value,
8
their financial statements. FASB originally intended to require the fair value method,
but the opposition to this method was heavily intense and instead of following the
established standard companies continued to use the intrinsic value method presented in
APB Opinion 25. Finally, in December 2004, within the environment of financial,
accounting and backdating scandals, FASB approved SFAS 123R, which revised SFAS
123 and suppressed APB Opinion 25. Under SFAS 123R, firms are required to select a
valuation model to determine the fair value of executive stock options on the grant day
and to recognize this compensation expense in their income statements during the
vesting period of the options. The SFAS 123R effective date of implementation for
public entities that do not file as small business issuers was the beginning of the first
interim or annual reporting period that begins after June 20052.
There were four main reasons for SFAS 123R issuance: (1) FASB had to do
something in order to restore investors’ confidence in the transparency and in the high
quality of financial reporting; (2) in February 2004, International Accounting Standards
Board (IASB) issued a new standard that obligates the expensing of stock options by the
firms that use IAS (IFRS 2 – Share-based Payment), thus there was an urgent need to
improve the convergence and comparability of international accounting and financial
reporting; (3) simplifying the accounting principles by requiring a single method for
expensing executive stock options, so that all entities follow the same accounting
standard and (4) enabling the comparability of reported financial information by
eliminating the alternative accounting methods (SFAS 123R [2004]).
Opponents to the fair value method argued several reasons to avoid reporting
compensation expenses associated to stock options. First, that it may represent a hit to
9
the companies’ earnings, especially to high technology firms3. A research report by Credit Suisse First Boston in 2006 estimated that expensing of options compensation
cost would reduce the S&P 500 EPS estimate by approximately 3% and that sectors like
technology would be even more affected. Second, opponents defend that stock options
expensing would imply a decrease in stock options grants, for firms this means lower
capacity to attract, retain and motivate employees (CCG Investors Relations [2006]).
Finally, there is the inappropriate use of option pricing models for options that are not
marketable and are held by undiversified and risk-averse executives, as managers need
to estimate volatility as an input to the option pricing models.
Firms’ reactions to the discussion on the need to expense stock options were
diverse. Many firms voluntary expensed stock options before SFAS 123R was
approved. Coca-Cola, Ford, General Electric, McDonald’s, Microsoft and PepsiCo are
among the companies that have expensed stock options early, aiming to appear “socially
responsible at a time when corporate credibility was being widely questioned” (The
2006 TOP 250: “Long term incentives and grant practices for executives”)4. Others
have accelerated the vesting of their options in order to avoid recognizing fair value
expense in the future financial statements5. Choudhary (2006) finds that accelerating vesting initiatives were especially prevailing and had a negative stock price reaction in
companies with bad corporate governance, since investors perceived such transactions
as managerial intent to deceive shareholders for managers’ private benefit. Furthermore,
3 “Many Silicon Valey companies still see stock options as a vital part of the entrepreneurial culture they seek to foster.” (Said [2006]).
4 General Electric, for example, has trimmed its equity grants from 47 million shares in 2002 to 38 million in 2003 by replacing 60% of its options grants with restricted stock, since stock is more valuable than options, thus firms can grant fewer shares, reducing the dilution cost to shareholders (Lavelle [2005]).
10
accelerating vesting was less predominant in firms that voluntary recognized options
expense earlier. The expensing anticipation and the accelerating vesting movements
occurred mainly during 2003 and 2004, which are considered the SFAS 123R
transaction years (Carter et al. [2007] and Brown and Lee [2007]).
2.2. Literature Review
Empirical evidence suggests that the accounting advantage of executive stock
options has led firms to use them instead of other forms of compensation, seeking the
reduction of compensation expense to boost reported earnings and not to take advantage
from the real economic benefits of options such as motivation and retention of
employees. Brown and Lee (2007) show a reduction in abnormal compensation and an
improvement in operating performance after stock options cutbacks. The motivation for
the past behaviors were the pre-SFAS 123R equity incentives that tempted managers to
increase stock prices in the short run hunting for higher earnings, changing financial
reporting statements that modified real economic transactions and led to the loss of real
economic value (Choudhary [2006]). To meet earnings benchmarks, managers altered
the proportion of compensation from options under the so famous “accounting subsidy
to stock options” and generated an excess use of stock options (Bodie et al. [2003]).
There are those who defend the disposal of stock-based compensation and the existence
of compensation on the basis of real and long term earnings growth as if firms were not
publicity traded (Martin [2003]).
Empirical evidence also suggests that in practice restricted stock was rarely used
due to mangers obsession for stock options’ favorable accounting treatment. Carter et
al (2007) find results confirming that financial reporting costs played a significant role
11
treatment for stock options led to a preference use of options and to a lower use of
restricted stock. Hall and Murphy (2002) also suggest that an important missing factor
in existing models of the choice between stock options and restricted stock was the
favorable accounting treatment for stock options.
One can think that, while the abusive use of stock options means lower reported
expenses it was also costly, because, due to risk aversion managers demand a higher
risk premium for receiving stock options, valuing stock options below their true
economic cost for the firm (Hall and Murphy [2002]). On the contrary, Hodge et al.
(2006) prove that on average managers overvalue stock options relative to the
Black-Scholes value and to the fair value equivalent restricted stock grant.
After the issuance of SFAS 123R, there is no longer an uneven playing field for
stock options and firms are shifting away from stock options towards restricted stock
and performance awards. Brown and Lee (2007) show that, on average, firms cut back
stock options for their top five executives by 30% in 2005 and that companies are more
likely to replace stock options with restricted stock in the post-expensing period. These
results suggest that firms took advantage of stock options preferential accounting
treatment to window dress financial statements in the pre-expensing period.
Nonetheless, other authors (Yermack [1995] and Bryan et al. [2000]) detect no evidence
of a relation between financial reporting costs and the use of stock options. Also, while
the financial press claimed that firms, in response to SFAS 123R, replaced executive
stock options by restricted stock or cash (Said [2006]), some financial economists
questioned whether stock options new accounting treatment affects options-based
compensation, since before the issuance of SFAS 123R investors and analysts already
12
Additionally, investors, academics and boards members have manifested their
apprehension regarding the insufficient incentives around stock options and restricted
stock awards with simple time vesting provisions6. This has led critics of traditional stock options and activist stakeholders to suggest that both option and stock awards
should contain performance-based vesting conditions, based on managers’ capacity to
reach certain targets as stock market, accounting, or other performance targets, (an
index or a comparison group, in the case of relative performance measures). Several
studies have proved that on theory performance options are better in incentives,
management retention and gauging managerial talent, since only high talent managers
will be willing to take this kind of risk (Johnson and Tian [2000], Arya and Mittendorf
[2005] and Bettis et al. [2008]). However, empirical evidence in this field is
inconclusive. Gerakos et al. (2005) shows that performance options are used by firms
with weak corporate governance to minimize the criticism around the issuance of large
grants of stock options to deceive stakeholders rather than to improve managerial
incentives, through the use of easily achievable performance targets. Contrary, the
results of Bettis et al. (2008) tend to reject this “stakeholder-placation” theory in favor
of incentive, retention and gauging managerial talent theories.
3. Sample and Descriptive Statistics7
Panel A of Table 1 shows how the final sample was reached. I start with 3,189
observations from Execucomp, which correspond to the period of 2000 until 2006 for
the S&P 500 firms. I next exclude 221 observations because of missing data from
6 See Bebchuck and Fried (2004) for a critique of simple time vested equity awards. Furthermore, Warren Buffet postulated on the state of affairs in his 1998 letter to shareholders: "Though options, if properly structured, can be an appropriate, and even ideal, way to compensate and motivate top managers, they are more often wildly capricious in their distribution of rewards, inefficient as motivators and inordinately expensive for shareholders." Finally, CalPERS (2003) states that it will not support any executive compensation plan that does include a significant part of performance or indexed options.
13
Compustat and 273 observations because of missing corporate governance data
(Bebchuck Entrenchment Index). The sample consists of 2,695 observations, which
comprise data for 385 firms.For each of these 385 firms on each year the compensation
data is referent to the firms’ CEOs.The industry classification is displayed in Panel B of
Table 1 where I segregate the sample firms according to Execucomp industry variable
SPINDEX, which is the four-digit code that identifies the companies’ industry sector.
The sample firms comprehend 24 different industries. Capital Goods (8.3%), Utilities
(7.8%) and Energy (7.3%) are the industries with higher weight on the sample,
Automobiles & Components (0.5%) and Real State (0.8%) are the least prevalent
industries. Columns 5, 6 and 7 exhibit the mean industry changes on stock options,
restricted stock and total compensation between the pre and post-SFAS 123R periods.
As pre-SFAS 123R period I consider the mean values from 2000, 2001 and 2002 and
for the period post-SFAS 123R I count with the mean values from 2005 and 2006. This
way I take out the anticipation and accelerating vesting effects occurred in 2003 and
20048. Columns 8 and 9 present the change on the ratio of stock options over total
compensation and on the ratio of restricted stock over total compensation.
Telecommunication Services (-83.5%), Technology Hardware & Equipment (-83.0%)
and Media (-74.6%) are the industries with larger decreases in the value of stock options
grants. These results were expected since “Silicon Valey” firms were the ones using
stock options in excess (Said [2006]). The average industry change in stock options for
the sample is -35.0%, which is evidence for the expected decrease in stock options
14
grants after SFAS 123R. Regarding the change in restricted stock grants, there is a wide
variation across the industries, since the majority of sample firms increase significantly
the restricted stock grants and even initiate this types of grants only after SFAS 123R.
The sample average of changes in restricted stock grants is 402.0%. This number is
strongly influenced by the change in the Semiconductors & Semiconductor Equipment
industry, which was of 5,642.5%. The sample mean industry changes in total
compensation is 13%, which represents an increase in total compensation after the
implementation of SFAS 123R. Concerning the last two columns, the average industry
percentage change of stock options as part of total compensation declines 21.0% and the
average industry percentage change on the ratio of restricted stock over total
compensation increases 8.0%, thus after SFAS 123R the distribution of CEO total
compensation components changes.
Table 2 presents descriptive statistics on the sample. Panel A shows the means
for stock options, restricted stock and total compensation for the pre and post-SFAS
123R periods and also the mean for the percentage of stock options and restricted stock
over total compensation9. The differences in stock options and restricted stock means are statistically significant, and in line with Brown and Lee (2007) findings, reveal a
decrease in the use of stock options and an increase in the use of restricted stock, after
SFAS 123R. Consistent with Carter et al. (2007) the difference in the mean of total
compensation is not significant, indicating that the passage of SFAS 123R is not
associated with a change in total compensation levels. The mean change in the
percentage of stock options as part of total compensation from 53.7% to 28.6% in the
post-SFAS 123R period is significant and the increase in the weight of restricted stock
15
on total compensation from 7.9% to 15.4% is also significant, which is evidence for the
change in CEO total compensation distribution after SFAS 123R.
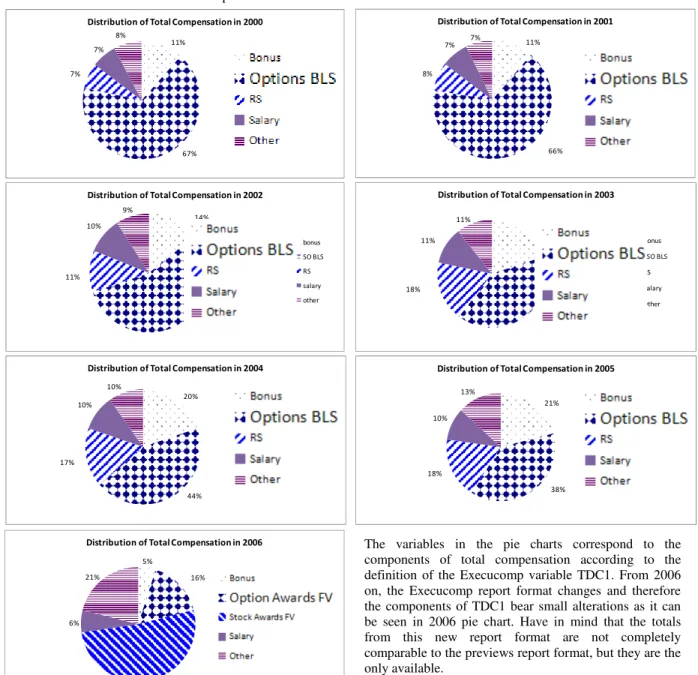
Panel B of Table 2 illustrates the evolution of CEO total compensation from
2000 to 2006, segregating the percentages of total compensation in stock options,
restricted stock, bonus, salary and the remaining components of total compensation
grouped and named as other10. In 2000 CEO total compensation was mainly made of
stock options (67.0%), while bonus (11.0%), salary (7.0%), restricted stock (7.0%) and
other components (8.0%) constituted small percentages of total compensation. During
2001 and 2002 the distribution of total compensation bear small alterations, but from
2003 on, the constitution of total compensation is considerably different. Throughout
the sample years, stock options lose weight on total compensation and the other
components of total compensation increase their prevalence, specially restricted stock.
In 2006 stock options represents only 16.0% of total compensation, while stock awards
counts for 52.0%.
Panel C of Table 2 exhibits descriptive statistics for the variables used in the
empirical models, for the entire sample period. These statistics indicate a diversified
sample, where for instance the mean (median) for T_ Assets is $35,800,000 thousand
($9,402,160 thousand) and the correspondent standard deviation is $109,000,000
thousand. The mean (median) for stock options grants is $5,080 thousand ($2,480
thousand) and the mean (median) for restricted stock grants is $1,153 thousand ($0
10 In Panel B of Table 2, Total Compensation (Execucomp variable TDC1) from 2000 to 2005 comprises the following: Total Value of Stock Options Granted using the Black-Scholes Value (Options BLS), Total Value of Restricted Stock Granted (RS), Salary, Bonus and Other.
16
thousand) since the prevalence of restricted stock is fairly small in the first sample
years.
Panel D of Table 2 presents the Pearson and Spearman correlation matrixes of
the stock options models’ variables. The correlations reveal that some of these variables
have unexpected signs11. The Spearman correlations signs of independent variables with
stock options that are statistically different from the predict signs hypothesized in
Appendix A are 1YrReturn and E_Index. Regarding the Pearson correlation
coefficients, E_Index shows a sign correlation with stock options contrary to the
predictions. Nevertheless, it is the use of OLS regressions in the subsequent models that
establishes the significance of these correlations with stock options.
4. The Change in Factors Explaining the Use of Executive Stock Options
4.1. Hypothesis Development and Variable Definitions
The main objective of this paper is to investigate the change in factors associated
with firms’ decisions to grant stock options after the introduction of SFAS 123R. For
this purpose, I identify different factors which I believe influence firms’ decisions to
grant executive stock options in the period before SFAS 123R and then assess whether
they continue to drive stock options use in the post-SFAS 123R period. These factors
can be classified into two groups: (i) justified real economic benefits of stock options,
the relevance of which I expect to increase and (ii) factors associated with the excess
use of options due to the previous accounting advantages - in this case, I hypothesize
these factors will lose importance after the effective date of SFAS 123R. Therefore
hypothesis 1 is, in alternative form:
17
H1: The factors explaining the use of executive stock options change after SFAS
123R is introduced.
I next discuss how I expect the relevance of the factors identified as
determinants of compensation via stock options to change from the pre-SFAS 123R
period to the period after the new rule. I provide a summary of stock options
determinants and their expected associations to stock option grants in Appendix A.
Financial Reporting Concerns - As discussed above, the past accounting
advantage of executive stock options led firms to use them instead of other forms of
compensation to reduce reported compensation expense and to boost reported earnings.
Previous literature as identified the need to access capital markets and the need to meet
debt covenant as circumstances under which firms became particularly concerned about
earnings reporting (Carter et al. [2007]). Based on this I use as proxy for costs of
reporting low earnings the extent to which the firm has access to equity and debt
markets (Access_Equity and Access_Debt). I expect firms with higher financial
reporting concerns to have an excessively high use of executive stock options to boost
earnings in the pre-SFAS 123R period. However, after SFAS 123R I expect financial
reporting concerns to became a minor driver of executive stock options.
Financial Constraints - Equity compensation requires no cash outlay, thus firms
with lack of liquidity and cash constraints tend to use equity compensation to conserve
cash, namely stock options, as instruments to motivate and retain employees (Core and
Guay [1999]). Following Core and Guay (1999), I measure cash constraints
(Cash_Cons) as common and preferred dividends minus cash flow from investing and
operating activities, scaled by total assets. Also, prior studies argue that there are tax
18
options exercise (Bryan et al. [2006]). So, I expect that firms with higher net loss carry
forwards (TLCF) are not likely to use stock options, in order to take immediate tax
deduction from cash compensation. I expect these two variables to be relevant for stock
options use in both periods but especially in the post-SFAS 123R period.
Agency Costs and Tenure - The higher the CEO stock ownership the lower is the
agency cost problem and therefore the lower is the need for additional
shareholder-manager alignment. Thus, firms with higher CEO stock ownership (CEO_Ownership)
are expected to award fewer equity compensation grants (Choudhary et al. [2006]).
Following Bryan et al. (2000) I include the firms’ ratio of debt to assets (Debt_Assets)
in my equations to mitigate the agency cost of debt. I expect a negative relation between
debt to assets and stock options grants, since high leveraged firms have natural
incentives and so there is less need for incentive-based compensation. Risk-averse
CEOs are expected to prefer cash compensation over equity compensation. The higher
the length time the CEO is in the company less risk-averse he tends to be since he feels
more stable and secure [Carter et al. (2007)]. To proxy CEO tenure I use the number of
years of credited service under the firm pension plan (Service_Years) and CEO age
(Age). I expect these four variables to be relevant both in the pre and post-SFAS 123R
periods.
Firm Performance - According to Murphy (1985) executive compensation is
positively correlated with firm’s performance, thus I expect a positive relation between
firm performance and stock options. For measure of the firm performance in the capital
markets I use the year earnings per share diluted including extraordinary items (EPS)
and one year return to shareholders (1YrReturn). Another reason for the use of these
19
correspondent reaction in the value of stock options that uses that stock as underlying
asset. I expect both variables to be relevant both in the pre and post-SFAS 123R
periods.
Governance - Better governed firms are expected to use stock options for their
justified real economic benefits and not driven by the accounting advantages of the
pre-expensing period that allowed mangers to use stock options to hide their excessive pay
(Core et al. [2003]). As a governance measure I use the Bebchuk Entrenchment Index
(E_Index), which is a governance measure that identifies six provisions negatively
correlated with firm valuation12. If the real reason to grant stock options by poorly
governed firms is that options represent excess pay that does not depress earnings then,
I expect bad governance to be positively associated with stock options grants in the
pre-expensing period but after SFAS 123R be introduced I expect this variable loses
significance.
Standard Economic Determinants - In larger firms it is difficult to monitor the
actions of managers and so it is likely the use of mechanisms to align management and
shareholders interests, therefore I expect larger firms to grant more stock options. To
control for the firm size I use the total assets of the firm (T_Assets). When firms have
higher growth opportunities the use of equity compensation is an important instrument
to incentive managers towards the increase in firm value, similar to Carter et al. (2007) I
use book to market ratio (BMratio) as a proxy for growth opportunities, the higher the
BMratio the lower are the firms’ growth opportunities. Thus, I expect a negative
relation between this variable and stock options. Following Gerakos et al. (2005) I use
the level of investment relative to competitors in the same industry (Rel_Investment) to
20
establish if the use of stock options is higher when firms have investment levels lower
than competitors or if firms decrease the use of stock options when firms’ investment
levels are higher than competitors’ levels. So, I expect a negative relation between stock
options and this variable.
4.2. Research Design
I test hypothesis 1 by estimating two different models, a Pooled Model and a Pre
vs. Post-SFAS 123R Model. Using the Pooled Model, that comprises values from 2000
to 2006, I am able to assess the factors that where determining executive stock options
grants in the entire sample period and introduce interaction effects to test the changes
that occurred after SFAS 123R be introduced. As this data includes the noise of the
accelerating vesting and anticipation period that occurred in 2003 and in 2004, I also
estimate the Pooled Model without these two transaction years, and in fact I find
differences. Additionally, in order to capture the true effect of the new rule, I apply the
Pre vs. Post-SFAS 123R Model, which makes it possible to compare clearly the
different executive stock options determinants between the pre and post-SFAS 123R
periods without the two transaction years (2003 and 2004).
Pooled Model - Equation 1 shows the regression I estimate with the pooled data,
via OLS13:
21
Where DV Post is an indicator variable coded as one when the observation is
from after June 2005 (the date SFAS 123R became effective), and zero otherwise. All
other variables are as calculated and discussed in Appendix A. To control for industry
effects I construct 24 industry dummies (as there are 24 different industries in the
sample) and include 23 of them in equation 1. Each of these indicator variables is coded
as one when the observation is from that industry and zero otherwise. Using this model
I am able to assess the factors that where determining executive stock options grants in
the period before SFAS 123R (via the estimate coefficients for β1 to β14) and to evaluate
the change of importance of these variables (via the estimated coefficients of the
interaction terms) that came to be after the introduction of SFAS 123R.
Pre vs. Post-SFAS 123R Model - Equation 2 shows the regression I estimate for
the pre and post-SFAS 123R periods, via OLS:
As in equation 1, I include 23 industry dummies to control for industry effects in
this equation. Through this model I compute and compare two OLS regressions. The
first OLS regression describes the situation before SFAS 123R and assumes the
transaction effects of SFAS 123R occurred in 2003 and in 2004, using only data from
2000 to 2002 for the pre-rule period. The second OLS regression comprehends the
period post-SFAS 123R and for this I use the average values between 2005 and 2006.
These two OLS regressions make it possible to separately analyze the different
executive stock options determinants. This research design is similar to the one of
22
compensation drivers after SFAS 123R effective and mandatory date of implementation
for all companies and also to investigate how stock options drivers (both types - real
economic drivers of stock options and the determinants associated to the past
accounting advantages) changes are determining decisions on stock options grants after
SFAS 123R effective date of implementation.
4.3. Results
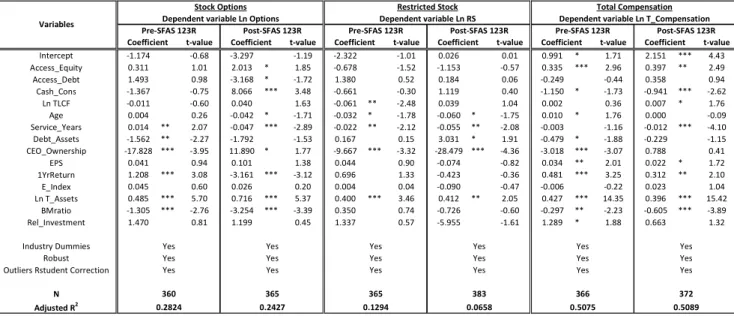
Pooled Model - Table 3 presents the results for the pooled OLS regressions with
total sample years for stock options (first column), restricted stock (second column) and
total compensation (third column). Equation 1 is estimated with these three dependent
variables (stock options, restricted stock and total compensation)14. All the pooled OLS
regressions are estimated using robust clustered errors (by firms) and eliminate outliers
using the values of Rstudent15.
The variables that are significant for stock options use and present expected
signs in the period before SFAS 123R introduction are: Access_Debt that is positively
and statistically significant revealing that when accessing debt markets firms tended to
use stock options to reduce compensation expense and boost reported earnings; firm
leverage (Debt_Assets) is significantly and negatively associated to stock options
grants, suggesting lower stock options grants from high leveraged firms;
CEO_Ownership, which is negatively and statistically associated with the use of stock
options, showing a lower need for additional shareholder-manager alignment when the
CEO has a high number of shares outstanding; EPS that is significant and positively
associated to stock options, revealing a positive relation between firm performance and
14 In Table 3 for each OLS pooled regression (stock options, restricted stock and total compensation) there are displayed the predicted signs of the coefficients from equation 1 with each of the three dependent variables.
23
stock options; Ln T_Assets also positively related to stock options confirming that
larger firms grant higher levels of stock options and finally BMratio that has a
significant negative impact on stock options, indicating that firms with larger growth
opportunities tend to increase the use of stock options.
However in the pre-SFAS 123R period, two of the estimated coefficients have
signs statistically different from the predictions, 1YrReturn and Age. 1YrReturn has a
significantly negative impact on the use of stock options, a possible explanation for this
outcome is that poor past performances lead firms to increase the intensity of incentive
based compensation using stock options to pursue a pay for performance goal.
Concerning the introduction of the new rule, as predicted in hypothesis 1, it has
significant impacts on the relevance and effects of stock options determinants:
Access_Debt became negatively related to stock options, indicating that financial
reporting concerns of firms accessing debt markets lose relevance determining the use
of stock options. Still regarding financial reporting concerns, after SFAS 123R be
introduced Access_Equity contributes positively to stock options grants, result that
probably has to do with the increase in transparency and quality of financial reporting
after the mandatory expensing. For firms accessing equity markets makes sense to use
stock options as incentive tool to increase firm equity value and by avoiding options cut
backs firms signal that in past they were not granting stock options to benefit from
accounting advantages. Financial constraints (Cash_Cons) turn to be statistically
positive to determine the use of stock options, indicating that when firms have cash
constraints use stock options in order to attract and maintained CEOs, as expected since
cash constraints are a justified real economic benefit of stock options. CEO_Ownership
24
with larger amounts of shares outstanding upon mandatory expensing. Finally
concerning the economic determinants of stock options (Ln T_Assets, BMratio and
Rel_Investment) all reinforce significance after the rule introduction.
Regarding the results from the Pooled Model without SFAS 123R transaction
years (2003 e 2004), they bear small differences, the main one concerns the variable
1YrReturn, in this model 1YrReturn only becomes negatively related with stock options
after the rule becomes effective, result suggesting that the negative sign of 1YrReturn in
the pooled model using the total sample years is due to the inclusion of 2003 and 2004.
Thus, upon imminent mandatory expensing in 2003 and 2004 firms’ usage of stock
options became dependent from past poor performance in order to incentive and
motivate CEOs to improve earnings. This way SFAS 123R contributed to the use of real
economic benefit of options, namely the creation of incentives to increase firm value.
In order to visibly capture the true SFAS 123R impacts excluding transaction
effects from 2003 and 2004 I next show the Pre vs. Post-SFAS 123R Model’ results16. Pre vs. Post-SFAS 123R - Table 4 exhibits the OLS regressions for the Pre vs.
Post-SFAS 123R Model. Equation 2 is estimated with three different dependent
variables. The first concerns stock options, the second is for restricted stock and the
final one relates to CEO total compensation. For each one of the dependent variables
two OLS regressions are estimated: one before SFAS 123R and another afterwards. All
Pre and Post-SFAS 123R regressions include industry dummies as controls, are
estimated using robust corrections and eliminate outliers by analyzing Rstudent17.
Through this model one can clearly see the pre and post-SFAS 123R statistically
significant variables for determine stock options use. Consistent with earlier
25
expectations and with the Pooled Model, financial reporting concerns associated to debt
markets (Access_Debt) are positively associated to stock options grants in the
pre-expensing period, showing that in order to guarantee a better access to debt markets the
use of stock options to boost reported earnings was likely to happen. After SFAS 123R
this variable is statistically negative, showing that firms no longer use options to
improve earnings in order to reduce financial reporting costs and to meet debt
covenants. Access_Equity as in the Pooled Model has a significant positive impact on
stock options after the rule implementation, suggesting that firms facing options
expensing when access equity markets use stock options as incentive tool to increase
firm equity value even without accounting benefits, which thus not happen when firms
access debt markets. Cash constraints are positively associated to stock options use, but
only in the post-SFAS 123R. This indicates that firms, without options accounting
benefits, started to use options in order to conserve cash allowing the preservation of
CEOs motivation. Results indicate that CEO_Ownership has a negative impact on the
use of stock option before the rule supporting that CEOs with high number of shares
outstanding do not need intensive compensation incentives. Conversely after SFAS
123R be introduced, CEO_Ownership contributes positively to stock options use. Firm
leverage (Debt_Assets), as predicted, has a negative impact in stock options usage in
both periods indicating that leveraged firms are less likely to use stock options, but this
factor loses significance after the rule. As for CEO tenure, in the pre-expensing period
Service_Years and Age are positively related to stock options grants but only
Service_Years is significant, these coefficients are according to the predictions since
stock options are suitable for less risk-averse executives. After the new rule be
26
negatively related with stock options grants, so after SFAS 123R less risk-averse CEOs
are likely to receive lower stock options grants.
Regarding firm performance, as predicted, EPS and 1YrReturn are both
positively related to stock options in the pre-SFAS 123R period. Nonetheless, only one
year return to shareholders (1YrReturn) is significant. After the rule be introduced
1YrReturn as a negative coefficient, and as in the Pooled Model this is evidence for the
use of stock options as a way to increase the intensity of incentive-based compensation
upon poor past performance.
Before and after the rule, firm size (Ln_T_Assets) is positively associated with
stock options, so as expected larger firms are the ones granting higher levels of stock
options, due to the superior need to align shareholders and mangers interests. As regards
book to market ratio (BMratio) it is negatively related to stock options grants,
independently from mandatory option expensing, however the coefficient impact is
higher in the after rule period, telling that the use of stock options as incentive tool to
increase firm value when firms have higher growth opportunities is predominant after
the implementation of SFAS 123R, which is expected since in the post-rule scenario
firms have reasons to use stock options for their real economic benefits.
To conclude on the impact of SFAS 123R on stock options determinants: the
relevance of financial reporting concerns bears huge alterations after SFAS 123R,
indicating that firms used stock options motivated by accounting benefits; financial
constraints gain significance after the rule introduction; the impact of agency cost,
tenure and firm performance on stock options suffer dramatic changes after SFAS
123R; firm governance (E_Index) is not explaining the use of stock options either
27
economic determinants of options. Overall, the findings reveal that stock options drivers
have changed after SFAS 123R, which is consistent with hypothesis 1.
5. Performance Equity Grants
5.1. Hypothesis Development and Variable Definitions
As referred to in the literature review, criticism that traditional equity grants
provide inadequate incentives to improve shareholders wealth is huge and several
studies have proved that on theory performance options are better in incentives
(Johnson and Tian [2000], Arya and Mittendorf [2005] and Bettis et al. [2008]). Thus,
without accounting barriers to this type of grants I expect an increase in performance
equity grants after SFAS 123R. To capture the effect of performance equity grants I use
two indicator variables, DV_Opt_Perf (DV_RS_Perf), which are coded as one when the
firm issued an option performance grant (restricted stock performance grant) in that year
and zero otherwise.
H2: The use of performance equity grants has an impact on the decrease of the
traditional stock options use.
5.2. Research Design
In order to test hypothesis 2, I employ an OLS change model between 2006 and
2003, where I am able to investigate if the change in option grants value during this
period (which is negative) is correlated to the increase in the use of performance equity
28
In the OLS change model for performance equity grants I use the difference
from 2006 to 2003, since 2006 is the year after SFAS 123R for all companies and 2003
because it is the older available year with performance data. To control for industry
effects I include 23 industry dummies in the regressions. The regression also includes
Robust and Rstudent corrections18. All variables are as defined in Appendix A.
5.3. Results
Table 5 exhibits the results of the estimation of equation 3. The main objective is
to investigate whether the change in option grants value during this period (which is
negative) is correlated to an increase in the use of performance equity grants, namely
performance stock options and performance restricted stock. The estimated coefficient
for DV_Opt_Perf is significantly positive. This reveals that the decrease in stock
options is associated with an increase in option performance grants, which supports
hypothesis 2. Thus, the introduction of SFAS 123R has led to the removal of accounting
barriers from performance-based equity compensation that are considered to be better
aligning incentives, in management retention and gauging managerial talent.
6. Complementary Analysis
In order to assess how the determinants of stock options are also driving the
decisions on restricted stock and CEO total compensation both before and after the rule,
I apply equation 1 and equation 2 to restricted stock and to CEO total compensation.
The equations for the Pooled Model and for the Pre vs. Post-SFAS 123R Model for
restricted stock and total compensation are in Appendix B.
29
6.1. SFAS 123R Impacts on CEO Total Compensation
Based on the results of Murphy (2002), “(…) the increase in CEO pay in
S&P500 industrials over the 1990’s primarily reflects a dramatic growth in stock
options (…)”, stock options are allegedly the cause for the overcompensation problem
in U.S., thus I hypothesize that stock options determinants explain CEO total
compensation levels in the pre-SFAS 123R period. However, after SFAS 123R
introduction, I expect total compensation drivers to become less similar from stock
options ones.
Table 3 exhibits the results for the estimation of the total compensation pooled
model. In this model one can see that before the rule is introduced several independent
variables have similar impacts on total compensation and stock options, to be precise
firm leverage (Debt_Assets), CEO_Ownership, EPS, Ln T_Assets and BMratio. The
rule introduction causes only a common significant change on stock options and total
compensation, which is the turn in the coefficient sign of CEO_Ownership that becomes
positive, indicating that after SFAS 123R a CEO possessing a large number of shares
outstanding is likely to receive higher stock options grants and overall compensation
levels. After the rule introduction 1YrReturn gains positive significance explaining total
compensation levels, whereas as it was seen in the pooled model for stock options the
rule introduction has a negative effect in the relation between 1YrReturn and stock
options use. This difference means that upon option expensing the use of total
compensation continues to be positively related to firm performance while the use of
stock options is dependent from poor past performance.
Through the pooled model is also possible to see that total compensation drivers
30
SFAS 123R introduction, for instance firm leverage (Debt_Assets) and BMratio are
both positively related to restricted stock contrary to what happens with stock options
and total compensation, and EPS is not significant to explain the use of restricted stock
as it is in the case of total compensation and stock options.
The results for the Pre vs. Post-SFAS 123R Model, in Table 4, reveal quite a few
similarities between total compensation drivers and stock options ones and as it was
expected these resemblances are predominant in the pre-SFAS 123R period. Agency
costs (Debt_Assets and CEO_Ownership), firm performance (1YrReturn) and economic
determinants (Ln T_Assets and BMratio) all have the same sign impacts and are
significant to explain stock options and CEO total compensation levels before SFAS
123R be introduced. Comparing the determinants of stock options and total
compensation, none of them present significant differences in coefficient signs, fact that
reveals a great level of similarity between the variables that were explaining total
compensation and stock options before options expensing.
After the rule effective implementation, stock options and total compensation
determinants became different from each other. In the presence of mandatory options
expensing only economic determinants (Ln T_Assets and BMratio) maintain the
previous same sign and significance impacts with both stock options and total
compensation. CEO tenure (Service_Years) and financial reporting concerns associated
to equity markets (Access_Equity) turn to have equal effects on stock options and total
compensation. Concerning agency costs, firm leverage (Debt_Assets) and
CEO_Ownership lose significance explaining total compensation levels, one possible
justification for this outcome is that after SFAS 123R total compensation is not mainly
31
the ones of stock option before the rule become different in the post-expensing period.
Upon option expensing CEO total compensation and stock options drivers present few
significant differences especially concerning financial constraints (Cash_Cons), which
makes sense since after SFAS 123R firms facing cash constraints no longer do an
abusive use of stock options to increase compensation levels and so firms with lack of
liquidity tend to decrease overall compensation levels, and also involving firm
performance (1YrReturn) evident and explained earlier from the comparison of the
pooled models for total compensation and stock options.
Consistent with my expectations, in what concerns the impact of stock options
drivers on CEO total compensation, most of them have the same sign correlations and
significances with total compensation than they have with stock options, but they tend
to become different after SFAS 123R, period when total compensation is no longer
mainly made of stock options.
6.2. SFAS 123R Impacts on Restricted Stock
According to past authors restricted stock has been rarely used and stock options
have been used in excess, thus core drivers for stock options are unlikely to explain the
use of restricted stock (Carter et al. [2007] and Brown and Lee [2007]), as so I expect
that stock options and restricted stock grants determinants to be different.
Results from estimation of the pooled restricted stock model (in Table 3) are
quite different; confirming that drivers for restricted stock are different from stock
options ones, supporting my expectations. Before the rule impact, from the variables
that are significant for restricted stock only firm size (Ln T_Assets), CEO_Ownership
and CEO Age present equal significant estimation signs with stock options. At the same
32
two types of equity-based compensation, leaving the equal effect of CEO Age between
the two compromised19. The impact of SFAS 123R introduction on restricted stock
reveals a significant negative relation between bad governance (E_Index) and restricted
stock use, while the governance measure even though presents the expected sign is not
significant explaining stock options use either in pre or in post-period. Another
significant difference after the rule is the negative impact of Rel_Investment on
restricted stock and its positive effect on stock options, this means that when firms have
investment levels superior to their competitors their use of restricted stock decreases
while they continue to grant stock options. Subsequent to SFAS 123R, financial
constraints (Ln TLCF and Cash_Cons) have equal coefficient signs correlations with
restricted stock and stock options which is an important change since without
accounting barriers firms facing financial constrains begins to use restricted stock as an
alternative to stock options, but still the positive impact of SFAS 123R in Cash_Cons is
not sufficient to change the significance of this variable.
Referring now to Table 4, in the Pre vs. Post-SFAS 123R Model for restricted
stock, it is possible to see that stock options determinants are different from restricted
stock ones, however after the rule be introduced there are a number of changes in
restricted stock determinants and some resemblances between the factors explaining
stock options and restricted stock come out. Before the rule come to be effective
CEO_Ownership and firm size (Ln T_Assets) were the only variables equally affecting
restricted stock and stock options. Despite the same pre-SFAS 123R impact of
CEO_Ownership, after the rule this variable continues to be negatively related to
33
restricted stock while it turns to be positively related with both stock options and total
compensation levels. Another significant difference between restricted stock
explanatory factors and the ones from stock options and total compensation is the
positive relation between restricted stock use and firm leverage (Debt_Assets) that even
increases significance after the rule implementation. In the pre-SFAS 123R period CEO
tenure (Age and Service_Years) signs impact on restricted stock were significantly
different from what happens with stock options, however after the effective
implementation of the rule CEO tenure as equal significant effects on restricted stock
and stock options. Regardless of the visible differences in most of restricted stock
independent variables, upon options expensing several factors explaining restricted
stock bear important alterations and turn out to have the same coefficient signs as they
have with stock options. Namely, financial constrains (Cash_Cons and Ln TLCF), firm
performance (1YrReturn) and BMratio, although from these factors only Ln TLCF
became significant immediately after the rule implementation.
Overall results reveal that restricted stock determinants are quite different from
stock option ones, supporting my expectations. An interesting result is that even after
the rule (when stock options no longer benefit from accounting advantages) the drivers
for these two types of equity compensation remain significantly different, even though
there is a visible approximation in coefficient signs.
7. Conclusions
The main objective of this paper is to investigate the change in factors associated
with firms’ decisions to grant stock options after the introduction of SFAS 123R. One of
the factors considered is the existence of performance conditions in new grants.
34
restricted stock grants and on CEO total compensation. In my study I use a sample of
385 firms from the S&P 500 from 2000 to 2006 and compensation data for the firms’
CEOs.
Consistent with past literature (Brown and Lee [2007] and Carter et al. [2007]) I
find statistically evidence for the decrease in stock options use and for the increase in
restricted stock grants associated to SFAS 123R. I have also find that stock options
grants still bear a huge decrease after SFAS 123R effective date of implementation for
all companies, so after December 2005.
Empirical findings proved significance of hypothesis 1, that assumes a change in
stock options drivers after SFAS 123R. Results from the Pre vs. Post-SFAS 123R
Model, that excludes the anticipation and accelerating vesting effects (2003 and 2004),
show that financial reporting concerns associated to debt markets were determining the
use of stock options in the pre-SFAS 123R period but after SFAS 123R this factor as a
negative significance explaining stock options. This result proves that pre-SFAS 123R
factors behind the choice of stock options were associated to the previous accounting
advantages but after mandatory expensing the impact of these factors change. Also as a
result from this model I find that financial constraints (Cash_Cons), agency costs
(Debt_Assets and CEO_Ownership), firm performance (1YrReturn) and economic
determinants (firm size and BMratio) are important to determine stock options either
before and after the rule, establishing that these are the justified real economic drivers
for stock options use. In line with nowadays critics of traditional stock options that
suggest an increase in the use of performance-based equity compensation, the third
model, the Change Model for Performance Grants, finds evidence consistent with
35
impact in the decrease of traditional stock options. From this result I can conclude that
SFAS 123R has the potential to alter the effective design of CEO compensation that
finally demands a lot more thought than simply awarding “plain-vanilla” options and
means the removal of accounting barriers from more efficient equity-based
compensation as it is the case of performance equity grants. As for complementary
analysis, I find evidence, in the Pooled and in Pre vs. Post-SFAS 123R Models, that
stock options drivers are quite different from restricted stock ones, both in the pre and
post-SFAS 123R periods. In pre-SFAS 123R period restricted stock was being rarely
used due to the favorable accounting treatment of stock options, thus stock options
drivers were expected to be completely different from the ones explaining restricted
stock use. However, after SFAS 123R, stock options do not benefit from accounting
advantages and still the determinates for these two types of equity compensation
remains different, even though there is a visible approximation tendency. This leave for
future research the discover of the true restricted stock drivers. In what concerns the
impact of SFAS 123R on CEO total compensation, consistent with Carter et al. (2007) I
find no evidence of an impact of SFAS 123R in the level of CEO total compensation,
just in the composition of this variable. I also find that total compensation drivers were
similar to stock options ones, however SFAS 123R introduction differentiates CEO total
compensation determinants from the variables that are explaining stock options use
upon mandatory expensing. Future research could collect a broader set of data,
gathering more than 2 years of observations after the rule. This way it would be possible
to analyze the medium run impacts of SFAS 123R on the choice between stock options
36
References
Arya, A. and Mittendorf, B. 2005. “Offering stock options to gauge managerial talent.” Journal of Accounting and Economics 40, 189 – 210.
Bebchuck, L. and Fried, J. 2004. “Pay without performance: the unfulfilled promise of
executive compensation”. Harvard University Press 2004.
Bebchuck, L. Cohen, A. and Ferrell, A. 2004. “What matters in corporate governance?”. The Review of Financial Studies.
Bettis, C. Bizjak, J. Coles, J. and Kalpathy, S. 2008. “Stock and option grants with performance – based vesting provisions”.
Bodie, Z. Kaplan, R. and Merton, R. 2003. “For the last time: stock options are an expense”. Harvard Business Review 81 (3): 63-71.
Brow, L. and Lee, Y. 2007. “The determinants and consequences of changes in executive option based compensation around the issuance of SFAS 123R”. Georgia State University.
Bryan, S. Hwang, L. and Lilien, S. 2000. “CEO stock-based compensation: n empirical analysis of incentive-intensity, relative mix and economic determinants”. The Journal of Business 73 (4): 661 – 693.
CalPERS. 2003.
Carter, M. Lynch, L. and Tuna, I. 2007. “The role of accounting in the design of CEO equity compensation”. The Accounting Review 82(2): 327 – 357.
CCG Investor Relations. January 2006. “Stock option expensing under FAS 123R”.
http://www.ccgir.com/ccgir/white_papers/pdf/FAS%20123R%20Final.pdf
Choudhary, P. Rajgopal, S. and Venkatachalam, M. 2006. “Accelarating vesting of stock options in anticipation of FAS 123 – R”.
Core, J. and Guay, W. 1999. “The use of equity grants to manage optimal incentive levels”. Journal of Accounting and Economics 28 (2), 151-184.
Core, J. Guay, W. and Larcker, D. 2003. “Executive Equity Compensation and Incentives: A Survey”. Economic Policy Review 9 (1): 27 -50.
Core, J. Guay, W. and Thomas, R. 2004. “Is U.S. CEO Compensation inefficient pay without performance? A review of pay without performance: the unfulfilled promise of executive compensation”. Working Paper.