ABSTRACT: Finite element method (FEM) and boundary element method (BEM) are methods usually applied on low-frequency coupled luid-structure analysis. On the other hand, statistical energy analysis (SEA) is a technique applied on small wavelength bandwidth predictions. However, in the mid-frequency, where deterministic calculations are costly and conidence intervals of SEA are not satisied, hybrid FEM/ SEA models can be used. This work presents a coupled vibro-acoustic analysis methodology of the Brazilian Satellite Launcher Vehicle payload fairing. FEM/FEM model accounts for the low-frequency internal responses. The high-frequency responses are computed by a SEA coupled elasto-acoustic model, and a hybrid FEM/SEA model calculates the payload fairing mid-frequency behavior.
KEYWORDS: Launcher, Payload fairing, Vibro-acoustics, Coupled analysis, Hybrid analysis.
Deterministic, Hybrid and Statistical
Vibro-Acoustic Models - a Methodology
to Determine the VLS Payload Fairing
Acoustic Behavior
Rogério Pirk1,2, Carlos d’Andrade Souto1,2
INTRODUCTION
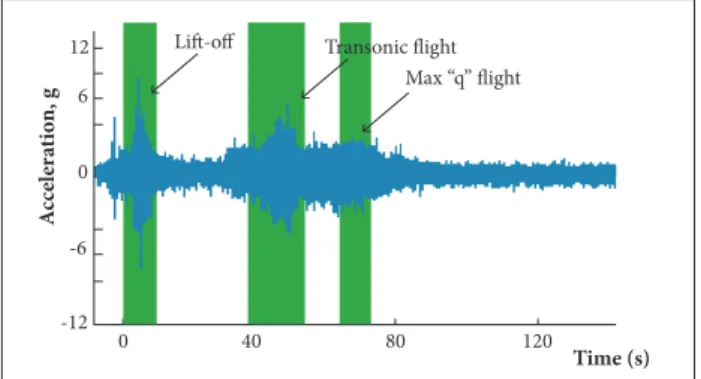
he acoustic noises generated during launching missions are typically described by three events as lit of, transonic and maximum dynamic pressure lights. According toArenas and Margasahayam (2006), the launchers are submitted to excitations during the two-minute lit of and transonic climb phase through the dense atmosphere layer as well as the disturbances in the boundary layer during high-speed light (Fig. 1).
The payload fairing (PLF) and equipment bays are the compartments where sensible electronics, inertial systems and payloads are embedded. In this way, external and internal acoustic and vibro-acoustic environments must be known, in order to establish the correct dimensioning and qualiication tests for such elements, parts and subsystems. Many studies have been devoted to manage the vibro-acoustics inside the Brazilian Satellite Launcher Vehicle (VLS) PLF (Pirk et al., 2002a, 2002b, 2005; Pirk and Góes, 2005, 2006; Pirk and Souto, 2008, 2010), where coupled low- and high-frequency techniques were applied. Deterministic coupled techniques as inite element method (FEM)/FEM (Pirk et al., 2002a; Pirk and Góes, 2005) and FEM/boundary element method (BEM) (Pirk and Góes, 2005) were used to predict the low-frequency structural skin and acoustic responses, when the PLF structure is submitted to an acoustic difuse ield of 145 dB overall sound pressure level (OSPL). However, at higher frequencies, such deterministic methods are seldom practical (Shorter et al., 2005). Firstly, because the number of degrees of freedom required describing
1.Instituto de Aeronáutica e Espaço – São José dos Campos/SP – Brazil 2.Instituto Tecnológico de Aeronáutica – São José dos Campos/SP – Brazil.
Author for correspondence: Rogério Pirk | Instituto de Aeronáutica e Espaço | Praça Marechal Eduardo Gomes, 50 – Vila das Acácias | CEP: 12.228-904 São José dos Campos/SP – Brazil | Email: [email protected]
the response becomes intractable at higher frequencies, even with the evolution of the machines nowadays. The second problem is that the higher order modes of a system tend to be sensitive to small perturbations in the properties of the system.
In light of such practical limitations, a statistical description of systems becomes an essential tool to draw meaningful conclusions about high-frequency responses. Statistical energy analysis (SEA) (Lyon and DeJong, 1995) is a statistical technique that provides a good description of the response of large subsystems, compared with a wavelength (the response of such subsystems tends to be sensitive to perturbation). In this framework, coupled analyzes have also been done, in order to obtain the high-frequency PLF vibro-acoustic responses (Pirk et al., 2002b; Pirk and Góes, 2005, 2006). In these works, the acoustic responses in the mid-frequency bandwidth or twilight-zone were characterized by extending the low- and high-frequency analysis bandwidths. However, despite the good results obtained by the applied prediction techniques (Pirk and Góes, 2006), an alternative hybrid FEM/SEA model can be proposed by including deterministic details in SEA models, aiming at improving the description of the medium-frequency dynamic responses. h en, the PLF analysis can be rei ned, once the statistical description employed in SEA is not appropriate for describing the response of “stif ” subsystems that are small compared with a wavelength.
h is paper presents the procedures and coupled vibro-acoustic techniques, adopted to obtain the inner vibro-acoustic response of the VLS PLF. In view of having accurate models, well dei ned bandwidths are estabilished for the application of each coupled vibro-acoustic modeling technique as FEM/FEM deterministic, hybrid FEM/SEA and SEA. h en, the internal PLF acoustic environment could be predicted in the frequency range from 0 to 8,000 Hz.
MODEL DESCRIPTION
BRAZILIAN SATELLITE LAUNCHER VEHICLE PAYLOAD FAIRING
Figure 2 shows the Brazilian VLS PLF structure, which is hammerhead-type geometry, with a maximum nominal diameter of 1.2 m and a height of 3.5 m. h is compartment consists of aluminium shells, reinforced by beams. h e exterior fairing surface is lined with cork and no acoustic lining is provided inside this cavity. h e PLF weighs around 150 kg, including the aluminium structure and functional components as mechanisms, electronics and pyrotechnics that provide its halves separation as well as the exterior cork blanket heating protection.
Figure 1. Typical vibration time history during a Space Shuttle Launch.
Figure 2. Brazilian Satellite Launcher Vehicle payload fairing.
LOW-FREQUENCY MODELING METHODOLOGY The FEM is the most appropriate numerical technique for the (low-frequency) dynamic analysis of these types of vibro-acoustic systems. Such problems are most commonly described in an Eulerian formulation, in which the l uid is described by a single scalar function, usually the acoustic pressure, while the structural components are described by a displacement vector. h e resulting FE model in the unknown structural displacements and acoustic pressures at the nodes of, respectively, the structural and the acoustic i nite element meshes are (Craggs, 1973).
where KS, KC and KA are the structural stif ness, the cross-coupling stif ness and the acoustic stif ness matrix, respectively;
CS and CA are the structural and acoustic damping matrices, respectively; MS and MA are the structural and acoustic mass matrices, respectively; wi is the unknown nodal displacement vector; pi is the unknown nodal pressure vector; FSi is the 12
6
0
0 -6
-12
40 80 120
Max “q” flight
A
cc
el
er
at
io
n, g
Transonic flight Lift-off
Time (s)
structural loading vector; FAi is the external acoustic force vector;
ρ is the mass density of the acoustic luid domain.
In comparison with a purely structural or purely acoustic FE model, the coupled stiffness and mass matrices are no longer symmetrical, since the loading of the luid on the structure results in a cross-coupling term KC in the coupled stiffness matrix, while the loading of the structure on the luid results in a cross-coupling term MC = ρKT
C in the coupled mass matrix.
Structural wavelengths are usually much smaller than acoustic wavelengths, so that the structural mesh of the fairing should be iner than the acoustic mesh of the inner cavity. On the other hand, due to the continuity of the normal structural and luid displacements along the luid-structure interface, both structural and acoustic meshes should have comparable mesh densities, at least in the region of the luid-structure coupling interface. In view of these two considerations and aiming at keeping the computational efforts within reasonable limits, the following modelling methodology has been adopted. A ine FE mesh of the PLF was used for the construction of the uncoupled structural modal data basis and the resulting modes were projected onto a coarse FE mesh. For the acoustic cavity mesh, the same mesh density was used along the luid-structure coupling interface as the structural coarse mesh of the PLF, while the mesh density has been slightly decreased towards the inner central axis of the cavity. he uncoupled modes, resulting from this acoustic FE mesh, together with the projected structural modal base of the fairing, have then been used in a coupled FE model — Eq. 1 —, which used the modal superposition principle to calculate the acoustic and skin responses.
STRUCTURAL FINITE ELEMENT MODEL
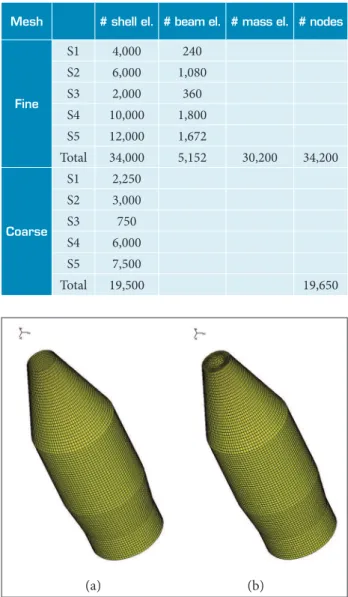
he fairing was divided into four surfaces, discretized into 4-noded quadrilateral shell elements, while 2-noded beam elements were used to model the circumferential and the axial stifeners. To account for the mass loading efect of the cork blanket on the exterior fairing surface, a distribution of concentrated mass elements was attached to the PLF surface nodes. Table 1 lists the properties of both the ine and the coarse structural meshes. Figure 3a shows the ine structural mesh.
Shell surface 1 has a thickness of 3 mm and is made of aluminum (elasticity modulus – E = 72 GPa, Poisson’s ratio – ѵ = 0.29, mass density – ρ = 2,750 kg/m3), while the other three surfaces are
0.8 mm thick and made of an aluminum alloy (E = 72 GPa,
ѵ = 0.29, ρ = 7,000 kg/m3). he ine mesh contains at least 6, 8
and 10 elements per wavelength in the frequency ranges up to, respectively, 350, 220 and 150 Hz, while the coarse mesh presents
frequency limits of 200, 120 and 80 Hz. As a result, one could deine the upper limit frequency analysis at 150 Hz. he PLF was assumed to be clamped at the bottom, since this boundary condition well represents the coupling with the fourth stage of the VLS launcher.
ACOUSTIC FINITE ELEMENT MODEL
he FE mesh of the fairing acoustic cavity consists of 119,577 nodes and 110,238 elements (106,050 8-noded hexahedral elements and 4,188 6-noded pentahedral elements). he internal luid of the cavity is assumed as air with mass density ρ = 1.225 kg/m3 and
a speed of sound c = 340 m/s. he bottom and top faces of the cavity are assumed to be acoustically closed. Figure 3b illustrates the PLF cavity mesh.
Mesh # shell el. # beam el. # mass el. # nodes
Fine
S1 4,000 240
S2 6,000 1,080
S3 2,000 360
S4 10,000 1,800
S5 12,000 1,672
Total 34,000 5,152 30,200 34,200
Coarse
S1 2,250
S2 3,000
S3 750
S4 6,000
S5 7,500
Total 19,500 19,650
Table 1. Mesh properties.
Figure 3. (a) Payload fairing structural mesh, (b) payload fairing acoustic mesh.
Figure 4. Statistical energy analysis model with three subsystems.
(2) MODEL EXCITATION
According to Coyette et al. (1997) and Troclet (2000), the nature of the lift off acoustic pressure loading is close to a diffuse ield excitation, having a (nearly) uniform pressure distribution. Aiming at simulating the diffuse acoustic ield generated at lift off, a uniform exterior pressure loading is applied as a normal point force on all nodes of the fairing shell elements. he force value is deined such that the total load is equivalent to a uniform pressure loading of 145 dB OSPL.
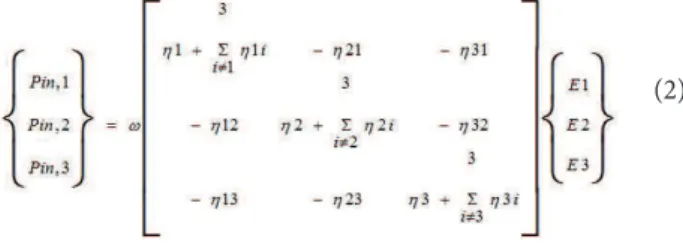
HIGH-FREQUENCY MODELING METHODOLOGY Deterministic techniques have practical limitations for high-frequency analysis (Shorter et al., 2005; Lyon and DeJong, 1995), since accurate models need to have increased the number of nodes and elements for a good spatial representation. his reinement imposes limitations, since the allocated memory and processing time increase, mainly when coupled vibro-acoustic analysis is done. In addition, the resonance frequencies and mode shapes show great sensitivity to small variations of geometry, construction and material properties, when higher frequency analysis is considered. In light of these uncertainties, the use of a statistical model of the dynamic parameters seems natural and appropriate. As an alternative for high-frequency analysis of the inner cavity of the VLS payload fairing, SEA approach is proposed. he basic SEA equations express the energy balance of the diferent subsystems in the model. In general, subsystems can receive power, dissipate power and exchange power with other subsystems to which they are coupled. SEA fundamental hypotheses as dissipation losses in relation to the energy variable and modal energy proportionality from connected subsystems yield the SEA matrix. he distribution of the dynamical response in the system due to some excitation is obtained from the distribution of the energy among the mode groups, based on a set of power balance equations for the mode groups. As an example, Fig. 4 shows a three-subsystem SEA model (Lyon and DeJong, 1995).
he corresponding SEA equation of the three-subsystem coupled model takes into account the input powers (Pin) for subsystems i, a vector with lumped total energies (Ei) and the SEA matrix [g], which depends on the frequency and the SEA parameters, such as internal loss factors (ηii), coupling loss factors (ηij) and modal densities (ni), as described in Eq. 2.
STRUCTURAL SEA MODEL
he PLF was divided into four surfaces, as shown in Fig. 5a. In order to account for the rib-stifened plates of the surfaces 2, 3 and 4, the SEA structural fairing model considers connected plates and beams (longitudinal and circumferential). This structural FE mesh, previously generated in the Structural inite element model section, was imported and the SEA structural model was created. he plate subsystems were generated as singly curved shells and uniform plates, with damping loss factors of 1% (for lexure, extension and shear propagating waves). he external cork treatment on the surfaces 2, 3 and 4 was simulated as material addition. he layered area and the density of the cork were considered to assign this mass addition. A total of 72 beams (44 longitudinal and 28 circumferential) and 8 shells (2 singly curved shells of the adaptor, 2 singly curved shells — lower cone, 2 singly curved shells — main cylinder and 2 singly curved shells — upper cone) compose the structural SEA model (Fig. 5a).
ACOUSTIC STATISTICAL ENERGY ANALYSIS MODEL he acoustic cavity was created considering the air as the luid as well as the dimensional parameters of the PLF. As such, a mass density ρ = 1.225 kg/m3 and a speed of sound c = 340 m/s were
assigned to create this subsystem. he top and bottom faces of the cavity were assumed to be acoustically closed. Figure 5b presents the PLF acoustic cavity.
CONNECTIONS
The coupling boundary between all the structural and acoustic subsystems is modelled to consider the transmission of power across the junctions. As such, all the subsystems that share common nodes are connected by point, line and area
Pin,1 Pin,2
Pin,3
E1 E2
E3 3
3 3
3
3 η
η η
η η
η η
η
η 1
1
1 1 1
2 2
2
2
Figure 5. (a) Structural subsystems (shells, circumferential and longitudinal beams), (b) acoustic cavity of the fairing.
Figure 6. Diffuse pressure ield at lift-off.
Figure 7. Complete model of the fairing.
Frequency (Hz)
S
o
und p
ress
ur
e l
ev
el (dB)
0 40 80 120 160
25 100 400 1,600 6,300
(a) (b)
junctions and all the appropriate waveields are connected, as well as the corresponding coupling loss factors (CLF) between subsystems are created.
In the case of beam connections, point junctions are created
to describe the transmission of the energy at a discrete point. he
connections of beams and plates as well as plates and plates are provided by line connections, which describe the transmission of vibration energy along a line. Finally, the CLF of plates and acoustic cavities are accounted by area connections that represent the transmission of acoustic energy at this common bounding area.
EXCITATION
he estimated OSPL at 145 dB lit of (GEVS-SE, Rev A, June 1996) is considered. In contrast with the aerodynamic noise during light ascent, the nature of the lit of acoustic pressure loading is close to a difuse ield excitation, having a (nearly) uniform pressure distribution (Coyette et al., 1997). As stated by Defosse and Hamdi (2000), only elements with large surface areas, as plates and panels, are considered to be susceptible to acoustic excitation. hen, the referred difuse pressure ield was applied to the plates of the SEA fairing model, which simulates the power input into a structural plate. he spectral distribution of this air-borne excitation is shown in Fig. 6. Figure 7 shows the complete SEA fairing model, with 80 structural elements, 1 acoustic 3-D volume, and 8 difuse pressure ield excitations.
MID-FREQUENCY MODELING METHODOLOGY A hybrid FE/SEA method ideally combines the low-frequency performance of the FEM with the high-low-frequency performance of SEA. his approach extends SEA to lower frequencies and the FEM to higher frequencies, allowing the
complementary analysis in the mid-frequency or “twilight” zone, where the FEM model reinement imposes limitations and the acceptable conidence interval of the SEA model is not yet achieved.
In SEA technique, a system is modelled as a collection of subsystems, adopting the concept of universality (Langley et al., 2005), which means that all subsystems are assumed to have a suiciently high degree of complexity and randomness. However, in many practical applications, as aircraft and space structures, this condition is not fully met, once the skin panels may have many modes and a high degree of statistical overlap but the reinforcing frames do not present these characteristics. In such cases, it would be advantageous to combine the deterministic features of FEM with the SEA statistical technique. However, the coupling of these two methods, which differ in their nature (deterministic and statistical) as well as in their basic concepts (FEM is based on the system’s dynamic equilibrium, while SEA is based on the conservation of energy low), is a diicult task.
display short wavelength vibrations and are sensitive to the efects of random uncertainties, while others (for example, beams) show little variation in their dynamic properties and
are essentially deterministic. herefore, in this hybrid FEM/
SEA method, the deterministic components are modeled by using FEM, while the random components are modeled as SEA subsystems.
A key-feature of the coupling of this hybrid FE/SEA method is the concept of direct field or power absorbing dynamic stiffness matrix associated with each SEA subsystem. This matrix is deined as that resulting from the presence of the direct ield waves, corresponding to power absorbing behavior computed for each subsystem, in the sense that the direct ield waves propagate energy away from the boundaries (Langley
et al., 2005). It is important to note that the direct ield dynamic stifness matrix can also be viewed as the ensemble average of the full dynamic stifness matrix when averaged over random boundary relections.
FINITE ELEMENT/STATISTICAL ENERGY ANALYSIS EQUATIONS
One may consider that the bending motions of panels and cavities have a short wavelength of deformation and will be described using SEA subsystems and the bending degrees of freedom of these subsystems will be omitted from the FE model of the system, at all points other than the boundaries. he relevant “direct ield” dynamic stifness matrix is then added to the FE model at the boundaries and this augmented FE model is used in the subsequent analysis. If the responses (or degrees of freedom) of the deterministic part are called q, then the governing equations of motion (for harmonic vibration of frequency ω), considering the summation over all the SEA subsystems in the model, can be written as:
subsystem k (not accounted in Ddir(k)); D
d is the dynamic stifness
matrix given by the inite element model of the deterministic part of the system; Ddir(k) is the direct ield dynamic stifness
matrix associated with subsystem k.
Notice that Eq. 3 and Eq. 4 are exact and that the forces arising from the SEA subsystems into a direct ield part, which is accounted byDdir(k), and a reverberant part, which is carried
to the right hand side of Eq. 3, were split.
Equation 5 is a key-point to the development of the hybrid method, which shows that the cross-spectral matrix of the force exerted by the reverberant ield is proportional to the resistive part of the direct ield dynamic stifness matrix, which is a form of difuse ield reciprocity statement (Shorter and Langley, 2005):
where Dtot is the dynamic stifness matrix of the FE model (excluding the SEA subsystem degrees of freedom), when augmented by the direct ield dynamic stifness matrix of each SEA subsystem; f is the set of external forces applied to this part of the system; frev(k) is the force arising from the reverberant ield in
where Ek and nk are the (ensemble average) vibrational energy and the modal density of the kth subsystem, respectively.
From Eq. 3, the responses of the deterministic part can be expanded as:
where qd is the response considering dynamic stifness matrix of the inite element model and the external forces.
he time averaged power input to the direct ield of subsystem j can be written as Eq. 9, considering that the dynamic stifness matrix is symmetric:
where rs is the index referent to the symmetric matrix and
S is the cross-spectral matrix.
If the various contributions q(k) of Eq. 8 are uncorrelated
and of zero mean, then Eq. 5-9 yield: (3)
(4)
(5)
(6)
(7)
(8)
where
the coupling loss factors ηjk and loss factors ηd,j are calculated
by using the FE model (augmented by the direct ield dynamic stifness matrices) via Eq. 12 and 14; furthermore, Eq. 16 has the form of a standard deterministic FE analysis, but additional forces arise from the reverberant energies in the subsystems. If no SEA subsystems are included, then the method becomes purely FE; on the other hand, if only the junctions between the SEA subsystems are modeled by FE, then the method becomes purely SEA, with a novel method of computing the coupling loss factors (Shorter and Langley, 2005).
HYBRID MODEL OF THE BRAZILIAN SATELLITE LAUNCHER VEHICLE PAYLOAD FAIRING
In the hybrid model proposed in this work, the subsystems of the PLF that present little variation in their dynamic properties, as the circular and longitudinal reinforcing beams, are considered as the deterministic parts of the FEM/SEA model. As a result, such beams are modelled using FEM. In order to obtain accurate analysis in the mid-frequency range (from 100 to 400 Hz), a discretization of 8 elements by wavelength was adopted. On the other side, the bending motions of the eight structural panels and the acoustic cavity of this vibro-acoustic system that present short wavelength of deformation and are sensitive to the efects
of random uncertainties are modelled using SEA. he same
excitation simulating the lit of acoustic difuse ield, shown in Fig. 6, was applied to this hybrid FEM/SEA model and clamped boundary condition was applied at the bottom part of the structural deterministic model. In order to obtain the FE modal data basis to be considered on the hybrid calculations, an intermediate analysis was done. Such a structural modal analysis yielded the modal data basis that is composed of 454 eigenvalues up to 536 Hz. Figure 8 shows the FE structural model with circular and longitudinal beams, used in this hybrid model. he SEA structural panels and cavity models are the same as shown in Figs. 5a and 5b.
Since the dynamic stifness matrices are symmetric, it is shown from Eq. 12 that reciprocity holds, in the sense that
ηjk ηj = ηjk ηk. Moreover, it is shown that the terms ηjk are equivalent to the coupling loss factors that appear in SEA (Eq. 2).
he power output from the reverberant ield in subsystem
j can be written as the sum of the power dissipated through damping, the power transferred to the other subsystems, and the power dissipated in the deterministic system due to the response q(j), as Eq. 13 describes:
Furthermore, the cross-spectral matrix of the response q
can be derived from Eq. 5-8, which yields: and
he energy balance equation for subsystem j is described by Eq. 10 and 14:
Equations 15 and 16 form the two main equations of the hybrid method. It is clear that these equations couple FE and
SEA methodologies: Eq. 15 has precisely the form of SEA, but Figure 8. FE reinforcing beams model. x
z
y
(10)
(11)
(12)
(13)
(14)
(15)
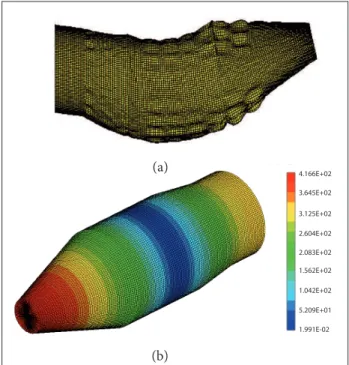
Figure 9. (a) Payload fairing 1st structural bending mode at
150.7 Hz, (b) payload fairing 1st acoustic longitudinal mode
at 63.5 Hz.
4.166E+02
3.645E+02
3.125E+02
2.604E+02
2.083E+02
1.562E+02
1.042E+02
5.209E+01
1.991E-02
Figure 10. Payload fairing internal acoustic response.
Frequency (Hz)
SP
L (r
ef
. 20 E
xp 10-6
Pa
)
0 40 80 120 160
5.00E+00 1.30E+01 3.20E+01 8.00E+01 2.00E+02 5.00E+02 1.25E+03 3.15E+03 8.00E+03
ANALYSIS AND RESULTS
In view of having the complete range of analysis from 0 to 8,000 Hz, the modelling procedures presented in sections Low-frequency modeling methodology, High-Low-frequency modeling methodology and Mid-frequency modeling methodology
were adopted. he limiting frequency range of the FEM/FEM
model was found at 150 Hz (section Low-frequency modeling methodology). On the other side, the acceptable conidence interval of the SEA model is satisied starting from 300 Hz, where the reliable vibro-acoustic predictions have 5 modes in the bandwidth and the modal overlap factor starts to be accurate (resonant mode controlled bandwidth). In practice, it is assumed that a modal overlap factor smaller than 1 does not present features of a SEA subsystem. On the other side, if this value is much bigger than unity, the modal peaks are not clearly apparent in the frequency response functions, which characterize the high modal density of the SEA subsystem. Finally, in the gap between 150 and 300 Hz, the “twilight” zone, a hybrid FEM/SEA model calculates the PLF acoustic responses. With these three coupled models, one can do the complete analysis for the low-, mid- and high-frequency bandwidths.
In the low-frequency range, a total of 174 structural modes in a frequency range up to 220 Hz have been identiied using the ine PLF structural mesh (Fig. 3a). On the other hand, a total of 80 acoustic modes in a frequency range up to 566 Hz have been identiied using the acoustic mesh (Fig. 3b). he uncoupled modal data bases were projected onto the FEM/FEM coupled vibro-acoustic model (Eq. 1) and the frequency response analysis was calculated, using the modal superposition principle. Figures 9a and 9b illustrate the 1st structural mode and the 1st acoustic mode,
respectively, considered in the FEM/FEM coupled analysis. In order to predict the mid-frequency acoustic response of the PLF, the hybrid FEM/SEA model has assumed the circular and longitudinal reinforcing beams of the fairing as the deterministic part of the vibro-acoustic model, while the structural panels and the acoustic cavity were modelled as the statistical part (section Hybrid model of the Brazilian Satellite Launcher Vehicle payload fairing). A total of 454 eigenvalues were considered in this hybrid calculation. As mentioned before, the bandwidth of interest in this analysis is from 100 to 400 Hz. he energy levels and interactions of diferent subsystems were solved for the SEA vibro-acoustic model of the fairing (Eq. 2). Careful analyzes were done to determine the validity of the response calculations, and important parameters as modal
density, mode count and modal overlap factor were considered to determine the SEA valid analysis bandwidth. Figure 10 displays the one-third octave bandwidth acoustic response of the VLS PLF acoustic cavity.
In the low-frequency (up to 150 Hz), the PLF internal acoustic response presents discrete peaks around 63 and 112 Hz, related to the 1st and 2nd longitudinal acoustic modes of the referred cavity,
while in the twilight zone, the responses do not present resonant peaks. his can be related to the “relative” high modal density in this frequency bandwidth due to the responses of the cylindrical and longitudinal beams, which inluence the cavity responses. However, in this frequency band, one can see sound pressure levels next to
(a)
140 dB. On the other side, the high frequency acoustic responses start from 120 dB at 350 Hz, with the reduction of the acoustic levels up to the higher frequencies (around 80 dB at 8,000 Hz).
COMMENTS AND CONCLUSIONS
he acoustic response of the VLS PLF was calculated by using coupled vibro-acoustic virtual prototypes, from 5 to 8,000 Hz. he low-, mid- and high-frequency bandwidths of PLF acoustic cavity were determined and three diferent vibro-acoustic models were adopted, being FEM/FEM for the low-frequency, hybrid FEM/ SEA for mid-frequency and SEA for the high-frequency analysis. Parameters as model accuracy, calculation time and allocated memory were considered to deine the low-frequency analysis’ upper limit, at 150 Hz. he mid-frequency intervals, in the twilight zone, were assumed to be the gap between the FEM/FEM model’s
upper limit and the lower limit, deined for the SEA model, which starts to yield reliable results at 300 Hz.
ROAD MAP FOR THE FUTURE
Detailed analysis may be done, considering the radiation eiciency of the structural subsystems and structural FE mesh reinement results may also be accessed.
Model validations may be done with real size acoustic test results.
ACKNOWLEDGEMENTS
This work is supported by Instituto de Aeronáutica e Espaço (IAE).
REFERENCES
Arenas, J.P. and Margasahayam, R.N., 2006, “Noise and Vibration of Spacecraft Structures”, Ingeniare. Revista chilena de ingeniería, Vol. 14, No. 3, pp. 251-264.
Coyette, J.P., Lecomte, C. and Meerbergen, K., 1997, “Treatment of Random Excitations Using SYSNOISE Rev. 5.3.1 - User’s Manual and Validation Manual”, LMS Numerical Technologies NV.
Craggs, A., 1973, “An Acoustic Finite Element Approach for Studying Boundary Flexibility and Sound Transmission Between Irregular Enclosures”, Journal of Sound and Vibration, Vol. 30, No. 3, pp. 343-357. doi:10.1016/S0022-460X(73)80243-3
Defosse, H. and Handi, M.A., 2000, “Vibro-Acoustic Study of Ariane V Launcher During Liftoff”, Proceedings of the Congress and Exposition on Noise Control Engineering, (INTERNOISE), Nice, France.
Langley, R.S., Shorter P.J. and Cotoni, V., 2005, “Predicting the Response Statistics of Uncertain Structures Using Extended Versions of SEA”, Proceedings of the Congress and Exposition on Noise Control Engineering, Rio de Janeiro, Brazil.
Lyon, R.H. and DeJong, R.G., 1995, “Theory and Application of Statistical Energy Analysis”, Second Ed., Butterworth-Heinemann, UK.
Pirk, R., Desmet, W., Pluymers, B., Sas, P. and Góes, L.C.S., 2002a, “Vibro-Acoustic Finite Element Analysis of the Brazilian Vehicle Satellite Launcher Fairing”, Proceedings of the 9th International Congress on Sound and Vibration (ICSV9), Orlando, USA.
Pirk R., Desmet W., Pluymers B., Sas P. and Góes L.C.S., 2002b, “Vibro-acoustic Analysis of the Brazilian Vehicle Satellite Launcher (VLS) fairing”, Proceedings of the International Conference on Noise and Vibration Engineering, ISMA, Leuven, Belgium.
Pirk, R. and Góes, L.C.S., 2005, “FEM/FEM Versus FEM/BEM Vibro-Acoustic Coupling Techniques Applied to the Brazilian Vehicle Satellite Launcher (VLS) Fairing Problem: Advantages and Drawbacks”,
Proceedings of the INTERNOISE, Rio de Janeiro, Brazil.
Pirk, R. and Góes, L.C.S., 2006, “Acoustic Theoretical x Experimental Comparison of the Brazilian Satellite Launcher Vehicle (VLS) Fairing”, Proceedings of the International Conference on Advanced Acoustics and Vibration Engineering, ISMA, Leuven, Belgium.
Pirk, R., Góes, L.C.S., Sas, P. and Desmet, W., 2005, “Vibro-acoustic Analysis of the Brazilian Satellite Launcher Fairing, Using SEA”, Proceedings of the XI DINAME, Ouro Preto, Brazil.
Pirk, R. and Souto, C.D.A., 2008, “Implementation of Acoustic Blankets to the VLS Fairing: a Sensitivity Analysis Using SEA”, Proceedings of the International Conference on Noise and Vibration Engineering, ISMA, Leuven, Belgium.
Pirk, R. and Souto, C.D.A., 2010, “Implementation of Acoustic Blankets in the VLS Fairing, Using Multi- and Single-Layered Models: a Sensitivity Analysis Using SEA”. Proceedings of the 17th International Congress on Sound and Vibration (ICSV), Cairo, Egypt.
Shorter, P.J., Cotoni, V. and Langley, 2004, “Numerical and Experimental Validation of Hybrid FE-SEA Method”, Proceedings of the National Conference on Noise Control Engineering, Maryland, USA.
Shorter, P.J., Cotoni, V. and Langley, R.S., 2005, “A Hybrid FE-SEA Method for the Analysis of Complex Vibro-Acoustic Systems”, Proceedings of the International Congress on Noise and Vibration Emerging Methods (NOVEM), St. Raphael, France.
Shorter, P.J. and Langley, R.S., 2005, “On the Reciprocity Relationship between Direct Field Radiation and Diffuse Reverberant Loading”, Journal of the Acoustical Society of America, Vol. 117, No. 1, pp. 85-95.