(Invited Paper)
Abstract— Several methods have been proposed to evaluate
theoretically and experimentally the performance of optically amplified direct-detection orthogonal frequency division multiplexing systems. In this paper, we review those methods, and highlight their main advantages and disadvantages.
Index Terms—Direct-detection, orthogonal frequency-division multiplexing, performance evaluation.
I. INTRODUCTION
In recent years, orthogonal frequency division multiplexing (OFDM) modulation has been proposed in optical communications due to its capabilities to compensate for linear fibre impairments. Direct-detection (DD) OFDM systems have been proposed for optical networks of different kinds, such as radio over access networks [1], [2], metro [3] and long-haul networks [4]. The performance of such networks is usually assessed using the bit error ratio (BER). Different methods have been used to evaluate the BER of DD-OFDM systems both theoretically and experimentally, for instances Monte Carlo (MC) simulation with direct error counting (DEC) [5], [6] and semi-analytical simulation [7].
In this paper, several methods of performance evaluation of optically amplified DD-OFDM systems are reviewed, and the main features and limitations of each method are highlighted.
The paper is organized as follows. In section II, two types of DD-OFDM optical communication systems are described and their main features and parameters are presented. In section III, the methods of performance evaluation of optically amplified DD-OFDM systems are presented and, in section IV, analysis of accuracy of those methods is presented and discussed. Section V summarizes the main conclusions.
II. DD-OFDM SYSTEM MODELING
The assessment of the methods presented in section III is performed for two types of DD-OFDM optical communication systems: transmission of OFDM ultra wideband (UWB) radio signals over long reach passive optical networks (LR-PON) and transmission of OFDM signals recently proposed for long haul networks. In this section, both DD-OFDM systems under analysis are described and
Theoretical and Experimental Performance
Evaluation Methods for DD-OFDM Systems
with Optical Amplification
Adolfo V. T. Cartaxo and Tiago M. F. Alves,
Group of Research on Optical Fibre Telecommunication Systems, Instituto de Telecomunicações, Department of Electrical and Computer Engineering, Instituto Superior Técnico,
their main parameters are presented.
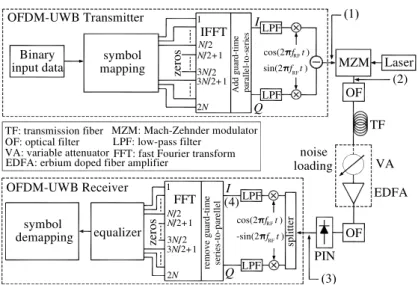
OFDM-UWB Transmitter
Binary symbol
input data mapping
1
ze
ro
s N
2
N +1 3N
3N +1
A d d g u ar d -t im e p ar al le l-to -s er ie s
cos(2 f tRF ) 2
2 2 2N
IFFT
sin(2 f tRF )
LPF LPF Laser MZM OF PIN
MZM: Mach-Zehnder modulator
EDFA: erbium doped fiber amplifier LPF: low-pass filter VA: variable attenuator
OF: optical filter TF: transmission fiber
FFT: fast Fourier transform
OFDM-UWB Receiver sp li tt er LPF LPF I Q re m o v e g u ar d -t im e se ri es -t o -p ar el le l FFT 1 N 2
N +1 3N
3N +1 2 2 2 2N ze ro s equalizer
cos(2 f tRF ) -sin(2 f tRF )
symbol demapping TF VA EDFA loading noise OF (2) (4) I Q
Fig. 1 - Block diagram of the OFDM-UWB system setup.
Binary symbol
input data mapping
1
ze
ro
s N
2
N +1 3N
3N +1
A d d g u ar d -t im e p ar al le l-to -s er ie s I Q 2 2 2 2N IFFT LPF LPF OFDM Transmitter I/Q TF VA EDFA OF PIN sp li tt er LPF LPF I Q re m o v e g u ar d -t im e se ri es -t o -p ar el le l FFT 1 N 2
N +1 3N
3N +1 2 2 2 2N ze ro s equalizer OFDM Receiver
cos(2 f tRF ) -sin(2 f t)
RF symbol demapping modulator Laser OF CW Laser CW
Fig. 2 - Block diagram of the OFDM system proposed for long-haul networks. Abbreviations are introduced in the text and
in Fig. 1.
A. Transmission of OFDM-UWB Radio Signals over Long Reach PONs
The transmission of OFDM-UWB radio signals considers quadrature phase-shift keying (QPSK) symbol mapping. The OFDM-UWB signal is composed by 128 subcarriers from which 100 subcarriers carry data information, 12 are pilots subcarriers, 10 are guard subcarriers and 6 are null subcarriers used in the edges of the OFDM spectrum to relax the filter requirements [8]. The bit rate of the QPSK-OFDM-UWB radio signal is 640 Mbit/s and the signal bandwidth is 528 MHz.
considered for transmission purposes. The noise loading circuit is used to adjust the optical signal-to-noise ratio (OSNR) to the desired level (in a reference optical bandwidth of 0.1 nm). At the optical receiver side, a second order super-Gaussian optical filter is used to reduce the optical noise power and a PIN photodetector with responsivity of 1 A/W is considered. In the electrical OFDM-UWB receiver, the I and Q components of the OFDM-UWB signal are recovered by using ideal local oscillators and filtered by sixth order Bessel LPF. The equalizer transfer function is estimated from the information provided by the pilot subcarriers.
B. Transmission of OFDM Signals over Long-Haul Networks
Fig. 2 shows the system setup considered for the transmission of OFDM signals in long-haul networks. 10 Gbit/s OFDM electrical signals using QPSK symbol mapping are transmitted by using 512 information subcarriers with 2-times oversampling. In order to overcome the degradation induced by the fiber dispersion, optical single side-band signals are generated by using an I/Q modulator to perform the electro-optic conversion [9]. In addition, the three MZM that comprise the I/Q modulator are properly biased to generate a signal with optical carrier suppression.
An optical average power of 3 dBm for the optical CW signal at the I/Q modulator input is considered. As a carrier-suppressed signal at the modulator output is obtained, a second laser is introduced in the system to allow for a DD optical receiver by adding an optical carrier to the OFDM optical signal. The optical carrier frequency is shifted by 7.5 GHz from the center frequency of the optical OFDM spectrum. Rather than adding an optical carrier frequency at the modulator output in order to use the DD receiver, an RF electrical carrier might be added to the I and Q electrical OFDM signal components before electro-optic conversion. However, the approach followed in this work ensures that, in the analysis of the performance degradation imposed by the external modulator nonlinearity, the degradation is only due to distortion induced on the OFDM signal and not on the carrier. The performance study accomplished for this DD-OFDM system configuration considers only back-to-back operation. At the PIN output, the OFDM signal bandwidth is 5 GHz bandwidth (centered around 7.5 GHz). The 5 GHz gap between DC and 5 GHz is used to accommodate the distortion induced by the subcarriers/subcarriers beat term. The equalizer transfer function is estimated using training symbols.
III. PERFORMANCE EVALUATION METHODS
A. Error Vector Magnitude
The EVM provides information on the magnitude of the symbols error of the received constellation of the OFDM signal when compared with the original non-distorted constellation. The RMS of the EVM (usually, the system performance is evaluated from the RMS of the EVM rather than from the EVM) is given by [10]:
2 ( ) ( ) 1
2 1 ( )
1 [ ] [ ] 1 [ ] Ns l l
Ni o i
l
RMS Ns
i k l
i l
s k s k
EVM N s k = = = − =
∑
∑
∑
(1)
where Ns is the number of transmitted OFDM symbols, Ni is the number of information OFDM subcarriers and ( )
[ ]
l i
s k and ( )
[ ]
l o
s k are the signal corresponding to the k-th subcarrier of the l-th OFDM symbol of the ideal constellation and of the constellation obtained at the equalizer output, respectively. The error quantified by the EVM can arise from two different effects: noise and distortion of the received signal. Thus, if the distortion is negligible when compared with the noise, the information provided by the EVM is similar to the one provided by the SNR of each OFDM subcarrier. The SNR of the OFDM signal can be written as:
2 ( )
1
2
1 ( )
1 [ ] 1 [ ] Ns l
Ni o
l Ns
i k l
o l s k SNR N n k = = = =
∑
∑
∑
(2)
where ( )
[ ]
l o
n k is the noise that is affecting the k-th subcarrier of the l-th OFDM symbol at the equalizer output (the noise is evaluated along the subcarrier bandwidth). Notice that, in the case of negligible distortion, equations (1) and (2) show that
(
)
2RMS
SNR= EVM − .
B. BER Evaluated from the EVM
Considering that the error of the received symbols is well described by a Gaussian distribution, the BER of each OFDM subcarrier can be evaluated from the EVM of each subcarrier by using standard expressions used to evaluate the performance of M-ary quadrature amplitude modulation (QAM) formats. In actual systems, the SNR and distortion of the different OFDM subcarriers is not the same due to the non-ideal response of the devices used along the system setup. In order to consider the different SNR levels of each subcarrier, the BER can be evaluated from the EVM of each OFDM sub-carrier. For a QAM symbol mapping with 2
2 n
M = , where n is an integer, the BER of k-th subcarrier can be written as [11], [12]:
− − = M k EVM M M M M k BER
RMS2 2
2
2 [ ]log
where EVMRMS[ ]k is the EVM RMS of subcarrier k given by:
2
( ) ( )
1
2 ( )
1
[ ] [ ] [ ]
[ ]
Ns
l l
o i
l
RMS Ns
l i l
s k s k
EVM k
s k =
=
−
=
∑
∑
(4)
Equation (3) has been derived considering that the error vector magnitude is dominantly impaired by noise. Therefore, the validity of using (3) to estimate the BER of systems where the degradation caused by distortion cannot be neglected must be carefully assessed.
C. BER Evaluated from the Q-factor
In order to consider the different SNR levels of each subcarrier as it occurs in real systems, the BER can be evaluated from the Q-factor of each OFDM sub-carrier. In this approach, it is assumed that QPSK mapping is used, and it is considered that the distortion of the I and Q components of the received symbols is similar, being the threshold levels located at half-distance between adjacent points in the ideal constellation. The Q-factor of each OFDM sub-carrier can be evaluated as:
[ ]
[ ]
[ ]
[ ]
[ ]
Q I
I Q
m k m k
Q k
k k
σ σ
= =
(5)
where m(I Q, )
[ ]
k and σ(I Q, )[ ]
k are the mean and the standard deviation of the I or Q component of thereceived symbols of the k-th subcarrier, respectively, given by:
( )
[ ]
( )( )
[ ]
, , ,
1
1 Ns l
I Q o I Q
s l
m k s k
N =
=
∑
(6)
( )
[ ]
( )( )
[ ]
( )[ ]
2
, , , ,
1
1 Ns l
I Q o I Q I Q
s l
k s k m k
N σ
=
=
∑
− (7)
Using eq. (5), the BER of each subcarrier is given by:
[ ]
1erfc[ ]
2 2
Q k BER k
=
(8)
The BER of the entire OFDM system can then be computed by averaging the BER of each subcarrier over all the information subcarriers:
1 [ ]
Ni
i k
BER BER k N
=
=
∑
(9)
D. BER Evaluated from the SAGA
the distribution of the distortion. Further details regarding this approach can be found in [7], where lengthy expressions for the variance of each subcarrier at the equalizer output are derived and presented.
E. BER Evaluation of Experimental DD-OFDM Setups
The estimation of the BER of DD-OFDM experimental setups considers a Gaussian distribution for each (I or Q) component of each OFDM subcarrier of each OFDM symbol and uses an exhaustive Gaussian approach (EGA) in order to correctly characterize the statistical distribution of the distortion:
∑
∑
= = = = − + − = s Q I s Q I N ka IQ
Q I Q I s N k
a IQ
Q I Q I s Q I k k F k m Q N k k m k F Q N k BER 1 ] [
1 (( ,) )
) , ( ) ( ) , ( 0 ] [
1 ((,) )
) ( ) , ( ) , ( ) , ( ) ( ) , ( ) ( ) , ( ] [ ] [ ] [ 1 ] [ ] [ ] [ 1 ] [ γ γ γ γ γ γ γ γ σ σ (10)
where ( ) ( , )I Q[ ]
mγ k
is the mean and ( ) ( , )I Q[ ]k
γ
σ is the standard deviation (STD) of the I or Q component of the k-th subcarrier of the γ-th OFDM symbol at the system output, respectively. In eq. (10), F( , )I Q[ ]k is
the decision threshold level and Ns is the number of OFDM symbols in each run. Though eq. (10)
considers binary phase shift keying (BPSK) or quadrature phase shift keying (QPSK), it can be easily generalized to other more spectrally efficient mappings.
The overall BER is evaluated using eq. (9), with
[ ]
(
)
(
)
− − −= BERI BERQ
k
BER 0.51 1 1
(11)
for QPSK and
[ ]
k BERI[ ]
kBER = (12)
for BPSK mapping (considering the information transmitted in the real axis).
The mean and the STD of each subcarrier of each OFDM symbol can be easily evaluated from a set of experimental runs as:
( ) ( ) ( , ) ( , ), 1 1 [ ] [ ] Nr
I Q I Q n
r n
m k y k
N
γ γ
=
=
∑
(13)
(
)
2( ) ( ) ( ) ( , ) ( , ), ( , ) 1 1 [ ] [ ] [ ] Nr
I Q I Q n I Q
r n
k y k m k
N
γ γ γ
σ
=
=
∑
−(14)
where ( ) ( , ),I Q n[ ]
yγ k is the I or Q component of the subcarrier transmitted in the n-th run and Nr is the number of runs.
IV. RESULTS AND DISCUSSION
conditions and for the two types of DD-OFDM systems described in section II. The evaluation of the RMS of the EVM, of the SNR and of the Q-factor is performed considering 50 noise runs (each run is composed by 32 OFDM symbols) whilst the BER obtained by direct error counting from MC simulation is evaluated when 100 errors occur in the subcarrier with worst performance.
By the end of this section, the accuracy of the BER evaluated from the EGA presented in section III for experimental setups is also analyzed. In this case, a similar setup to the one presented in Fig. 1 has been implemented in the laboratory and the BER of the received OFDM-UWB radio signal estimated from DEC has been compared by the one provided by the EGA.
A. OFDM-UWB Radio Signals
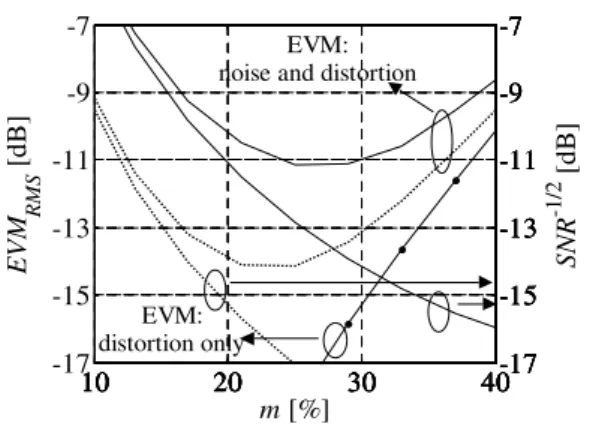
In this section, the EVM and the BER of the OFDM-UWB signal is evaluated as a function of the modulation index of the MZM. The modulation index is defined asm=VRMS Vb, with VRMS the RMS voltage of the OFDM signal applied to the MZM arms and Vb the MZM bias voltage.
10 20 30 40
-17 -15 -13 -11 -9 -7
E
V
M R
M
S
[
d
B
]
10 20 30 40-17
-15 -13 -11 -9 -7
S
N
R
-1
/2 [
d
B
]
10 20 30 40-17
-15 -13 -11 -9 -7
10 20 30 40-17
-15 -13 -11 -9 -7
m [%]
10 20 30 40-17
-15 -13 -11 -9 -7 EVM:
noise and distortion
EVM: distortion only
Fig. 3 - RMS of the EVM and 1 / 2
SNR−
as a function of the modulation index for different OSNR levels. OSNR=11 dB (continuous lines) and OSNR=15 dB (dotted lines).
Fig. 3 shows the RMS of the EVM of the received OFDM signal, in decibel, as a function of the modulation index for different OSNR levels. Back-to-back operation and a RF frequency, fRF, of 3.4
GHz are considered. Fig. 3 depicts also 1 / 2
SN R− , and
RMS
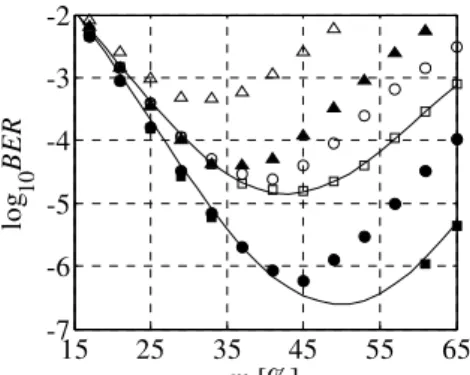
15 25 35 45 55 65 -7
-6 -5 -4 -3 -2
m [%]
lo
g 10
B
E
R
Fig. 4 - BER as a function of the modulation index considering an OSNR of 13 dB from SAGA (lines), from the Q-factor (circles) and from the EVM (triangles). Empty marks correspond to fRF =10.3 GHz and 80 km of SSMF, and filled marks
correspond to fRF = 6.1 GHz and 50 km of SSMF. BER estimates obtained using DEC are shown by squares.
Fig. 4 depicts the BER as function of the modulation index considering the transmission of two OFDM-UWB signals located in two different UWB sub-bands and for two different lengths of SSMF (indicated for LR-PONs). The BER is evaluated from the Q-factor, from the RMS of the EVM of each subcarrier and using SAGA. In order to analyze their validity range, the BER obtained by using the DEC method is also shown.
The analysis of the validity range of the BER estimates given by the different approaches shown in Fig. 4 should be accomplished in three steps: i) for low modulation indexes, i. e., the MZM is operating in the linear regime; ii) for high modulation indexes where the MZM regime is operated in a strong nonlinear regime; and iii) around the optimum modulation index.
When the MZM is operating in the linear regime, the distortion induced by the MZM on the OFDM-UWB signal is negligible and the noise is the main performance impairment. In addition, as wide optical and electrical filters are used, the amplitude reduction between the OFDM subcarriers is identical leading to similar SNR levels between the different subcarriers. Hence, the BER estimates provided by all the approaches show very good agreement independently of the system parameters.
When high modulation index levels are considered, the MZM is operating in the nonlinear regime and the system performance is imposed mainly by the MZM-induced distortion. The results of Fig. 4 show that, in this situation, only the SAGA presents excellent agreement with DEC in the estimation of the BER due to the exhaustive Gaussian approach used to characterize the statistical distribution of the subcarriers distortion. Among the other approaches, the worse BER estimation is obtained using the EVM, as this approach considers a Gaussian distribution for the distortion.
Similar conclusions to the ones obtained for high modulation indexes regarding the accuracy of using the SAGA or the EVM to estimate the BER are obtained when the modulation index leads to similar noise and distortion contributions (around the optimum modulation index).
reduction on the amplitude of the subcarriers and it is strongly dependent on the fiber transmission length and on the subcarrier frequency [13]. When some subcarriers suffer from a severe power fading, the SNR of those subcarriers is further reduced leading to significantly different BER levels between the subcarriers.
B. OFDM Signals for Long-Haul Networks
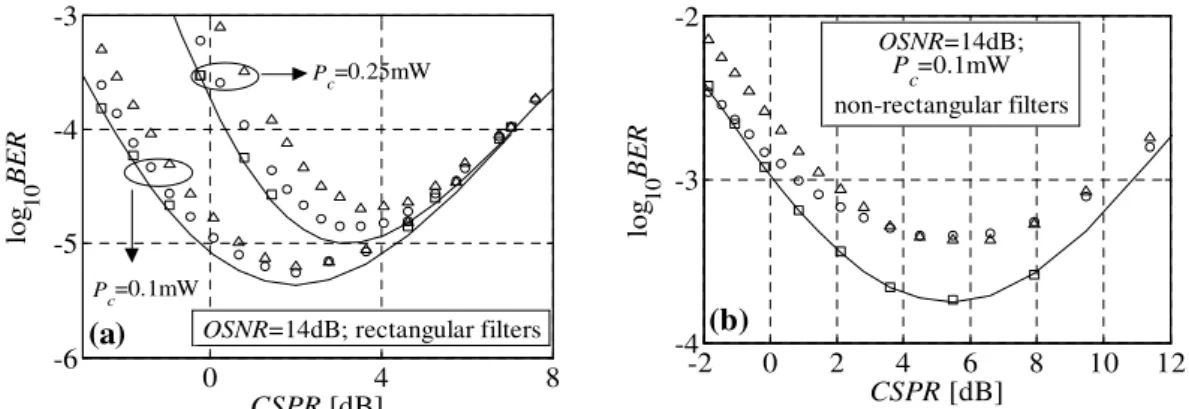
In this section, the BER estimates are obtained by all the approaches presented in section II as a function of the carrier-to-signal power ratio, CSPR=P Pc OFDM , where Pc is the average optical power of the carrier added at the I/Q modulator output and POFDM is the optical power of the OFDM signal.
0 4 8
-6 -5 -4 -3
CSPR [dB]
lo
g 10
B
E
R
P
c=0.1mW
Pc=0.25mW
OSNR=14dB; rectangular filters
(a)
-2 0 2 4 6 8 10 12
-4 -3 -2
CSPR [dB]
lo
g 10
B
E
R
(b)
OSNR=14dB;
P
c=0.1mW
non-rectangular filters
Fig. 5 - BER as a function of the CSPR considering (a) rectangular optical and electrical filters and (b) 2-nd order super-Gaussian optical and 6-th order Bessel electrical filters. Results obtained by DEC (squares), by the SAGA method
(continuous lines), from the Q-factor (circles) and from the EVM (triangles).
performance is controlled by the average carrier power level and also by the ratio between the optical power levels of the CW signal at the modulator input and of the OFDM signal, as they impose the operation regime of the modulator. Fig. 5 (a) shows a BER degradation when Pc increases. This effect is attributed to the distortion induced by the modulator caused by the increase of the OFDM signal power for the same CSPR level.
Despite rectangular filters lead to similar SNR levels along the different OFDM subcarriers, in actual systems the non-ideal frequency response of the different devices may lead to significant SNR variations along the different OFDM subcarriers. Fig. 5 (b) shows results similar to Fig. 5 (a) but considering second order super-Gaussian optical filters (-3 dB bandwidth of 15 GHz) and sixth order Bessel electrical filters (-3 dB bandwidth of 2.5 GHz). Although an excellent agreement between the BER estimates given by the SAGA and DEC is observed, there is a significant mismatch on the BER estimates provided by Q-factor.
Further analysis showed that, for lower BER levels, discrepancies higher than 3 orders of BER magnitude between the estimates given by the SAGA and the EVM or the Q-factor approaches can be observed.
C. BER of DD-OFDM experimental setups
The experimental assessment of the accuracy of the EGA is accomplished for OFDM-UWB radio signal transmission. In this case, a similar setup to the one presented in Fig. 1 has been implemented in the laboratory, and the BER of the received OFDM-UWB radio signal estimated from DEC has been compared to the one obtained by EGA. In addition, the BER of the experimental setup provided by the Q-factor and EVM approaches has been also evaluated.
In order to validate the Gaussian distribution used in the EGA, the actual probability density function (PDF) of each subcarrier at the system output has been obtained experimentally and compared with the Gaussian PDF with mean and STD estimated by (13) and (14), respectively. Both PDFs are evaluated over 4×10⁵noise runs with each run composed by 32 OFDM-UWB symbols.
-3 -2 -1 0 1 2 3
-3.5 -2.5 -1.5 -0.5 0.5
signal amplitude
lo
g 10
P
D
F
Fig. 6 shows the PDFs of the Q component of two subcarriers (those ones of the edges of the OFDM-UWB spectrum) for OSNR =27.3dB. The results show that the PDF of each subcarrier is accurately described by the Gaussian distribution evaluated using the mean and the STD of the OFDM-UWB signal acquired experimentally. Further inspection showed that the other OFDM subcarriers are also well described by Gaussian distributions.
0 20 40 60 80 100
-8 -6 -4 -2
subcarrier index
lo
g 10
B
E
R
OSNR=27.3dB
Fig. 7 - BER as a function of the subcarrier index. BER obtained from EGA (continuous line) and DEC (squares).
One of the main advantages of the EGA is the possibility of quickly estimating correctly the BER of each subcarrier using eq. (10). Fig. 7 depicts the BER for each subcarrier obtained from the EGA and from DEC. The subcarriers with higher indexes correspond to subcarriers transmitted at higher frequencies. In order to have reasonable BER estimation for the subcarriers with lower BER levels, the BER obtained by DEC is evaluated when at least 100 errors occur in the subcarrier with better performance. Additionally, 1000 noise runs and 32 OFDM-UWB symbols have been considered for the BER estimation using EGA, as these values lead to stabilized estimates. Fig. 7 shows excellent agreement between the BER obtained by DEC and the BER estimated by the EGA. The worse BER achieved for the subcarriers with low/high indexes is due to the non-rectangular amplitude response of the electrical devices, namely the LPFs used.
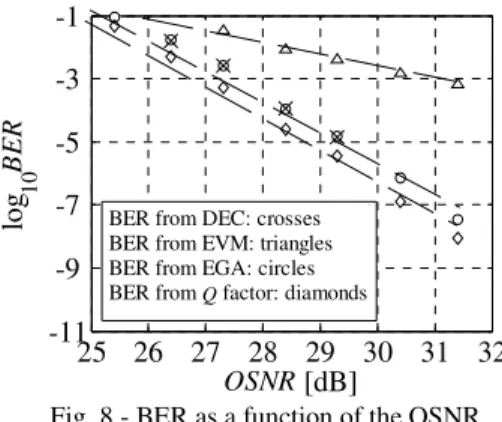
25 26 27 28 29 30 31 32 -11
-9 -7 -5 -3 -1
OSNR [dB]
lo
g 10
B
E
R
BER from DEC: crosses BER from EVM: triangles BER from EGA: circles BER from Q factor: diamonds
Fig. 8 - BER as a function of the OSNR.
discrepancies when compared with the BER estimates obtained through DEC as the different SNR levels and distortion distribution of each subcarrier are not correctly taken into account.
The computation or the experimental time required to obtain the BER through DEC method increases remarkably with the OSNR increase. Instead, the other methods allow obtaining BER estimates within acceptable time interval (within a few minutes), and the time required does not usually depend on BER level. From these methods, SAGA and EGA are preferable: the former allows evaluating the BER through simulation with excellent accuracy for a wide range of system conditions; the later also presents excellent accuracy and it is a very useful alternative to the conventional DEC approach. Notice that, with a 3 GHz Core2Duo PC with 8 GB of RAM, the time required by SAGA to compute the BER is about 5 minutes for a signal with 32 OFDM symbols (EVM takes approximately the same time), and the time required by EGA to assess experimentally the BER is about 15 minutes.
V. CONCLUSION
Different methods of performance evaluation of optically amplified DD-OFDM systems have been reviewed. The main features and limitations of each method have been highlighted. It has been shown that, under general conditions of signal distortion and signal to noise ratio, the semi-analytical Gaussian approach (SAGA) provides quite accurate bit error probability estimates in excellent agreement with the ones obtained by Monte Carlo simulation. On the other hand, the exhaustive Gaussian approach (EGA) allows experimental evaluation of the bit error ratio in excellent agreement with the ones obtained by direct error counting. Both SAGA and EGA approaches have the advantage of much shorter times to provide performance estimates than using the error counting approach.
ACKNOWLEDGEMENT
This work was supported in part by the European Union FIVER-FP7-ICT-2009-4-249142 project and the Portuguese Fundação para a Ciência e a Tecnologia -funded TURBO-PTDC/EEA-TEL/104358/2008 project.
The work of T. Alves was supported by Fundação para a Ciência e a Tecnologia from Portugal under Contract SFRH/BD/29871/2006.
REFERENCES
[1] Llorente, R., Alves, T., Morant, M., Beltran, M., Perez, J., Cartaxo, A., and Marti, J., “Ultra-wideband radio signals distribution in FTTH networks”, Photonics Technology Letters, Vol. 20, No. 1, pp. 945-947, 2008.
[2] C. Lin, Y. Lin, J. Chen, S. Dai, P. Shih, P. Peng and S. Chi, ”Optical direct-detection OFDM signal generation for radio-over-fibre link using frequency doubling scheme with carrier supression", Optics Express, Vol. 16, No. 9, pp. 6056-6063, 2008.
[3] Tang, J. M., Lane, P. M., and Shore, K. A., “30 Gbit/s transmission over 40km directly modulated DFB laser-based SMF links without optical amplification and dispersion compensation for VSR and metro applications”, Paper no. JThB8, Proceedings of the Optical Fiber Communication Conference, OFC’06, Anaheim, USA, 2006.
[4] Schmidt, B., Lowery, A. J., and Armstrong, J., “Experimental demonstrations of electronic dispersion compensation for long-haul transmission using direct-detection optical OFDM”, Journal of Lightwave Technology, Vol. 26, No. 1, pp. 196-203, 2008.
[6] Buchali, F., and Dischler, R., “Optimized sensitivity direct detection O-OFDM with multi level subcarrier modulation”, Paper OMU5, Proceedings of the Optical Communications Conference, OFC’08, California, USA, 2008.
[7] Alves, T., and Cartaxo, A.,”Semi-analytical approach for performance evaluation of direct-detection OFDM optical communication systems”, Optics Express, Vol. 17, No. 21, pp. 18714-18729, 2009.
[8] ECMA International 2007, High Rate Ultra Wideband PHY and MAC Standard, 2nd Edition, Genève, Switzerland, December.
[9] Fonseca, D., and Cartaxo, A., “Modelling and experimental validation of an x-cut four phase modulators structure”, Proc.-Optoelectronics, Vol. 153, No. 4, pp. 145-151, 2006.
[10] Alves, T., and Cartaxo, A., “Analysis of methods of performance evaluation of direct-detection OFDM communication systems”, Fiber and Integrated Optics, Vol. 29, No. 3, pp. 170-186, 2010.
[11] Proakis, J., Digital Communications, New York, McGraw-Hill, 2001.
[12] Shafik, R. A., Rahman, M. S., and Islam, A. R., “On the extended relationships among EVM, BER and SNR as performance metric, Proceedings of the International Conference on Electrical and Computer Engineering, ICECE’06, Bangladesh, December, pp. 408-411, 2006.