Abstract
Low-velocity impacts have a relevant importance for safety of laminat-ed and sandwich composite structures, because they are highly suscep-tible to damage. In this paper, a 3D cost effective zig-zag model is developed in order to efficiently simulate such impacts. It a priori fulfills the continuity of out-of-plane stresses at layer interfaces, the continuity of stresses under in-plane variation of properties across undamaged and damaged regions and it is suitable for general bounda-ry conditions. Its main advantage is its capability to accurately predict stresses from constitutive equations at a low cost, along with being refined across the thickness keeping fixed the number of unknowns. A modified Hertzian contact law that forces the target to conform to the shape of the impactor and the Newmark’s implicit time integration scheme are used for computing the contact force time history. The progressive damage analysis is carried out using stress-based criteria. Non-classical feature, a continuum damage mesomechanic model is employed that accounts for the effects of local failures in homogenized form by modifying the strain energy expression. Fiber, matrix and delamination failures are predicted using stress-based criteria, and then the modified strain energy expression is employed for computing stresses. Such modeling options enable to account for the residual properties as they are in the reality, as shown by the comparison with the damage experimentally detected. As shown by the comparison with experiments, a closed-form solution by the Galerkin’s method, obtained as a series expansion of trial displacement functions, accurate-ly simulates the contact force and the damage progressiveaccurate-ly accumu-lated. The results show the importance of in-plane stress continuity for obtaining accurate predictions.
Keywords
Impact-induced damage; 3D variable-kinematics zig-zag model; undamaged/damaged stress continuity; interlayer stress continuity; fixed d.o.f; mesomechanic damage model.
Impact Damage Analysis with Stress Continuity
Constraints Fulfilment at Damaged-Undamaged
Regions and at Layer Interfaces
Ugo Icardi a Andrea Urraci b
a Associate Professor - Dipartimento di
Ingegneria Meccanica e Aerospaziale Politecnico di Torino - Corso Duca degli Abruzzi 24, 10129 Torino, Italy – ugo.icardi@polito.it
b PhD Student - Dipartimento di
Ingegneria Meccanica e Aerospaziale Politecnico di Torino - Corso Duca degli Abruzzi 24, 10129 Torino, Italy – andrea.urraci@polito.it
http://dx.doi.org/10.1590/1679-78253875
1 INTRODUCTION
Laminated and sandwich composites are increasingly used as primary structural components by virtue of superior specific elastic moduli, strength, energy absorption and dissipation properties. Higher speed, longer range, larger payloads, less engine power and better operating economy can be achieved using these materials.
Owing to elastic moduli and strengths in the thickness direction that are much smaller than their in-plane counterparts, warping, shearing and straining deformations of the normal and out-of-plane stresses rise that are responsible of local micro-failures and, consequently, of relevant loss of strength and stiffness. As the damaged area may increase in size under loading in service, till caus-ing a premature failure, the basic requirement is that composites must carry the ultimate design load even when they are damaged. So, accurate numerical simulations are required to understand the effects of the damage accumulated in service. Manufacturers have found a high susceptibility to impact damage from dropped tools, vehicular collisions and to damage caused by drilling. A critical case for aircraft structures is impact from crushed stones during taxiing manoeuvres and take-off.
The readers are referred to the papers by Richardson and Wisheart (1999), Morinière et al. (2014) and by Abrate (2001, 2014) for a comprehensive review of low-velocity impact studies on laminates. Methods for predicting delamination induced by low-velocity impacts are discussed by Elder et al. (2004). A review of numerical and experimental impact studies on sandwich panels, a discussion of their damage mechanisms and of failure criteria used in the simulations are given by Chai and Zhu (2011). An overview of damage models is also given by Garnich and Akula Venkata (2009), Liu and Zheng (2009) and Berthelot (2003). The damage analysis of honeycomb sandwich panels carried out by Horrigan and Staal (2011) is also cited as a relevant contribution in the field. A comparison of simulations and experiments is given by Hongkarnjanakul et al. (2013). The effects of stacking sequence on the impact and post-impact behaviour is shown by Aktas et al. (2013), those of the impactor shape are studied by Mitrevski et al. (2005). Multiple impacts are investigated by Damanpack et al. (2013) and Chakraborty (2007). The impact behaviour of different honeycomb core cells is shown by Yamashita and Gotoh (2005).
The structural models play a central role in the simulation procedure, since they should accu-rately describe the behaviour of composites requiring a low computational effort, as many iterations are required to solve the impact problem. An extensive discussion of structural models used in the simulations and extensive assessments of their performances are given by Chakrabarti et al. (2011), Chen and Wu (2008), Kreja (2001), Zhang and Yang (2009), Tahani (2007) and Matsunaga (2004). In a broad outline, three-dimensional finite element discretization (3D-FEA), refined plate mod-els (R-M) and related plate elements are of interest for damage analysis. R-M can be further split into: Discrete-Layer models (DL) with a separate representation across each computational/physical layer, High-Order Layerwise models (HLW) based on a combination of global higher-order terms and local layerwise functions and physically-based zig-zag models (ZZ-F) with fixed degrees of free-dom (d.o.f.) that a priori fulfil the displacement and stress continuity conditions at the material interfaces.
Oñate et al. (2012a, 2012b) have shown that ZZ-F and even equivalent single layer models (ESL) can be can be successfully used in order to save costs.
Recent studies have shown that stress predictions as accurate as those by 3D-FEA and DL can be obtained using global-local models, as shown by Zhen and Wanji (2006, 2010), Wanji et al. (2007), Zhen et al. (2009), as well as incorporating zig-zag functions based either upon kinematic assumptions, e.g. Murakami (1986), or physical assumptions, e.g. Tessler et al. (2009, 2010) and Iurlaro et al. (2014). Accurate results have been obtained by Icardi and Sola (2014a, 2014b) using ZZ-F of the latter type, with fixed d.o.f. and variable kinematic, with a processing time and memory storage occupation comparable to those minimal of ESL. Although these features make such models suitable for low-velocity impact studies, no applications have been presented yet in literature.
To contribute to fill the existing gap, in this paper a low velocity impact analysis is carried out using as structural model a refined version of the variable kinematic zig-zag model (VK-ZZ) with fixed d.o.f. developed by Icardi and Sola (2014a), having as functional d.o.f. the two in-plane dis-placement components, the transverse one and the two shear rotations at the reference middle-plane. So, the characteristic feature of this model is that its number of unknowns neither increases with the number of physical or computational layers (i.e. refining the representation across the thickness), nor with the number of constraints enforced. The present refined version of the VK-ZZ model makes continuous the stresses at the interfaces of undamaged and damaged regions, where material properties suddenly vary, not just across the thickness, i.e. at layer interfaces as in the former version.
Zig-zag functions making piecewise variable displacements are incorporated in order to a priori fulfil the 3D stress contact conditions at the interfaces of physical/computational layers and of un-damaged and un-damaged regions, as prescribed by the elasticity theory for satisfying equilibrium. The assumed displacements a priori satisfy the stress boundary conditions at the upper and lower bounding surfaces and general boundary conditions at the edges as well. The fulfilment of local equilibrium equations is enforced at selected points across the thickness, in order to define the coef-ficients of high-order contributions of displacements that enable a variable representation from point to point.
By virtue of an accurate representation of strain energy density, displacement, strain and stress fields obtained through a realistic representation of warping, shearing and straining deformations, the present model efficiently computes the stress field at each time step from constitutive equations, even when the constituent layers have distinctly different properties.
To speed-up computations and to overcome algebraic difficulties, closed form expressions of its coefficients and zig.zag amplitudes are obtained once for all in terms of the 5 functional d.o.f. and of their derivatives using symbolic calculus. A C0 formulation of the model useful for developing effi-cient finite elements free from nodal d.o.f. derivatives can be obtained from the present VK-ZZ model applying the technique as shown in Icardi and Sola (2014c). However, in the present paper this technique is left apart.
damaged area, they are determined using the continuum damage mesomechanic model by Ladevèze et al. (2006) that accounts for the effects of hard discontinuities in homogenized form through a modified version of the strain energy. The transverse cracking rate and delamination ratios are computed using the stress-based criteria at each step, then the homogenized energy that accounts for the damage is computed and used for evaluating stresses at each point.
The modified Hertzian contact law of Icardi and Ferrero (2009) is adopted to compute the con-tact force for laminates. The refined concon-tact model by Palazotto et al. (2000b) that forces the target to conform to the shape of the impactor is employed to compute the contact radius at each time step when sandwiches are analysed.
Hertzian contact is chosen being proven to be accurate by a plenty of studies (see, e.g. Yigit and Christoforou (1995) for laminates and Choi (2006) for sandwiches), nevertheless it was devel-oped for isotropic media. A different alternative approach accounting for the heterogeneous nature of composites is that developed by Chao and Tu (1999). In this case, the contact stresses are de-rived via an energy variational approach, accounting for three-dimensional boundary conditions and interlaminar continuity. Another alternative approach is developed by Zhou and Stronge (2006), where the load-indentation law of sandwiches is obtained via FEA (ABAQUS/Explicit) assuming the elastic face sheets and rigid-perfectly plastic the core. Application of these more advanced con-tact models is left to a future study.
The Newmark’s implicit time integration scheme is used in the present paper for solving transi-ent dynamic equations, despite experimtransi-ents have shown that low-velocity impact studies could be carried out also in static form (see, Li et al. (2012)). One practical reason for carrying out a transi-ent analysis is that dynamic effects can be captured progressively increasing the impactor velocity, thus a unique scheme can be used for a wide range of applications. Another reason is that the com-putational cost of Newmark’s implicit time integration scheme is not much higher of that required by a static analysis carried out at each load step in order to capture the evolving damage.
Differently to paper by Icardi and Ferrero (2009), where non-linear strains of von Karman type are adopted, here the updated Lagrangian approach is chosen to efficiently account for geometric nonlinearity. Accordingly, the deformations at each new time step are obtained from the geometry of the structure at the previous step, not from the initial unloaded configuration.
Since core crushing is governed by the properties of the cellular structure of honeycomb, it can-not be appropriately accounted for by the present multi-layered VK-ZZ model that describes the core as a thick layer with homogenized properties. Therefore, the variable, apparent elastic moduli of the core while it collapses/buckles under transverse compressive loading are computed apart once for all through a detailed three-dimensional finite element analysis and provided to the VK-ZZ as variable properties at each load level, like in Icardi and Sola (2015).
obtained considering a damage mesomechanic model that accounts for the effects of hard disconti-nuities in homogenized form.
2 CONTACT FORCE MODELLING
Since the literature shows that the contact pressure profile is less important than the load and the area over which it acts, the contact stress is assumed to be distributed according to the Hertzian law, like in homogeneous isotropic materials as:
(
2 2)
( )r (0) 1 r /Rcontact if ( ( )r 0 if r Rcontact)
s =s - s = > (1)
In the former equation, Rcontact is the radius of the contact area, while s( )r , s(0)are the Hertz-ian stress intensity at a distance r from the center and at the centre, respectively. The impactor is
assumed to be spherical, as no details regarding the real shape of the contact area and the real dis-tribution of the force acting on it are available in the literature for other impactor shapes. The analysis of laminates is carried out assuming Rcontact as a fixed variable, while for sandwiches it is
computed at each step by forcing the target to conform to the shape of the impactor.
2.1 Laminates
In the loading phase, the contact force F is related to the indentation depth α through the contact stiffness Kc in standard form as:
c
F =K au (2)
A 3D Finite element analysis, here referred as PFEA-1 (see Figure 1) is performed apart once for all as a virtual material test (VMT) for determining Kc and Rcontact. A non-linear model
(RA-DIOSS -MAT25) is used to account for the failures occurring in the target structure, as described in section 3.
The exponent υ is set in agreement with experiments in the literature. Also in the unloading phase
0
0 q
m m
F F a a
a a
æ - ö÷
ç ÷
= çç ÷÷
ç
-è ø (3)
the exponent q is set according to experiments. In the previous equation, Fm is the maximum of the
contact force, αm is the relative indentation depth at each loading and α0 is the permanent
indenta-tion. In case of bounces, the following reloading law is assumed:
'
0
( )p
F =k a-a (4)
The literature shows that υ= p= 1.5 and q= 2.5 is very often the most appropriate choice for lami-nates.
Figure 1: Stages of the procedure to solve the problem.
2.2 Sandwiches
A constant R contact being inappropriate for simulating sandwich panels with lightweight soft core,
the iterative algorithm by Palazotto et al. (2000b) is applied to compute the contact radius, as it forces the impact area to conform to the shape of the impactor at any load increment. The problem is solved using a modified version of the Newton-Raphson method:
(
( 1))
( 1) ( 1) 0i i i i
c S
d d
d = é - ù - - - ¹
ê ú
ëK û F (5)
because the solution depends both on the current configuration, the previous history and local de-formations can be quite large. The secant stiffness matrix [K(d)]S is computed using the VK-ZZ
model of section 4. The symbols d (i-1) and δirepresent the converged solution at the previous load
increment Fc(i-1) and the residual force, respectively. The displacement amplitude vector d(i-1) is
updated by di in order to make the structure in equilibrium with Fci. Displacements are applied
during iterations till the impactor and the indentation radii conform:
(
(i 1))
i i Td - d d
é ù D = ê ú
ëK û (6)
( )
d Té ù
( 1)
i i i
d =d - + Dd (7)
The process is repeated till the convergence tolerance is reached. The convergence tolerance is confronted with the percentage of variation of the solution, from the current to the previous itera-tion using the norm of displacements
( )
2 in j n
d =
å
d (8)to compute 1 i i i d d D d + é ù
ê - ú
ê ú
ë û
= (9)
The iterative process is stopped when D ≤ 1 %. Once a converged solution is obtained, the fail-ure analysis is carried out.
3 DAMAGE AND POST-DAMAGE MODELLING
Stress-based criteria with a separate description of various failure modes are used to estimate where the constituent materials are failed.
3.1 Failure Criteria
The 3-D criterion developed by Hashin and Rotem (1973) with in-situ strengths is used to predict the fibre and matrix failures. Tensile failure is ruled by:
(
)
2
11 2 2
12 13 11
2 12 13
1
1 , ( 0)
t
X S
s t t s
= æ ö÷
ç ÷ + + = >
ç ÷
ç ÷
çè ø (10)
t
X being the tensile strength of fibres, S12 13= the in-situ shear strength of the matrix resin and s11,
12
t , t13 the tensile and shear stresses acting on the fibres. Compressive failure is predicted by:
11 Xc , ( 11 0)
s = - s < (11)
c
X being the compressive strength of fibres. Matrix failure under traction is described by:
2 2 2
22 33 2 12 13
23 22 33 22 33
2
12 13 12 13
23
1
( ) 1 ( 0)
t S S
Y S
s s t t
t s s s s
= =
æ + ö÷ æ ö÷ æ ö÷
ç ÷ + - +ç ÷ +ç ÷ = + >
ç ÷ ç ÷ ç ÷
ç ÷ ç ÷ ç ÷
ç ç ç
è ø è ø è ø (12)
while under compression it is described by:
2 2 2 2 2
22 33 23 22 33 12 13
22 33 2 2 2
23 23 23 12 13
22 33
( ) ( ) ( )
1
1 ( ) 1
2 4 ( 0) c c Y S
Y S S S
s s t s s t t
s s
s s
=
éæ ö ù + - +
êçç ÷÷ - ú + + + + = êçç ÷÷÷ ú
êè ø ú
ê ú
ë û
+ <
Delamination failure is predicted using the criterion developed by Choi and Chang (1992):
2 1 1
2
1 1 1
n n n
yz xz yy
d a n n n
i i i
e D
S S Y
s s + s +
+ +
é ù
ê ú
= ê + + ú >
ê ú
ë û
(14)
where n 1 n 1 t
Y + =Y + if syy ³0, or n 1 n 1 c
Y + =Y + if syy <0, Da is an empirical constant that is set after consideration of the material properties, sijis the average stress at the interface between
the nth ply and the n+1th ply:
1 1 1 1 n n t n ij ij n t dt h s s -+ +
=
ò
(15)The symbol ‘i’ stands for in situ, while ‘t’ and ‘c’ stand for traction and compression, respec-tively. This criterion is chosen because numerical tests in literature have shown its accuracy for laminates undergoing low velocity impact loading.
The failure of honeycomb core under compression and transverse shear is predicted using the criterion by Besant et al. (2001):
( 1) n n n yz zz xz core core
cu lu lu
e e
s
s s
s s s
æ ö æ ö÷ æ ö÷ ç ÷
ç ÷ +ç ÷ +ç ÷ = > ç ÷ ç ÷ ç ÷
ç ÷ ç ÷ ÷ ç ç çç ÷
è ø è ø è ø (16)
cu
s and tlu being the core strengths in compression and transverse shear. It is assumed n = 1.5, since numerical tests in literature have shown that results are quite accurate. However, results do not considerably vary changing the exponent from 1 to 2.
The failure of foam core is estimated according the rule suggested by Evonik for Rohacell core (see Rohacell (2011) and Li et al. (2000)), using as safety factor R11/sv:
2 2 2
2 2 2 1 2 1 1 1 1
2 1
(12 12 1 12) [4 (4 4) ]
2 2 2
v
a a I a a a a I a I
a a
s = + + + + + + +
+ + (17)
where I1 =s11+s22+s33 and
3
2 2
2 11 22 11 33 22 33
1 12,13,23
1 3
3 ii ij
i ij
I s s s s s s s s
= =
é ù
ê ú
= ê - - - + ú
ê ú
ë
å
å
ûParameters 2
1 ( 1) /
a =k d- d, d =R11- /R11+, a2 =(k2 / )d -1 and k = 3R12/R11+ are deter-mined from experiments, while R11+, R11- and R12 represent the strengths of the foam under traction compression and shear, respectively.
Core crushing failure under out-of-plane normal and shear stresses is also predicted using the criterion by Lee and Tsotsis (2000):
1 , 1 , yz 1
zz xz
c x y
Z S S
s
s s
c
Z , Sx, Sy being the compressive yield strength and the out-of-plane shear strengths, respectively. As both criteria (16) and (18) refer to honeycomb failure, the failed region is computed as the enve-lope of failures predicted by each of these two criteria. Strengths and material properties assumed in section 5 are taken from material databases and from experiments published in the literature.
3.2 Mesoscale Damage Model
In order to account for the effects of hard discontinuities in homogenized form, the mesoscale dam-age model (DML) by Ladevèze et al. (2006) is used that provides a modified strain energy expres-sion from which stresses are computed. With this model, no factors are guessed to modify the ini-tially health properties in the failed regions as the damage is simulated as it is in the reality inside energy functionals.
DML replaces the discretely damaged medium containing matrix cracks, delaminations and fi-bre failures with a continuous homogeneous medium, equivalent from an energy standpoint, whose strain energy expression incorporates damage indicators computed as the homogenized result of damage micromodels. Micro-meso relations, representing the homogenized result of micromodels, are derived from damage variables and associated forces. Displacement, strain and stress fields on the microscale are denoted as Um, εm and σm, respectively. These quantities are expressed as the
sum of the solution of a problem P in which damage is removed and the solution of a residual problem P where a residual stress is applied around the damaged area. The homogenized potential energy density of the generic ply is expressed as Ladevèze et al. (2006):
1 22 12 33 2 22 12 33
2 2
2 2
33 33
23 23 13 13
33 3 22 12
23 23 3
2
[ ] [ ( , )][ ] [ ( , )]
(1 )
(1 ) (1 )
+ [ ( , )][ ]
S
p t
E
M I I M I I
S
I
I I
M I I
G G E
pep pep s s
s
s s
s pep +
= + +
+ < >
+ +
- -
-
(19)
The meaning of symbols is as follows: I22,I12,I23,I13 and I33 are the damage indicators, each defined as the integral of the strain energy of the elementary cell for each basic residual problem under the five possible elementary loads in the directions 22, 12, 23, 13, 33; [M1], [M2], [M3]are
operators that depend on the material properties, S is the deformation, < >. +represents the positive part operator. The homogenized potential energy density of the generic interface is ex-pressed as Ladevèze et al. (2006):
1 2 3
13 23 33
1 2 3
2 pj (1 ) (1 ) (1 )
j
E I I I
k k k
s s s
g
+ + +
= - - - (20)
1
k, k2 and k3 being the elastic stiffness coefficients of the interface, I1, I2 and I3 the three damage indicators andgj the deformation. The coefficients of stresses in equations (19) and (20)
e h
t = , which are damage variables that links the damage state to the loss of stiffness of the damage mesoconstituent, L being the distance between two adjacent cracks, H being the length of
the crack across the thickness and e being the length of the microcrack. Experiments show that the
range of practical interest for r is [0; 0.7] and for t is [0; 0.4].
In this paper, the damage indicators are determined numerically through 3-D FEA VMT (PFEA-3). The elementary cell is discretized by 3-D elements once for all outside the time-loop cycle, considering discrete values of fibre failure and matrix cracking rates and delamination ratios of the elementary cell obtained at various load levels applying criteria (10) to (14).
The modified elastic properties by the mesoscale model are provided to the VK-ZZ model that is used to carry out the analysis. The progressive failure analysis is performed at each time step applying criteria (10)-(18) under the forces provided by the contact model (1)-(9) and the modified elastic coefficients of the mesoscale model (19)-(20). The damage computed at the previous step by the criteria (10)-(18) is extended at the next step to the points where the ultimate stress is reached. Instead of carrying out the analysis at an infinite number of points, a discrete representation is used that identifies small square damaged cells of the domain over which the ultimate stress is reached or just passed (up to an assumed magnitude tolerance, see Fig. 9), in a fashion similar to that of finite elements. Accordingly, the domain is subdivided into fictitious small square cells, whose damage state computed at the central point is assumed constant over the area of the cell. A layer loop com-putes the stresses across the thickness at the central point of each cell, which is used to carry out the damage analysis. Obviously, if the dimension of cell decreases, the accuracy and computational effort rise.
4 THE VK-ZZ STRUCTURAL MODEL
The VK-ZZ model, as developed by Icardi and Sola (2014b), is chosen as structural model. The displacement field is postulated to piecewise vary across the thickness as the superposition of con-tinuous functions and layerwise functions having appropriate disconcon-tinuous derivatives at the layer interfaces.
Here x, y represent the in-plane coordinates (the mid-plane is assumed as reference plane) and z the thickness coordinate (–h/2 <z< h/2), while u, v and w denote the elastic displacement compo-nents in the directions x, y and z, respectively.
The through-the-thickness variation of elastic displacements is assumed as follows:
(
)
(
)
(
)
(
)
(
)
(
)
(
)
(
)
(
)
(
)
(
)
(
)
0 _
0 _
0 _
( , , ) , , , , , , , , ( , , ) , , , , , , , ,
( , , ) , , , , , , , ,
i c c ip
i c c ip
i c c ip
u x y z U x y z U x y z U x y z U x y z
v x y z V x y z V x y z V x y z V x y z
w x y z W x y z W x y z W x y z W x y z
= + + +
= + + +
= + + +
(21)
4.1 Linear Contribution
It provides the basic linear contribution across the thickness and contains the five functional d.o.f.
0 0 0 0
,
0 0 0 0
, 0 0 ( , , ) ( , ) ( , ) ( , ) ( , , ) ( , ) ( , ) ( , ) ( , , ) ( , ) x x y y
U x y z u x y z x y w x y
V x y z v x y z x y w x y
W x y z w x y
g g
é ù
= + êë - úû
é ù
= + êë - úû =
(22)
u0 (x, y), v0 (x, y), w0 (x, y), γx0 (x, y) and γy0 (x, y) respectively represent the two in-plane
elastic displacement components of the points laying on the reference middle-plane, the transverse component and the two shear rotations at these points.
4.2 High-Order Contribution
They are aimed at refining the model across the thickness in the regions with step stress gradients, because they can vary the representation from point to point across the thickness:
2 3 4
1 2 3 4
2 3 4
1 2 3 4
2 3 4
1 2 3 4
( , , ) ...
( , , ) ...
( , , ) ...
i n
x x x x xn
i n
y y y y yn
i n
z z z z zn
U x y z A z A z A z A z A z V x y z A z A z A z A z A z W x y z A z A z A z A z A z
= + + + + +
= + + + + +
= + + + + +
(23)
The expressions of Ax1… Azn are determined by enforcing the stress-boundary conditions at the upper and lower faces of laminated and sandwich plates:
(
)
(
)
(
)
0(
)
(
)
0(
)
(
)
,
0 0
2 2
0
2 2 2 2 2
xz yz
zz zz zz z
h h
z z
h h h h h
z p z z p z z
s s
s s s
= = = =
= = = = - = = - = = (24)
and the fulfilment of local differential equilibrium equations at discrete points chosen across the thickness:
, , ,
, , ,
, , ,
xx x xy y xz z x
xy x yy y yz z y
xz x yz y zz z z
b b b
s s s
s s s
s s s
+ + =
+ + =
+ + =
(25)
So the expansion order can be increased adding more points. Please notice that the computa-tions of Ax1 … Azn don’t imply adding new d.o.f. Symbols bi represent volume loading (e.g., inertia
terms), while as customarily, a comma is used to indicate differentiation (for instance σzz,z
4.3 Piecewise Contribution
These terms are aimed at a priori fulfilling the continuity of displacements and interlaminar stresses at the material interfaces through appropriate discontinuous derivatives across the thickness:
1 1
1 1
2
1 1 1
( , ) ( , )( ) ( , )
( , ) ( , )( ) ( , )
( , ) ( , )( ) ( , )( ) ( , )
i i
i i
i i i
n n
c k k
x k k u k
k k
n n
c k k
y k k v k
k k
n n n
c k k k
k k k k w k
k k k
U x y x y z z H C x y H
V x y x y z z H C x y H
W x y x y z z H x y z z H C x y H
= =
= =
= = =
= F - +
= F - +
= Y - + W - +
å
å
å
å
å
å
å
(26)
Hk being the Heaviside unit step function (Di Sciuva (1985)) , i.e. Hk=0 for z < zk, while Hk=1 for z
≥zk. The contributions to in-plane displacements Φxk, Φyk are similar to those postulated by Di
Sciuva (1985) in order to fulfil the continuity of σxz and σyz at the interfaces between layers. The
contribution k to the transverse displacement is aimed at satisfying the continuity of σzz, while k
satisfies the continuity of the gradient σzz,z (see, Icardi and Sola (2014a)), as prescribed by the
elas-ticity theory (it directly follows from local equilibrium equations (25) and from conditions (24)). The contributions Cuk, Cvk and Cwk restore the continuity of displacements where the
representa-tion is changed across the thickness through (23). In this way, all stress and displacement continui-ty conditions are fulfilled.
Summing up, the continuity functions are computed by enforcing the following set of stress con-tinuity conditions:
( ) ( ) ( ) ( ) ( ) ( )
( ) ( ) ( ) ( ) ( ) ( ) , ( ) , ( )
|k |k |k |k |k |k |k |k
k k k k k k
xz z xz z yz z yz z z z z z z z z z z z
z z z z z z
u u v v w w
s + s - s + s - s + s - s + s
-+ - + - +
-= = = =
= = = (27)
Algebraic difficulties are overcome using symbolic calculus (MATLAB® symbolic software package). As a result, expressions for Φxk, Φyk, k, k, Cuk, Cvk and Cwk are computed once for all
for any lay-up that speeds up computations. SEUPT technique, as shown in Icardi and Sola (2014c) can be applied for obtaining a C0 formulation that overcomes the presence of unwise derivatives of the d.o.f. in the expressions of continuity functions, so to develop efficient finite elements.
4.4 Variable Piecewise In-Plane Representation
These contributions are aimed at making continuous the stresses under in-plane variation of proper-ties, namely crossing the interface between undamaged and damaged regions. They constitute the new contribution brought by the present paper.
_
1 1 1 1 1 1
_
1 1 1 1 1 1
_
1 1
( )( ) (x) ( )( )
( ) ( )( ) ( )( )
( )( )
l l l
l l l
l
n n n
s s s
c ip j k j k j k
u x k k u y k u x k k
j k j k j k
n n n
s s s
c ip j k j k j k
v x k v y k k v y k k
j k j k j k
n s
c ip j k
w x k k
j k
U y x x H H x y y H
V y H x y y H y x x H
W y x x H
q q l
q q l
h = = = = = = = = = = = = = = = - + + -= + - + -= - +
åå
åå
åå
åå
åå
åå
åå
1 1 1 1
1 1
( ) ( )
( )(y )
l l
l
n n
s s
j k j k
w y k w x k
j k j k
n s
j k
w y k k
j k
x H y H
x y H
h = = = = = = + ¡ + + ¡
-åå
åå
åå
(28)The continuity functions j k
u xq make continuous sxx in the x direction, while their counterparts j k
u yq do the same in y.
Functions j k
v yq are aimed at making continuous syyin the y direction, while j k
v xq make it
continu-ous in x. In a similar way, j k
u xl and vjlyk make continuous sxy moving in x and y; w xj kh and wjhyk
make continuous sxz, while, j k w¡x and
j k
w¡y make continuous syz. Each contribution 1 s
j=
å
makescontinuous the stresses in either x or y directions, while
1
l
n
k
å
=makes continuous the stresses across
the thickness. Whether desired, the continuity of the gradients of order n of these stresses could be enforced considering power of order (n-1). Instead the in-plane continuity of σzz and of its gradient
should not be enforced when in-plane discontinuity occurs.
A former application of the idea discussed in this section was presented in Icardi and Sola (2015) for studying bonded joints (suddenly changing lay-up). In that case, the material variation was allowed only in one direction. Therefore (28) constitute a generalization of Icardi and Sola (2015).
Also the continuity functions in (28) are computed using symbolic calculus through enforcement of the continuity of the chosen stresses. It could be noticed that just a fraction of second is required on a laptop computer, once their closed form expressions are obtained for the first time through symbolic calculus in a couple of minutes.
As previously shown by Icardi and Sola (2014a, 2014b) the apparently cumbersome and time consuming zig-zag model (21)-(28) requires an overall computational effort for the analysis that is still comparable to that of the basic model as used by Icardi and Ferrero (2009) and by Icardi and Sola (2016) with stresses computed by integrating equilibrium equations.
4.5 Core Crushing Simulation
With the VK-ZZ model, sandwiches are described in homogenized form as multilayered structures. In order to account for the core crushing mechanism, the technique developed by Icardi and Sola (2015) that accounts for the buckling of cell wall of honeycomb core is adopted.
A detailed finite element analysis (PFEA-2) is carried apart once for all in order to compute the apparent elastic moduli of the core while it collapses/buckles under transverse compressive loading. They are determined as the tangent moduli at each load level from the average ratio of stresses and strains, then they are provided to the VK-ZZ model for the analysis.
In PFEA-2, a detailed representation of the honeycomb structure as it is in the reality is em-ployed. A rather refined meshing is used to discretize the cellular structure of core, because the prediction of micro-buckling phenomena requires a dimension of shell elements comparable to the wall thickness. An elastic-plastic isotropic material and a self-contact algorithm are used to prevent from interpenetration between the folds in the cell walls. The cell walls bonded together are mod-elled using double shell elements. Criteria (16) and (18) reported previously are used to have an indication of the load range at which carrying out the analysis PFEA-2. Foam core is discretized by solid elements with nonlinear material behaviour derived from experiments and materials databases. In Icardi and Sola (2015), this technique was shown to provide accurate predictions for a varie-ty of sample cases dealing with sandwich indentation whose experimental results are published in the literature.
As PFEA-2 is carried apart once for all in order to determine the apparent elastic moduli of the core at each magnitude of transverse loading, the simulation of the core crushing mechanism while it collapses/buckles under the contact load is accounted for by the VK-ZZ model with a low compu-tational effort at each time step and quite accurately, as it will be shown by the numerical results.
4.6 Solution of the Structural Model
Solution is found in closed form at each time step within the framework of the Galerkin’s method, assuming the functional degrees of freedom u0, v0, w0, γx0 and γy0 expressed as:
0 0
1,2,3 1,,2,3 1,2,3 1,2,3
0 2
( , , ) ( ) sin sin ; ( , , ) ( ) sin sin ;
( , , ) ( ) cos ( 1)
M N M N
mn mn
m n x y m n x y
m mn
x
m n m n
u x y t A t x y v x y t B t x y
L L L L
m
w x y t C t x
L
p p p p
p
= = = =
æ ö æ ö
æ ö÷ ç ÷ æ ö÷ ç ÷
ç ÷ ç ÷ ç ÷ ç ÷
= çèçç ÷÷ø ççèç ø÷÷÷ = èççç ÷÷ø èççç ÷÷÷ø
é æç ö÷ ÷ = çççè ÷÷ø
-ë
å å
å å
2
2,4 2,4
0 0
1,2,3 1,2,3 1,2,3 1,2,3
cos ( 1) ;
( , , ) ( ) sin sin ; ( , , ) ( ) sin sin
M N n
m n y
M N M N
x mn y mn
m n x y m n x y
n y L
m n m n
x y t D t x y x y t E t x
L L L L
p
p p p p
g g
= =
= = = =
é æ ö ù ùê ç ÷ ú
÷
ê úê çç ÷÷- - ú ê úê ççè ÷ø ú
û ë û
æ ö
æ ö÷ ç ÷ æ ö÷
ç ÷ ç ÷ ç ÷
= ççèç ø÷÷ èççç ÷ø÷÷ = ççèç ÷ø÷
å å
å å
å å
y ;æ ö÷ ç ÷ ç ÷ ç ÷ ç ÷ çè ø (29)
for clamped edges, or as:
0 0
1,2,3 1,2,3 1,2,3 1,2,3
0 2
( , , ) ( ) sin cos ; ( , , ) ( ) cos sin ;
( , , ) ( ) cos ( 1)
M N M N
mn mn
m n x y m n x y
m mn
x
m n m n
u x y t A t x y v x y t B t x y
L L L L
m
w x y t C t x
L
p p p p
p
= = = =
æ ö æ ö
æ ö÷ ç ÷ æ ö÷ ç ÷
ç ÷ ç ÷ ç ÷ ç ÷
= çèçç ÷÷ø ççèç ø÷÷÷ = èççç ÷÷ø èççç ÷÷÷ø
é æç ö÷
ê ÷
= çç ÷÷ -çè ø ë
å å
å å
2
2,4 2,4
0 0
1,2,3 1,2,3 1,2,3 1,2,3
cos ( 1) ;
( , , ) ( ) sin cos ; ( , , ) ( ) cos sin
M N n
m n y
M N M N
x mn y mn
m n x y m n x y
n y L
m n m n
x y t D t x y x y t E t x y
L L L L
p
p p p p
g g
= =
= = = =
é æ ö ù ùê ç ÷ ú
÷
úê çç ÷÷- - ú ê úû ëê ççè ÷ø úû
æ ö
æ ö÷ ç ÷ æ ö÷
ç ÷ ç ÷ ç ÷
= ççèç ø÷÷ èççç ÷ø÷÷ = ççèç ÷ø÷
å å
å å
å å
æçççççè ö÷÷÷÷÷ø;for edges that are freely movable in the in-plane directions. At clamped edges, the mechanical boundary conditions
;
x xz y yz
Q s dzdy Q s dzdx
G G
=
ò
=ò
(30)are satisfied by an appropriate choice of terms (23), being the contour of the plate. Qx, Qy are
assumed to be uniformly distributed over when the edges are sufficiently far from the impact point located at the centre of the plate. This assumption is valid for large length side-to-thickness ratios.
The dynamic governing equations in matrix form are obtained from (29) or (29’), then they are solved using Newmark’s time integration scheme. Once unknown amplitudes Amn, …, Emn are
com-puted at each time step, stresses are calculated and the damage analysis is carried out.
The expressions of linear, secant and tangent stiffness matrices of the VK-ZZ model are deduced from (29) or (29’), once they are substituted in (22) to (28) according to Zienkiewicz and Taylor (2000). The consistent mass matrix of the VK-ZZ is computed considering the inertia contributions within governing functionals, like the dynamic version of the principle of virtual work. The con-sistent mass matrix is used in the computations, because numerical tests using the mass matrix derived just considering displacements (22) have shown errors up to 10% in the first five eigen-frequencies, with just a reduction of the processing time less than 15%. Hence, the use of a simpli-fied matrix is left to a future study
5 NUMERICAL RESULTS AND DISCUSSION
The contact force time history for laminates and sandwiches and the damage predicted by simula-tions are compared to experiments and to the results of previously developed zig-zag models and finite elements. The results of simulations are presented for different impact energies in order to assess: (i) which advantages are brought by the refined VK-ZZ model by the viewpoint of progres-sive damage analysis; (ii) whether consideration of the effects of hard discontinuities (matrix crack-ing, broken fibres and delamination) in homogenized form improves accuracy; (iii) whether consid-eration of in-plane stress continuity has a significant bearing for the quality of results and, finally; (iv) whether the impact damage simulation can be successfully carried out in closed form.
As no damage detections are available for sandwiches with laminated faces, except for a stitched one (see Potluri et al. (2003)), the comparison with experiments is limited to the contact force time history. Modelling of stitching (Icardi and Sola (2013)) could be applied, but as it repre-sents an uncertainty source that could prevent from the assessments of (i)-(iv), it is left to a future study.
5.1 In-Plane Stress Continuity
In order to assess the capability of the VK-ZZ structural model to predict continuous stresses under sudden in-plane variation of properties (Figure 2), first the sample case of a two-material wedge is considered (Figure 3).
The goal is to compare the in-plane variation of the shear stress σxy across the material
In this sample case, the variation of solutions in the transverse direction with respect to the plane x, y of Figure 3 has no relevance. Here just the in-plane shear stress is considered, being the one with the highest singularity strength at the corner interface. A Young’s modulus of 7.3 GPa and a Poisson’s ratio of 0.3 are assumed for the deformable sector, while a modulus larger by a fac-tor 100 is assumed for simulating the rigid secfac-tor.
Figure 2: Illustration of the interface where in-plane continuity is imposed.
Figure 3: In-plane variation of the normalized in-plane shear stress for the two material wedge by the present model (inset: exact solution by Hein and Erdogan (1971)).
to-of materials with dissimilar properties. Figure 3 reports the in-plane variation to-of the shear stress σxy
across the material interface normalized as follows:
xy xy
xy MAX
s s
s
= (31)
The present solution is obtained assuming a subdivision of the domain of the two half plates in-to 16x16 subdomains whose side length is progressively reduced close in-to the corner interface. Within each subdomain, the variation of the functional d.o.f. of the VK-ZZ model u0, v0, w0, γx0 and γy0 is
assumed to be linear (product of Lagrange’s polynomials in x and y). Hence, the continuity of the in-plane shear stress is enforced at the sides of subdomains by computing the appropriate expres-sions of the continuity functions j k
u xl and vjlyk appearing in Eq. (28).
In this sample case, it is sufficient to enforce the continuity of σxy across the material
disconti-nuity line. For multi-layered materials, i.e. with different properties across the thickness direction z, the stress continuity should be simultaneously enforced at each interface through Eqs. (27) and (28) and at each point in x, y. Thus, this continuity should be enforced at the interfaces of undamaged and damaged regions and for all stress components excepted σzz.
The results of Figure 3 show the capability of the VK-ZZ model to accurately reproduce the variation of the shear stress σxy across the interface even in this case. The present structural model
is shown able to capture a continuous stress with a discontinuous gradient like in the exact solution. The strong stress concentration occurring at the interface of material with dissimilar properties shows the importance of enforcing the stress continuity under in-plane material discontinuity, as in impact damaged structures, to accurately evaluate stresses. The effective importance of in-plane stress continuity is further assessed in section 5.4 in a specific case for which the impact-induced damage is detected by ultrasonic cartography.
In the next sections 5.2 and 5.3 the contact forces for laminates and sandwiches predicted at different levels of energy are compared to experiments.
5.2 Contact Force of Laminates
First, the sample case of a 230x127 laminated plate with a [45°/0°/-45°/90°]2s lamination scheme
and with all the edges clamped is presented. The plate is subjected to the impact of a steel hemi-spherical nose of 1.15 kg at different levels of energy (1.5 J and 2.5 J). Each of its 16 layers is made of AS4/3502 Graphite-Epoxy and its total thickness is 2.48 ± 0.0254 mm.
The acceleration time-history is detected through an accelerometer mounted on the impactor nose and connected to a data acquisition system. The contact force time-history is obtained multi-plying the impactor mass by the measured acceleration. Since the arm carrying the impactor nose follows a circular trajectory, attention has been paid to assure that the impact force is perpendicular to the impacted panel, as assumed in numerical simulations. A sampling frequency of 105 Hz is used.
the structural response and of the damage model, as they are simultaneously employed. So there is no possibility to separately ascertain these three contributions by the comparison to experiments.
Figure 4: Comparison between simulated and experimental contact force (Sola (2016)) for a laminated [45/0/-45/90]2s plate impacted at 1.5 J.
The results of Figures 4 and 5 show the numerical simulation to be appropriate for this sample case, its results being in good agreement with experiments. Note that just 350 s are required to carry out the analysis on a laptop computer, thus the efficiency of the present simulation is proven. The results with and without enforcement of the target to conform the shape of the impactor are shown to be equivalent for this case, as the iterative algorithm of section 2.2 is unnecessary when laminates are analysed.
In the subsequent sections, further tests are made considering other samples, with the aim of showing if accurate predictions can be always obtained by the present simulation technique.
5.3 Contact Force of Sandwiches
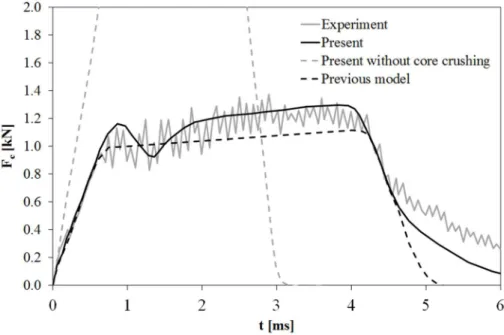
The experimental contact force time history detected by Kärger et al. (2007) is compared to that predicted by the present simulation, with and without enforcing the panel to conform to the shape of the impactor and by the previous model by Icardi and Ferrero (2009). The aim is to show that soft media requires the application of algorithm of section 2.2, as well as to show that accuracy is improved with respect to the previous structural model by Icardi and Ferrero (2009).
The thin top face sheet (0.633 mm) is made of Cytec 977-2/ HTA. The thick bottom face sheet (2.7 mm) is made of CFRP fabric plies and UD tapes, with a [(0°2/45°/90°/-45°)s]s lay-up. The core,
which is 28 mm thick, is made of NOMEX 4.8-48 honeycomb. This sandwich panel is completely supported at the edges and it is impacted by a steel sphere with energy of 8 J, having a diameter of 25.4 mm carried by an impactor with a mass of 1.10 kg.
The results of simulations reported in Figure 6 show that a quite accurate prediction of the con-tact force is obtained at each instant of time only if: (i) the iterative algorithm of Section 2.2 that computes the contact radius at each step is considered; (ii) the detailed FEA representation of the core behaviour is carried out through PFEA-2, in order to account for the buckling of cell walls under transverse compressive loading, otherwise totally wrong results are obtained.
The results also show the superior predictive capability of the present model with respect to the former model by Icardi and Ferrero (2009), which already considered the core crushing mechanism. Hence the present VK-ZZ model has a significant bearing on accuracy of results.
As in this case the algorithm that accounts for the core crushing behaviour is activated, the computations at each time step are a little bit slower than for the laminates previously considered. However, just 550 s are required to compute the contact force time history, hence the simulation procedure is still proven to be accurate and cost-effective.
Whether accurate predictions of the contact force of sandwiches can be obtained at different levels of energy is discussed next.
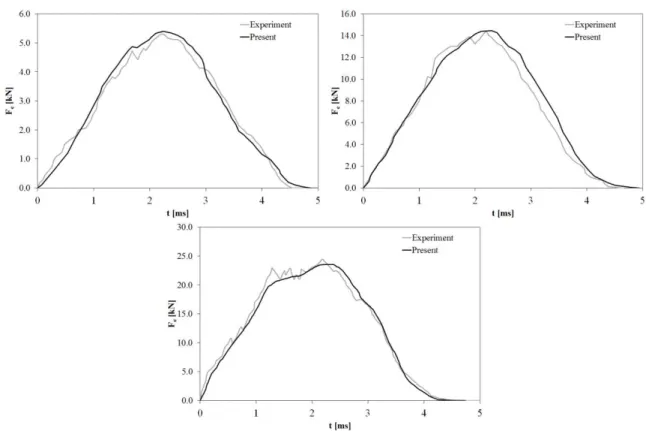
Attention is now focused on the sandwich panel with PVC foam core (Divinycell H250) and laminated carbon fabric/epoxy faces (AGP370-5H/ 3501-6S) studied by Schubel et al. (2005), for impact energies ranging from 7.75 to 108 J. A sphere with a radius of 12.7 cm mounted on an im-pactor with a mass of 6.22 kg is left to fall onto the panel. Increasing the heights of the mass drop, the above mentioned impact energies are obtained, with velocities ranging from 1.6 to 5 m/s. The sandwich plate has sides of 27.9 cm, thickness of 2.82 cm and it is simply supported. The core is 25.4 mm thick, while the laminated face sheets are obtained stacking four plies of prepreg for a total thickness of 1.37 mm. According to Schubel et al. (2005), the mechanical properties of the faces are:
ρ= 1600 kg/m3, E1= 77 GPa, E2= 75 GPa, G12= 6.5 GPa, G13= 5.1 GPa, G23= 4.1 GPa, υ12 =
0.07.
Since at low energies the damage may occur with a different mechanism than at high energies, consideration of different impact energies is required to assess whether the range of applicability of the present model is quite large to cover practical applications. However, only cases for which strain-rates effects are unimportant will be considered
Figure 7 shows the comparison between the experiments of Schubel et al. (2005) and the con-tact force time histories predicted by the present simulations at the three energy levels of 7.75, 41.1 and 108 J. The results show that the present simulation obtains accurate contact force time histo-ries in all three cases. No increasing errors are seen increasing the impact energy. Thus, it is reputed that the present modelling approach can be successfully used at least for energies up to a hundred of J. A further refinement is required in order to more closely represent the jumps in the force and the oscillating behaviour detected during experiments.
Figure 7: Comparisons between experimental results by Schubel et al. (2005) and numerical contact forces for a sandwich plate with foam core considering an impact energy of a) 7,75 J, b) 41,1 J and c) 108 J.
5.4 Importance of In-Plane Continuity
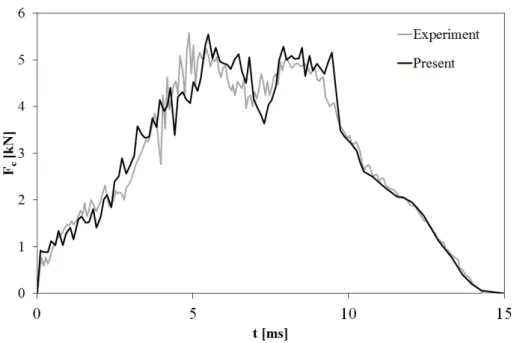
A composite panel with I stiffeners having a length of 800 mm (Lx), a width of 330 mm (Ly) and a
skin thickness (t) of 3 mm formerly tested by Icardi and Zardo (2005) is now considered. The panel is clamped at the short sides and is kept free at the long sides. It is impacted at the centre with impact energy of 40 J (mass of the impactor 5.45 kg, velocity 3.83 m/s). The skin layers are 0.25 mm thick, they are stacked with a [45°/-45°/0°/0°/45°/-45°/-45°/45°/0°/0°/-45°/45] sequence and have the following mechanical properties: E1= 130 GPa, E2= 8 GPa, G12= 5 GPa, G13= 5 GPa,
G23= 2.5 GPa, ν12= 0.3, ρ= 1557 kg/m3. The strengths are: St11= 1.67 GPa, St22= 0.06 GPa, Sc11=
1.08 GPa, Sc22= 0.17 GPa, S12= S13= S23= 0.07 GPa, where Stii represents the strength to traction
in directions i, Scii represents the strength to compression in directions i while Sij represents the
shear strength. The impactor is made of steel (E= 210 GPa, ν= 0.3) and has a nose sphere with a diameter of 25.4 mm.
Figure 8: Comparison between the experimental contact force in Icardi and Zardo (2005) and that computed with the present procedure for a laminate with I stiffeners.
The comparison between the contact force predicted by the present simulations to that experi-mentally detected of Figure 8 shows that a better predictive capability is achieved with respect to previous simulations by Icardi and Zardo (2005), thanks to the improved structural and damage models here used. Note that while in Icardi and Zardo (2005) the residual properties of the failed regions are guessed within the framework of the ply-discount theory, here they are computed as outlined in Section 3.2.
The centre of each arbitrarily chosen sub-region for damage analysis corresponds to a point pi
where the damage criteria of Section 3 are applied in order to determine whether or not materials are failed. If in pi one of the damage criteria predicts failure, the corresponding sub-region is
consid-ered damaged and therefore it is coloured in grey in Figure 9. Stresses in pi are determined
assum-ing the modified expression of the strain energy resultassum-ing by the damage mesoscale model (3.2) with the damage indicators computed by PFEA-3.
The damage predicted with and without enforcement of the in-plane stress continuity is com-pared to that detected via ultrasonic cartography in Figure 9. This figure shows the considerable practical importance of contributions (28) in the VK-ZZ model, which thus don’t merely represent a theoretical achievement. An elapsed time of 490 s being required to complete the analysis, consider-ation of in-plane continuity does not adversely affect computconsider-ational costs.
Figure 9: Overlap induced damage for a laminate with I stiffeners by: C-SCAN in Icardi and Zardo (2005) (dashed line), present procedure without considering in-plane continuity (dark-grey square sub-regions)
or considering it (light-grey square sub-regions).
Table 1 shows the extension of the delaminated area at each interface, as measured in Icardi and Zardo (2005) and as computed by the present simulation procedure and by previous ones. The results show that the present refined structural model achieves at each interface a better accuracy. It is reminded that an analytical model is used in this paper, instead of the finite element of Icardi and Zardo (2005). However, square sub-regions similar to finite elements are considered for the damage analysis. The results of Figures 8 and 9 show that the present closed-form approach does not result in an accuracy loss with respect to finite element modelling, though its computational cost is much lower. So use of finite elements can be limited to cases with a complex shape.
Physical interface Experimental by Icardi
and Zardo (2005) Present
Present without continuity
Basic Model
Model by Icardi and Zardo (2005)
1st 960 950 930 1423 950
2nd 790 758 740 1096 258
3rd 430 400 380 590 376
4th 310 250 210 490 143
5th 160 115 107 289 114
6th 135 102 98 190 108
7th 95 75 62 125 75
8th 50 44 38 100 43
Table 1: Delaminated area [mm2] at the interfaces for a laminate with I stiffeners by the present procedure and by results of experiment in Icardi and Zardo (2005) and by simpler models (FSDPT and Icardi and Zardo (2005)).
6 CONCLUDING REMARKS
interfaces and at the interfaces of undamaged and damaged regions (where material properties sud-denly vary), as prescribed by the elasticity theory for keeping equilibrium.
It gives an accurate representations of strain energy density, displacement, and strain and stress fields at each time step with a low computational effort from constitutive equations.
Five unknown variables describe the displacement fields, nevertheless the representation can be refined across the thickness as desired. The continuity of out-of-plane stresses at the layer interfaces and across damaged/undamaged interfaces is a priori fulfilled with an appropriate choice of zig-zag amplitudes. A modified version of the Hertzian contact law is used for solving the contact problem. It forces the target to conform to shape of the impactor when soft core sandwiches are analysed. The Newmark’s implicit time integration scheme is used for solving transient dynamic equations.
Stress-based criteria with a separate representation of failure modes are employed to identify the damaged regions at each time step under the contact force. The Hashin and Rotem’s criterion with in-situ strengths predicts fibre and matrix’s failures. Delaminated regions at the interfaces are predicted by the Choi-Chang’s criterion. The failure of honeycomb is predicted separately by the criteria by Besant et al. and Lee and Tsotsis, computing the failed region as the envelope of failures predicted by these two criteria. The failure of foam core is estimated according to the rule suggested by Evonik for Rohacell core.
The progressive damage analysis is carried out accounting for the effects of hard discontinuities (i.e. matrix cracks, fibre failures and delaminations) in homogenized form by a continuum damage mesomechanic model. A modified version of the strain energy is obtained, from which stresses are computed. The damage computed at the previous step is extended at the next step to the points where the ultimate stress is reached. Instead of guessing the residual properties, they are computed in a physically consistent way.
Small square cells of the domain are identified, where the damage of layers is assumed uniform and equal to that computed at the central point. The damage indicators of the mesoscale model are determined via 3-D FEA at various load levels (computations carried apart once for all). 3-D FEA is also used to predict the variable apparent elastic moduli of the core while it collapses/buckles under transverse compressive loading. In this way, stresses are accurately computed across the core, even if a homogenized structural model is used.
The impact problem is solved in analytic form within the framework of the Galerkin’s method assuming appropriate displacement trial functions for representing the in-plane variation of the functional d.o.f.
The application to a two-material wedge problem shows the present structural model able of capturing continuous stresses even under a sudden variation of properties like across undamaged and damaged regions, with a discontinuous gradient, as in the exact elasticity solution.
The comparison of simulations with and without enforcement of in-plane stress continuity shows the non-negligible effects of such continuity on accuracy of results.
The capability of the present impact simulation is corroborated by the comparison with the damage detected through ultrasonic cartography.
References
Abrate S. (2001). Modeling of impacts on composite structures. Composite Structures; 51:129–38. Abrate S. (2014). Impact on composite plates in contact with water. Procedia Engineering; 88: 2 – 9.
Aktas A, Aktas M, Turan F. (2013). The effect of stacking sequence on the impact and post-impact behaviour of woven/knit glass/epoxy hybrid composites. Composite Structures; 103: 119-135
Berthelot JM. (2003). Transverse Cracking and Delamination in Cross-Ply Glass-Fiber and Carbon-Fiber Reinforced Plastic Laminates: Static and Fatigue Loading. Appl. Mech. Reviews; 56: 111–147.
Besant T, Davies GAO, Hitchings D. (2001). Finite element modelling of low velocity impact of composite sandwich panels, Composites Part A; 32: 1189-1196.
Chai GB, Zhu S. (2011). A review of low-velocity impact on sandwich structures. Journal of Materials: Design & Applications;225(4):207–30.
Chakrabarti A, Chalak HD, Iqbal MA, Sheikh AH. (2011). A new FE model based on higher order zig-zag theory for the analysis of laminated sandwich beam soft core. Composite Structures; 93 : 271-279.
Chakraborty D. (2007). Delamination of Laminated Fiber Reinforced Plastic Composites Under Multiple Cylindrical Impact. Materials & Design; 28: 1142-1153.
Chao CC, Tu CY. (1999). Three-dimensional contact dynamics of laminated plates: Part 1. Normal impact. Compo-sites Part B; 30: 9-22.
Chen WJ, Wu Z. (2008). A selective review on recent development of displacement-based laminated plate theories. Recent Pat. Mech. Eng.; 1: 29–44.
Choi HY, Chang FK. (1992). A model for predicting damage in graphite/epoxy laminated composites resulting from low velocity point impact. J. Comput. Math.; 26: 2134–69.
Damanpack AR, Shakeri M, Aghdam MM. (2013). A new finite element model for low-velocity impact analysis of sandwich beams subjected to multiple projectiles. Composite Structures; 104 : 21–33
Di Sciuva M. (1985). Development of an Anisotropic, Multilayered, Shear-Deformable Rectangular Plate Element.” Composite Structures; 21: 789–796.
Diaz Diaz A, Caron JJ, Ehrlacher A. (2007). Analytical Determination of the Modes I, II and III Energy Release Rates in a Delaminated Laminate and Validation of a Delamination Criterion. Composite Structures; 78: 424–432. Elder DJ, Thomson RS, Nguyen MQ, Scott L. (2004). Review of delamination predictive methods for low speed impact of composite laminates. Composite Structures; 66: 677–683.
Garnich MR, Akula Venkata MK. (2009). Review of degradation models for progressive failure analysis of fiber rein-forced polymer composites. Appl. Mech. Reviews; 62: 1-35.
Hashin Z, Rotem A. (1973). A Fatigue Criterion for Fiber-reinforced Materials. J. of Compos. Mater.; 7: 448–464. Hein VL, Erdogan F. (1971). Stress singularities in a two-material wedge. Int J of Fract Mech; 7: 317-330.
Hongkarnjanakul N, Bouvet C, Rivallant S. (2013). Validation of low velocity impact modelling on different stacking sequences of CFRP laminates and influence of fibre failure. Composite Structures; 106: 549–559.


![Figure 5: Comparison between simulated and experimental contact force (Sola (2016)) for a laminated [45/0/-45/90]2s plate impacted at 2.5 J](https://thumb-eu.123doks.com/thumbv2/123dok_br/18887054.424073/18.808.129.635.576.908/figure-comparison-between-simulated-experimental-contact-laminated-impacted.webp)