ISSN 0104-6632 Printed in Brazil
www.abeq.org.br/bjche
Vol. 30, No. 02, pp. 267 - 276, April - June, 2013
*To whom correspondence should be addressed
Brazilian Journal
of Chemical
Engineering
IMMOBILIZED Lactobacillus acidophilus
PRODUCED FROM WHEY
AND ALGINATE
P. R. Rosa, E. M. Sá, U. Coutinho Filho and V. L. Cardoso
*School of Chemical Engineering, Federal University of Uberlandia, Uberlandia - MG, Brazil. Phone: + (55) (34) 32394189, Fax: + (55) (34) 32394188,
E-mail: [email protected]
(Submitted: May 16. 2011 ; Revised: April 23, 2012 ; Accepted: July 23, 2012)
Abstract - An analysis was made of the use of whey fermentation by Lactobacillus acidophilus LA-5 for encapsulatedprobiotic bacteria cell production. Fermentation was done in a 2-liter Biostat BFermentorat 28±1 ºC without air supply and agitation maintained at 200 rpm. Different processing conditions were studied using Center Composite Design applied to Surface Response Methodology. Maximum cell yield (2.7 x10¹⁰ NMP/mL for 36 hours) was achieved with 30.85 g/L of lactose, a pH value of 6.45 and 1.04 g/L of inoculum. Cell growth was evaluated using reconstituted and fresh whey after 144 hours of fermentation in pre-optimized conditions. Cell concentration after fermentation was 1010 MPN/mL in all the assays. The Verhulst model proved to be satisfactory to fit the experimental results, providing a stationary cell concentration of 6.0 g/L and a specific growth rate of 0.09 h-1. Cells were collected by centrifugation at 15000g for 5 minutes at 4 °C, immobilized in 2% alginate, and dried to a constant weight at 50 °C. Immobilized probiotic cells presented 1011 MPN/g, a time required to kill 90% of the organisms (D value) of 18 h (70 ºC), an activation energy of 76.04 kJ/mol for thermal inactivation, and an in vitro resistance to low pH (D value of 62.5 min at 37 ºC, pH 2.5).
Keywords: Lactobacillus acidophilus; Immobilized cells; Probiotics; Whey.
INTRODUCTION
Probiotics are live microorganisms that are beneficial to the host’s health when administered in adequate amounts. In animal feed, probiotics reduce the need for therapeutic chemicals and antibiotics and increase overall health as well as food safety. In humans, probiotics are involved in defense against infection, prevention of cancer and in stabilizing or reconstituting the physiological balance of the intestinal microbiota (Wohlgemuth et al., 2010; Oelschlaeger 2010; Aragon-Alegro et al., 2007; Balcázar et al., 2006; Fuller 1989). According to reports in the literature (Chávarri et al., 2010; Cruz
et al., 2007; Talwalkar and Kailasapathy 2004), the minimum level of microbial cells to claim probiotic status in humans is 106 to 107 cells/g of probiotic product. Similar values of probiotics are suggested for cats, dogs and ruminants (Marshall-Jones et al., 2006; Baillon et al., 2004; Chaucheyras-Durand et al., 2010).
et al., 2008; Apás et al., 2008). Cruz et al. (2007) and Talwalkar and Kailasapathy (2004) highlight the fact that Lactobacillus acidophilus requires an environment of low oxygen tension for optimal growth and has complex nutritional needs related to the assimilation of free amino acids, peptides, vitamins, nucleotides and certain minerals.
One of the critical factors in the maintenance of probiotic cell viability is the choice of fermentation medium. Whey is an important fermentation medium constituent because of its nutritional value and year-round availability. The processing of milk to produce cheese generates cheese whey, which represents a source of water pollution if discarded. The world-wide production of this byproduct is estimated to be over 176 million tons per year and its pollutant load corresponds to a polluting power ten-fold greater than domestic sewage, with a Chemical Oxygen Demand (COD) between 40000 and 60000 mg.L-1 (Ozmihci and Kargi, 2008; Tamime, 2006; Prazeres et al., 2012; Rech and Ayub, 2006).
Another critical factor is the maintenance of cell viability during probiotic production, storage and digestion by enteric or pancreatic enzymes. This factor can be regarded as a major limiting factor in commercial probiotic production. Drying and immobilization are both effective methods used to preserve probiotic activity during the storage period, and cell immobilization has also been shown to improve resistance to digestion by enteric or pancreatic enzymes. Other advantages related to the use of immobilized cells include increased cell density and a physical barrier against the high temperatures, high osmotic pressure and high levels of oxygen of the external environment generated during the production of probiotic formulations (Pan et al., 2009; Rayment et al., 2009; Meng et al., 2008; Cruz et al., 2007; Capela et al., 2007; Kailasapathy, 2006; Selmer-Olsen et al., 1996).
Immobilization using alginate has the advantage of being economical because of its low cost and simplicity: adding an alginate solution to a solution containing a mixture of calcium chloride can result in the formation of alginate beads with pore sizes of less than 17 nm. Alginates, which are natural anionic polysaccharides composed of D-mannuronic and L-guluronic acid residues joined linearly by (1–4)-glycosidic linkages, are also an accepted food additive and can be used safely in foods (Chávarri et al., 2010; Annan et al., 2008; Chan and Zhang 2005; Krasaekoopt et al., 2004).
The primary objective of this study was to analyze the use of whey fermentation to produce
probiotic formulations containing Lactobacillus acidophilus cells. The secondary objective was to evaluate the stability of solid formulations containing these cells immobilized in dried alginate-calcium beads.
MATERIALS AND METHODS
Microorganisms
A lactic culture of Lactobacillus acidophilus La-5 was maintained at 5 ºC and replicated every 15 days (30 ºC, 24 h) in a selective MRS (Man, Rogosa and Sharpe) medium composed of 10 g/L peptone casein, 10 g/L meat extract, 5 g/L yeast extract, 20 g/L glucose, 1 g/L Tween 80, 2 g/L K2HPO4, 5 g/L CH3COONa, 2 g/L ammonium citrate, 0.2 g/L MgSO4.7H2O and 0.05 g/L MnSO4.H2O.
The cell concentration was measured in assays to determine dry cell concentrations and viable cell numbers. The dry cell concentration was measured as follows: the cells were harvested by centrifugation of 25 mL of cultivated medium (15,000g for 15 min) and dried at 90 ± 1 ºC until no change in weight was detectable. The viable cells were obtained by the Most Probable Number (MPN) methodology using MRS medium, as described by Man (1960). This methodology (MPN) was chosen because the quantification of cells in isothermal conditions at 35, 40, 60 and 70 ºC, described below, produces a large reduction in cell number and MPN has higher sensitivity for the extremely low level microbial counting (Sun et al., 2006; DiGeronimo et al., 1978).
Lactose and Protein Concentration
Lactose concentration was determined by a spectrophotometric assay with glucose oxidase (Leary et al., 1992) and the mass balance described by L=1.9(G2-G1), where L represents the lactose concentration (g/L) and G1 and G2 are the glucose concentrations (g/L) before and after acid hydrolysis (20 µL 11.5 N HCl, 90 ºC for 5 min). Reducing sugar was also measured by the 3,5-dinitrosalicylic acid (DNS) method (Miller, 1959). The protein concentration was determined by the Lowry protein assay (Lowry, 1951).
Experimental Design
Brazilian Journal of Chemical Engineering Vol. 30, No. 02, pp. 267 - 276, April - June, 2013 Design (FFD) with three replications at the central
point and six axial points in a 1.8 liter BioStat B Fermentor at 28 ± 1 ºC without air supply and with agitation maintained at 200 rpm. Three factors were selected for use in designing the experiment: lactose concentration (X1), pH (X2) and inoculum size (X3). The ranges of the variables investigated in this study were: 20 – 40 g/L for lactose, 5 – 8 for pH and 0.5 – 1.5 g/L for inoculum size. To create a response surface, the experimental data obtained from the above design were fitted to the following second order polynomial equation:
2 2
0 1 1 2 2 3 3 4 1 5 2
2
6 3 7 1 2 8 1 3 9 2 3
Y A A X A X A X A X A X
A X A X X A X X A X X
= + + + + +
+ + + +
(1)
where Y represents the expected Lactobacillus acidophilus cell concentration (MPN/mL), X1 the lactose concentration, X2 the pH and X3 the inoculum size, and Ai with i=1,2,...,9 the adjustable parameters for fitting the data.
Characterization of Lactobacillus acidophilus
Kinetics
Growth curves were determined for both reconstituted whey and fresh whey using the same reactor employed for the optimization studies with the same conditions of optimization for 144 hours of fermentation. Sampling was done at regular intervals to determine the viable cell counts and the dry cell, protein, and lactose concentrations.
To quantify the growth of microorganisms and to compare fermentation characteristics, the growth curves were adjusted to kinetic models (see Table 1) using two program codes implemented in Scilab 5.0.1 software and the statistical differences between the parameters of reconstituted whey and fresh whey were found by Student’s t-test with a 95% confidence interval (p=0.05). One of the programs used to determine the parameters was the generic optimization function that evaluates gradients by finite differences (NDcost, scilab-5.2.2, Copyright © 1989-2010. INRIA ENPC); the other program used the Monte Carlo method (Taha, 2006).
Immobilization and Characterization of Immobilized Cells
Cell immobilization was performed in calcium alginate gel in the form of beads. The beads were
prepared by placing a blend of sodium alginate (1%) and 108 cell/mL of harvested cells (15,000 g for 15 min) in a calcium chloride solution (0.2 mol/L). The beads were then dried at 50◦C and evaluated by image processing using Image Pro Plus 7.0 software (Media Cybernetics).
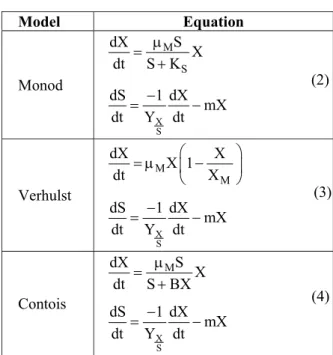
Table 1: Growth Models
Model Equation Monod X S M S dX S X
dt S K
dS 1 dX
mX
dt Y dt
μ = + − = − (2) Verhulst X S M M dX X X 1 dt X
dS 1 dX
mX
dt Y dt
⎛ ⎞
= μ ⎜ − ⎟
⎝ ⎠ − = − (3) Contois X S M dX S X
dt S BX
dS 1 dX
mX
dt Y dt
μ = + − = − (4)
Note: X indicates the cell concentration (g/L), S is the lactose concentration (g/L), YX/S is the stoichiometric coefficient (g cell/g
lactose), μM is the optimum specific growth rate (h-1), t is time (h), B is
the Contois saturation constant (g lactose/g cell), and m is the specific maintenance rate (h-1).
Cell viability and stability were also evaluated. The stability of probiotic cells in gastric conditions was simulated to determine the number of surviving cells in acid conditions (37 ± 1 ºC, pH 2.5 ± 0.1) after 30, 60 and 90 min of incubation, using the model described by Equation (5),
( )
10
log S t = −t / D (5)
where t is time, S(t) is the survival rate, which is defined as the ratio between the number of survivors after exposure time t, N(t), and the initial number, No, and D is the time required for one log reduction in the number of cells (D value).
Table 2: Survival Models (Bailey, Ollis, 1986)
Model Differential form Integrated form
First order −dN / dt=kN (6) N t
( )
=N exp0( )
−kt (7)Logistic −dN / dt=k tN1 +k N N2
(
0−N)
(8)1 2
2
0 0
0 1 1 0 2
N N
N (k k )
k k exp ((k k )t
)
) (t
N N
+
+ +
= (9)
Weibull −dN / dt=knNtn 1− (10) N=N exp0
( )
−ktn (11)t2 −dN / dt=ktN (12)
2 0
N exp( kt ) N
2 −
= (13)
Note: N is the cell concentration (MPN/mL), t is time, kisthereactionrateconstant in the Arrhenius equation k=ko.exp(-Ea/R.T), T is temperature, and Ea is the activation energy, R=8.314 J/(mol.K)
RESULTS AND DISCUSSION
Experimental Design
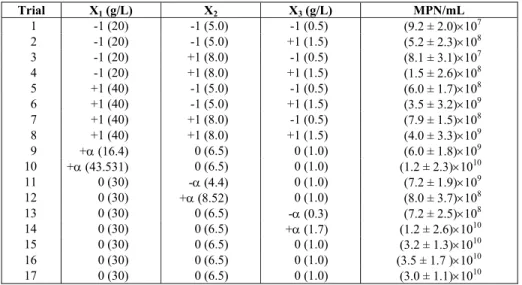
Table 3 shows the trials and results of the factorial design at 36 hours of fermentation. Cell concentrations ranged from 8.1 ×10⁷ MPN/mL (trial 3) to 3.5 × 10¹⁰ NMP/mL (trial 16). As can be seen, the best results were found at the central point (Trials 15, 16 and 17): (3.2 ± 1.3) × 1010, (3.5 ± 1.7) ×1010 and (3.0 ± 1.1) ×1010 NMP/mL.
The mathematical model established by Equation (1) with statistically significant parameters at the 90% confidence level (Student’s t test) are presented in Equation (14). The coefficient of determination (R2) was 87% meaning the model explained 87% of the variation in the response variable. The optimum cell concentration was found at a pH of 6.45 and concentrations of 30.85 g/L (lactose) and 1.04 g/L (inoculum size). These results show qualitative agreement between the theoretical and experimental
cell concentration.
10 9 2
1
10 2 9 2
2 3
Y 2.894 10 – 8.514 10 X
– 1.124 10 X – 9.956 10 X
= × ×
× × (14)
Figure 1 presents the effect of lactose concentration and inoculum size on the viable cell concentration with the pH kept at the central point (pH 6.5), while Figure 2 illustrates the effect of inoculum size and pH on the viable cell concentra-tion with the lactose concentraconcentra-tion held at the central point (30 g/L). Note that the viable cell concentra-tions are optimized for a lactose concentration of 27 to 35 g/L, inoculum size of 0.8 to 1.2 g/L, and pH of 6.0 to 7.0.
The experimental results revealed an optimized viable cell concentration of about 1010 MPN/mL and cell concentrations of 6.0 ± 0.7 g/L. The cell concentration was about 1.38-fold higher than that reported in the literature (Tari et al., 2009).
Table 3: Study of lactose concentration, pH and inoculum size (factorial design)
Trial X1 (g/L) X2 X3 (g/L) MPN/mL
1 -1 (20) -1 (5.0) -1 (0.5) (9.2 ± 2.0)×107
2 -1 (20) -1 (5.0) +1 (1.5) (5.2 ± 2.3)×108
3 -1 (20) +1 (8.0) -1 (0.5) (8.1 ± 3.1)×107
4 -1 (20) +1 (8.0) +1 (1.5) (1.5 ± 2.6)×108
5 +1 (40) -1 (5.0) -1 (0.5) (6.0 ± 1.7)×108
6 +1 (40) -1 (5.0) +1 (1.5) (3.5 ± 3.2)×109
7 +1 (40) +1 (8.0) -1 (0.5) (7.9 ± 1.5)×108
8 +1 (40) +1 (8.0) +1 (1.5) (4.0 ± 3.3)×109
9 +α (16.4) 0 (6.5) 0 (1.0) (6.0 ± 1.8)×109
10 +α (43.531) 0 (6.5) 0 (1.0) (1.2 ± 2.3)×1010
11 0 (30) -α (4.4) 0 (1.0) (7.2 ± 1.9)×109
12 0 (30) +α (8.52) 0 (1.0) (8.0 ± 3.7)×108
13 0 (30) 0 (6.5) -α (0.3) (7.2 ± 2.5)×108
14 0 (30) 0 (6.5) +α (1.7) (1.2 ± 2.6)×1010
15 0 (30) 0 (6.5) 0 (1.0) (3.2 ± 1.3)×1010
16 0 (30) 0 (6.5) 0 (1.0) (3.5 ± 1.7 )×1010
17 0 (30) 0 (6.5) 0 (1.0) (3.0 ± 1.1)×1010
Brazilian Journal of Chemical Engineering Vol. 30, No. 02, pp. 267 - 276, April - June, 2013
Figure 1: Effect of lactose concentration and inoculum size on the viable cell concentration
Figure 2: Effect of inoculum size and pH on the viable cell concentration
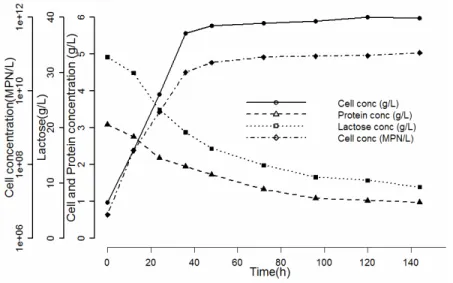
Growth Pattern in Optimized Conditions
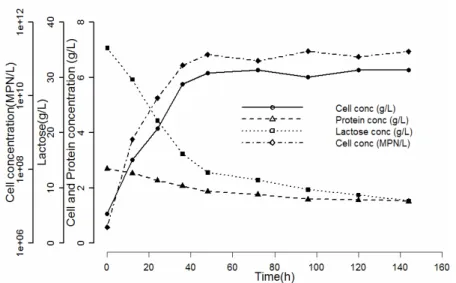
According to the results, diauxic growth patterns were not observed, lactose was hydrolyzed into glucose and galactose and both sugars were utilized simultaneously. Figures 3 and 4 illustrate the de-pendence of cell, lactose and protein concentrations on the optimized growth conditions. Figure 3 represents the reconstituted whey and Figure 4 the fresh whey, both containing 33 ± 0.5 g/L of lactose. A comparison of the two figures indicates that lactose consumption rates are very similar. According to these figures, the maximum viable cell concentration reached after
about 36 h was 1010MNP/mL.
Table 4 list the parameters estimated for the reconstituted and fresh whey fermentation systems. The predictions of the Verhulst model showed good agreement with the experimental results, with a high correlation (R2>0.99) between the measurements and model predictions. Although the maximum sustainable population in the Verhulst model, XM, was found to be higher for fresh whey fermentation than for reconstituted whey, the t statistic associated with the estimate of the parameter showed there were no significant differences between the two kinds of medium (Table 5).
Figure 4: Growth pattern of fresh whey fermentation containing 33g/L of lactose under optimized conditions
Table 4: Fitted parameters obtained for reconstituted whey fermentation
Model Parameters reconstituted whey ( confidence level 95%)
Parameters fresh whey ( confidence level 95%)
KS = (72.36 ± 8.40) g/L KS = (69.99 ± 10.82) g/L
µM = (0.0016 ± 0.0003) h-1 SS = 204.436 µM = (0.00450 ± 0.0048) h-1 SS = 269.683 YX/S = (0.0015 ± 0.0002)g/g R² = 0.8655 YX/L = 0.0031 ± 0.0033g/g R² = 0.8079 Monod
m = (0.00010 ± 0.00018)h-1 m = 0.00040 ± 0.000674 h-1
XM= (5.65 ± 0.40)g/L XM = (6.26 ± 0.34) g/L
µM = (0.09468 ± 0.0075) h-1 SS = 4.275 µM = (0.0902 ± 0.007) h-1 SS = 3.456 YX/L = (0.364 ± 0.0432) g/g R² = 0.9958 YX/L = (0.215 ± 0.022)g/g R² = 0.9956 Verhulst
m = (0.0168 ± 0.0015) h-1 m = 0.00398 ± 0.00034 h-1
µM = (0.179 ± 0.0745) h-1 µM = (0.199 ± 0.0496) h-1
B = (61.70 ± 29.33) g/g SS = 65.174 B = (59.31 ± 22.65) g/g SS = 105.533
YX/L = (0.218 ± 0.033) g/g R² = 0.9447 YX/L = (0.181 ± 0.042) g/g R² = 0.90864 Contois
m = (0.000301 ± 0.00042) h-1 m = (0.000050 ± 0.00005) h-1
Note: SS indicates sum of squared deviations
Table 5: Parameter inference for theVerhulst model- statistical difference between the reconstituted whey and fresh whey parameters
Parameter t-test ( reconstituted whey)
t-test
(fresh whey) Significantdifference
µM 0.00105 0.00105 No*
XM 0.144 0.131 No*
YX/L 0.0351 0.0351 No*
m 0.00302 0.00302 No*
*
Not significant means (95% confidence interval): -2.120≤ t-test value≤ 2.120
Immobilized Cells
The beads prepared by mixing a blend of sodium alginate and harvested cells into a calcium chloride solution were spherical particles with a mean diameter of 2.0 to 2.5 mm containing 109 cells/g. After stabili-zation by drying, the particles presented a final cell concentration of approximately 1011 viable cells/g
Brazilian Journal of Chemical Engineering Vol. 30, No. 02, pp. 267 - 276, April - June, 2013 Figure 7 shows the cell survival rate at fixed
temperatures of 40, 60 and 70 ºC, while the kinetics and the adjusted R-squared statistic for the Survival Models are presented in Table 6. As can be seen, the activation energies for the predicted death rates are highly consistent with the measured results. The values found indicate good thermal stability and
good storage stability (Zhao et al., 2008), and are in agreement with the literature. Gomes et al. (1998) found activation energies ranging from 37.7 to 58.6 kJ/mol for A. acidophilus in reconstituted milk, and Zhao et al. (2008) reported an activation energy of 124.43 kJ/mol for encapsulated Lactobacillus acidophilus XH1.
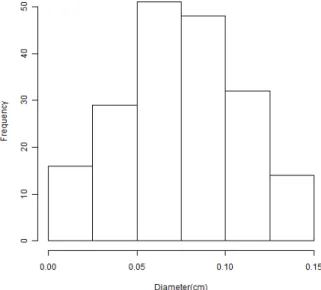
Figure 5: Histogram representation of the particle diameter of dried calcium alginate (mean value of 0.76 mm in a sample of 195 particles).
Figure 6: Histogram representation of the particle sphericity of dried calcium alginate (mean value of sphericity 0.77 in a sample of 195 particles).
Figure 7: Survival of calcium alginate immobilized cells dried at 40, 60, and 70 ºC.
Table 6: Immobilized cell stability – adjustedR-squared statistic for the Survival Models
Model Parameters R2
Ea = 134.8 kJ/mol First order
k0 = 3.83.1020
0.961
Ea = 46.1 kJ/mol k0 = 7.75.107 Weibull
n = 0.37
0.998
Ea = 277.2 kJ/mol t2
k0 = 2.18.1041
0.959
Figure 8 depicts the acid stability tests at pH 2.5 and a temperature of 37 ± 1 ºC for 30, 60 and 90 minutes. The D value found was 62.5 min (R2 =0.90), indicating that after 6 h of acid deactivation at pH 2.5, the beads remained within the limits of satisfactory viable cells with 5.86.105 viable cells/g.
Figure 8: Acid stability tests at pH 2.5 and temperature of 37 ± 1 ºC (log10(N/No)=-t/62.5, R2=0.90).
CONCLUSIONS
The main conclusions of this study were as follows: 1) the results indicate the potential use of whey to produce immobilized probiotic cells of Lactobacillus acidophilus LA 5; 2) The results obtained for reconstituted and fresh whey fermentations showed that there were no significant differences between the two kinds of medium; 3) The factorial design clearly showed that viable cell concentrations are optimized at lactose concentrations of 27 to 35 g/L, an inoculum size of 0.8 to 1.2 g/L, and pH of 6.0 to 7.0; 4) Comparisons of fermentation models for predicting Lactobacillus acidophilus probiotic production revealed that the Verhulst model was in good agreement with the experimental results.
ACKNOWLEDGEMENTS
The authors are indebted to Dr. Mônica L. Aguiar of the Laboratory of Environmental Control at the Federal University of São Carlos (UFSCar) for the measurements of particle sphericity and diameter. Financial support from the Brazilian research
funding agencies FAPEMIG (Fundação de Amparo à Pesquisa do Estado de Minas Gerais) and CNPq (Conselho Nacional de Desenvolvimento Científico e Tecnológico) is gratefully acknowledged.
REFERENCES
Annan, N. T., Borza, A. D., Hansen, L. T., Encapsulation in alginate-coated gelatin microspheres improves survival of the probiotic Bifidobacterium adolescentis 15703T during exposure to simulated gastro-intestinal conditions. Food Research International, v. 41, p. 184-193 (2008).
Apás, A. L, Arena, M. E., Draksler, D., González, S. N., Utilization of sugarcane industrial residues as animal food and probiotic medium. Journal of Bioscience and Bioengineering, v. 106, n. 4, p. 363-367 (2008).
Aragon-Alegro, L. C., Alegro, J. H. A., Cardarelli, H. L., Chiub, M. C., Saad, S. M. I., Potentially probiotic and synbiotic chocolate mousse. LWT – Food Sci. Technol., v. 40, p. 669-675 (2007). Baillon, M. L. A., Marshall-Jones, Z.V., Butterwick,
R. F., Effects of probiotic Lactobacillus acidophilus strain DSM13241 in healthy adult dogs. American Journal of Veterinary, v. 65, n. 3, p. 338-343 (2004).
Bailey, J. E. and Ollis, D. F., Biochemical Engineering Fundamentals. 2nd Ed., McGraw-Hill, New York (1986).
Balcázar, J. L., Blas, I., Ruiz-Zarzuela, I., Cunningham, D., Vendrell, D. and Múzqui, J. L., The role of probiotics in aquaculture. Veterinary Microbiology, V. 114, N.3-4, p. 173-186 (2006). Capela, P., Hay, T. K. C., Shah, N. P. Effect of
homogenisation on bead size and survival of encapsulated probiotic bacteria. Food Research International, v. 40, p. 1261-1269 (2007).
Chan, E.S., Zhang, Z., Bioencapsulation by compression coating of probiotic bacteria for their protection in an acidic medium. Process Biochemistry, v. 40, p. 3346-3351 (2005).
Chávarri, M., Izaskun Marañón, I., Ares, R., Ibáñez, F. C., Marzo, F., María del Carmen Villarán, Microencapsulation of a probiotic and prebiotic in alginate-chitosan capsules improves survival in simulated gastrointestinal conditions. International Journal of Food Microbiology, v. 142, p. 185-189 (2010).
Brazilian Journal of Chemical Engineering Vol. 30, No. 02, pp. 267 - 276, April - June, 2013 coli strains in ruminant digestive contents in the
absence and presence of probiotics. Applied and Environmental Microbiology, v. 76, n. 3, p. 640-647 (2010).
Cruz, A. G., Faria, J. A. F., van Dender, A. G. F., Packaging system and probiotic dairy foods. Food Research International, v. 40, p.951-956 (2007). Dembczynski, R. and Jankowski, T., Growth
Characteristics and Acidifying Activity of Lactobacillus rhamnosus in Alginate/Starch Liquid-core Capsules. Enzyme and Microbial Technology, v. 31, n. 1, p. 111-115 (2002).
DiGeronimo, M. J., Nikaido, M., Alexander, M., Most probable number technique for the enumeration of aromatic degraders in natural. Environments Microbial Ecology, v. 4, p. 263-266 (1978).
Fuller, R., Probiotics in man and animals: A review. Journal of Applied Bacteriology, v. 66, n. 3, p. 365-78 (1989).
Gomes, A. M. P., Teixeira, M. G. M., Malcata, F. X., Viability of Bifidobacterium lactis and Lactobacillus acidophilus in milk: sodium chloride concentration and storage temperature. Journal of Food Processing and Preservation, v. 22, n. 3, p. 221-240 (1998).
Leary, N. O., Pembroke, A., Duggan, P. F., Improving accuracy of glucose oxidase procedure for glucose determinations on discrete analyzers. Clinical Chemistry, v. 38, n. 2, p. 298-302 (1992). Lowry, O. H., Robsenbrough, N. J., Farr, A. L.,
Randall, R. J., Protein measurement with the Folin phenol reagent. J. Biol. Chem., v. 193, p. 265-275 (1951).
Kailasapathy, K., Survival of free and encapsulated probiotic bacteria and their effect on the sensory properties of yoghurt. LWT Food Science and Technology, v. 39, p.1221-1227 (2006).
Krasaekoopt, W., Bhandari, B., Deeth, H., The influence of coating materials on some properties of alginate beads and survivability of microen-capsulated probiotic bacteria. International Dairy Journal, v. 14, p. 737-743 (2004).
Man, J. D., Rogosa, M., Sharpe, M. E., A Medium for the Cultivation of Lactobacilli. J. Appl. Bact., v. 23, p. 130-135 (1960).
de Magalhães, J. T., Uetanabaro, A. P. T., Moraes, C. A., Identification of Lactobacillus UFV H2B20 (probiotic strain) using DNA-DNA hybridization. Brazilian Journal of Microbiology, v. 39, p. 524-546 (2008).
Marshall-Jones, Z. V., Baillon, M. L. A., Croft, J. M., Butterwick, R. F., Effects of Lactobacillus acidophilus DSM13241 as a probiotic in healthy
adult cats. American Journal of Veterinary Research, v. 67, n. 6, p. 1005-1012 (2006).
Meng, X. C., Stanton, C., Fitzgerald, G. F., Daly, C., Ross, R. P., Anhydrobiotics: The challenges of drying probiotic cultures. Food Chemistry, v. 106, p. 1406-1416 (2008).
Miller, G. L., Use of dinitrosalicylic acid reagent for determination of reducing sugar. Anal. Chem., v. 31, n. 3, p. 426-428 (1959).
Mitic, S., Otenhajmer, I., Damjanovic, V., Predicting the stabilities of freeze-dried suspensions of Lactobacillus acidophilus by the accelerated storage test. Cryobiology, v. 11, n. 2, p. 116-120 (1974).
Oelschlaeger, T. A., Mechanisms of probiotic actions – A review. International Journal of Medical Microbiology, v. 300, p. 57-62 (2010).
Ozmihci, S., Kargi, F., Ethanol production from cheese whey powder solution in a packed column bioreactor at different hydraulic residence times. Biochemical Engineering Journal, v. 42, n. 2, p. 180-185 (2008).
Pan, X., Chen, F., Wu, T., Tang, H., Zhao, Z., The acid, bile tolerance and antimicrobial property of Lactobacillus acidophilus NIT. Food Control, v. 20, n. 6, p. 598-602 (2009).
Prazeres, A. R., Carvalho, F., Rivas, J., Cheese whey management: A review. Journal of Environmental Management, v. 110, p. 48-68 (2012).
Rayment, P. Wright, P., Hoad, C., Ciampi, E., Haydock, D., Gowland, P., Butler, M. L F., Investigation of alginate beads for gastro-intestinal functionality, Part 2: In vivo characterization. Food Hydrocolloids, v. 23, n. 3, p. 833-839 (2009).
Rech, R. and Ayub, M. A. Z., Fed-batch bioreactor process with recombinant Saccharomyces cerevisiae growing on cheese whey. Braz. J. Chem. Eng., v. 23, no. 4, p. 435-442 (2006). Selmer-Olsen, E., Pehrson, R., Sørhaug, T.,
Birkeland, S. E., Effect of drying medium on the viability of dried Lactobacillus helveticus CNRZ 303 immobilized in calcium-alginate beads. Progress in Biotechnology, v. 11, p. 229-235 (1996).
Sun, X., Kurosu, S., Shintani, H., The expanded application of most probable number to the quantitative evaluation of extremely low microbial count. PDA J. Pharm. Sci. Tech., v. 60, n. 2, p. 124-134 (2006).
Taha, H. A., Operations Research: An Introduction. 8th Edition, New York, Prentice Hall (2006). Talwalkar, A., Kailasapathy, K., The role of oxygen
to L. acidophilus and Bifidobacterium spp., Curr. Issues Intest. Microbiol., v. 5, p. 1-8 (2004). Tamime, A., Brined Cheeses. London: Blackwell
Publishing Ltd. p. 324 (2006).
Tari, C., Ustok, F. I. and Harsa, S., Optimization of the associative growth of novel yoghurt cultures in the production of biomass, β-galactosidase and lactic acid using response surface methodology. International Dairy Journal, v. 19, n. 4, p. 236-243 (2009).
Wohlgemuth, S., Loh, G., Blaut, M., Recent developments and perspectives in the investiga-tion of probiotic effects. Internainvestiga-tional Journal of Medical Microbiology, v. 300, p. 3-10 (2010). Zhao, R., Sun, J., Torley, P., Wang, D., Niu, S.,