417 Maria Augusta Gonçalves Fujaco
Professora
Universidade Federal de Ouro Preto – UFOP Escola de Minas
Departamento de Geologia Ouro Preto – Minas Gerais - Brasil [email protected]
Mariangela Garcia Praça Leite
Professora Associada
Universidade Federal de Ouro Preto – UFOP Escola de Minas
Departamento de Geologia Ouro Preto – Minas Gerais - Brasil [email protected]
Antônio Henrique Caldeira Jorge Neves
Engenheiro Geólogo
Universidade Federal de Ouro Preto – UFOP Escola de Minas
Departamento de Geologia Ouro Preto – Minas Gerais - Brasil [email protected]
A gis-based tool for
estimating soil loss in
agricultural river basins
Abstract
Soil erosion is a major problem observed in terrestrial ecosystems. Monitoring and identifying potential areas for erosion becomes extremely important for the better management of these areas. The main aim of this study was to develop a Geographic Information System script tool based on the universal soil loss equation (USLE), which calculates soil loss in three large agricultural sub-basins. Algorithms were implemented in the graphical interface of ModelBuilder and later in Python programming language, thus allowing the creation of a speciic script to calculate soil loss in an automatic way. The "USLE Paracatu Watershed" script was validated and proved to be effective in es-timating erosion in the three sub-basins with an average processing time of half second per km2. This can be added via "ArcToolbox" toolbox in ArcGIS software, so that the user only has to add the variables of the USLE equation and the software will process the algorithms in an automatic way, generating the inal map with the soil loss value (t/ha.year). The friendly interface of the script allows it to be used in any area, only requiring the user to enter the updated data of parameters that compose the equation.
Keywords: universal soil loss equation, GIS, script, watershed.
Geosciences
Geociências
http://dx.doi.org/10.1590/0370-44672015690197
1. Introduction
Erosion processes, terrestrial relief modelers, are natural events taking place worldwide over geological time. However, the propensity of a particular area to soil loss can be enhanced due to its use and occupation, particularly in cases involving the removal of native vegetation (Foucher et al., 2014).
Cur-rently, soil erosion is a serious problem that threatens watersheds in tropical regions with intense agricultural use (Sreeja et al., 2015). Such erosion
pro-cesses not only promote loss of fertile soil, but also increase the amount of particulate matter carried to rivers, reservoirs and seas, with consequent deposition and silting, deteriorating the quality of ecosystems. There is an increasing need for tools that enable eficient and optimized management of these resources. There is no single method that provides assessment and quantification of erosion processes,
since erosion calculation is directly linked to spatial scale and the study pur-pose (Warren, 2002). One of the models most widely used for the calculation of soil loss in agricultural areas is USLE (Universal Soil Loss Equation), devel-oped by Wischmeier (1978) linked to the United States Agriculture Research Service. This seemingly simple equa-tion has shown great potential in the evaluation of erosion in regional scale, both in the identiication of potentially erodible areas, as in monitoring erosion over time. Its eficiency is based on the estimation of the main factors that con-trol erosion processes (Wischmeier and Smith, 1978): rainfall erosivity (R), soil erodibility (K), topographical factors (LS), soil use and occupation (C) and conservation practices (P). These fac-tors, when specialized, may be entered into a GIS database, so that the results (output) obtained by geoprocessing
techniques are represented in a grid of geo-referenced cells, allowing a quanti-tative analysis of the spatial distribution of erosion. Soil loss estimated through GIS has lower costs as compared with traditional methods, and greater ac-curacy for large areas (Lu et al., 2004
and Erdongan et al., 2007). Therefore,
the use of USLE based on Geographical Information Systems (GIS) is increas-ingly common, especially in watersheds of developing countries, where agri-cultural areas are large and resources used for the sustainable management of these regions are scarce (Fistikoglu and Harmancioglu, 2002; Erdogan et al. 2007; Pandey et al., 2007; Dabral et al., 2008; Ozcan et al., 2008; Beskow et al., 2009; Devatha et al., 2015; Guo et al., 2015). Nevertheless, there are few
of this study was to develop and test a tool on a GIS platform that calculates the erosion rate based on the USLE empirical model. This is a script cre-ated through ModelBuilder and ArcPy features (ESRI, 2015). Initially, the con-ceptual model of USLE was built using ModelBuilder, where spatial problems and techniques to be used were deined, which were used to deine input data
and structure algorithms. Subsequently, IDE PyScripter was used in the imple-mentation, editing and debugging of algorithms used in the construction of the tool (script tool). The script created was then added as a tool (script tool) to the ArcGIS desktop software 10.2. The developed tool will increase the eficiency in the management of water-sheds, reducing the time and allowing
its application in areas of different sizes, geomorphologies and uses. In addition to these advantages, being an “add in” in the ArcGIS 10.2® software, it be-comes a tool with a friendly interface to users, who will not need to be experts in GIS, since they only need to select the input of layers, which in this case are the parameters that compose the USLE formula.
2. Material and methods
2.1 Description of the study area
The Paracatu Watershed (BHRP) is inserted between geographical co-ordinates 15°30 '/ 19°30'S and 45°10'/ 47°30'W, covering an area of 45,600 km2, and 92% of this area, approxi-mately 41,600 km2 belong to the state of Minas Gerais, and the remaining 5% and 3% are distributed between state of Goias and the Federal District (IGAM,
2006). The climate of the Paracatu Wa-tershed is classiied as rainy megathermal Aw type (Köppen. - Pellet et al., 2007),
i.e., it presents a summer rainy season from October to April (93% of the an-nual total rainfall) and a dry winter sea-son from May to October, when rainfall is minimal and the temperature is mild, with an average monthly temperature
of 18°C (IGAM, 2006). The study area includes three Paracatu River sub-basins (Figure 1): the Entre Ribeiros sub-basin (ET), Rio Verde and Rio Escuro. These areas are heavily occupied by mecha-nized agriculture, in which the irrigation method adopted is by central pivot, in ad-dition to other activities such as livestock and eucalyptus monoculture.
Figure 1
Localization map
419
2.2 Data sources and processing methods
The satellite images used in this study include SRTM radar imaging (Shuttle Radar Topographic Mission), spa-tial resolution of 30m, which was used to obtain the LS factor and ASTER satellite imaging to make the map of soil use and
occupation of 2006 (C factor). The soil map of the Paracatu Watershed Master Plan (IGAM, 2006), which forms the basis for obtaining the K factor together with historical data from 35 weather sta-tions were used for the generation of the
R factor (Figure 1). In a pre-processing step, data were converted to a common projection system (World Geodetic System 1984 Zone 23S). In its original version, the Universal Soil Loss Equation (USLE) is as follows (Wischmeier and Smith, 1978):
A = R K LS C P
Equation (1)
Equation (2)
Equation (3)
Equation (4)
Equation (5)
Equation (6)
Equation (7) Where:
A is the average annual soil loss (t/ha.year), R is the erosivity factor
(MJ.mm /ha h), L is the length factor (dimensionless), S is the slope factor (dimensionless), C is soil use /
manage-ment factor and P is the factor related to conservation practices (dimensionless).
2.2.1 USLE factors
The erosivity factor (R) is deined as the sum of the annual average of products of kinetic energy and rainfall by the
maxi-mum intensity for a period of 30 min (I30). In this study, the R factor was estimated from historical data of 35 rainfall stations
spa-tially distributed over the three sub-basins evaluated in this study (Figure 1), using the equation developed by (Carvalho et al. 1991):
El
30= 111.17 * (r/P)
2Where:
EI30 corresponds to the average month-ly erosivity index (MJ.mm/ha.h), (r)
is the average monthly total rainfall (mm), and P is the average total an-nual rainfall (mm). For determining
(R), the monthly values for each rain-fall station were added, according to Equation 3:
E =
12j=1E
30jThe soil erodibility map (K factor) was obtained by the soil map georeferenc-ing (scale of 1: 500,000) of the Master Plan for Water Resources of the Para-catu Watershed and adapted from (Silva, 2004). The soil use and occupation factor (C) and the conservation practices factor (P) were obtained from ASTER images
of July 2006. To obtain the soil use and occupation of sub-basins, a supervised classiication method was applied (Like-lihood algorithm), using the ENVI 4.2® software. This classiication resulted in the following classes: 1- Natural vegeta-tion (CP= 0.006); 2 - Eucalyptus planta-tion (CP=0.012); 3 – Pivots (CP=0.09);
4- Pastures (CP=0.025); 5- Wetlands / water (CP=0.00); 6 – Shade (CP=0.00). The soil use and occupation map was reclassiied to the respective C values.
The calculation of the L topo-graphic factor was performed using the algorithm of Desmet and Govers (1996) (Equation 4):
A
ij-in+D
2m+1A
m+1 ij-in-L
ij=
D
m+2.x
ij
22.13
m m
Where:
Lij is the length factor of a cell with coor-dinates (i, j), Aij-in is the contribution area of the cell with coordinates (i, j) in (m2), D is
the cell size (meters), X is the aspect coef-icient for the cell grid with coordinates (i, j) and m is the slope function coef-icient for the cell grid with coordinates
(i, j). Exponent m was calculated from β, which is the ratio between the erosion channels and inter-channels, as suggested by Renard et al. (1997):
β
β
+ 1
�
=
Where β is given by Equation 6:
β
=
sin
θ
0.0896
sin
θ
3.0 ( )
0.8+ 0.056
The slope (S) was calculated according to Renard et al. (1987):
10.8 sin
θ
(ij)+ 0.03
tan
θ
(ij)< 0.09
16.8 sin
θ
(ij)- 0.5
tan
θ
(ij)< 0.09
s
(i,j)=
allowing the automatic calculation of this parameter via ArcGis® software, resulting in LS maps of the three sub-basins.
2.3 Development of the "USLE Paracatu Watershed" script
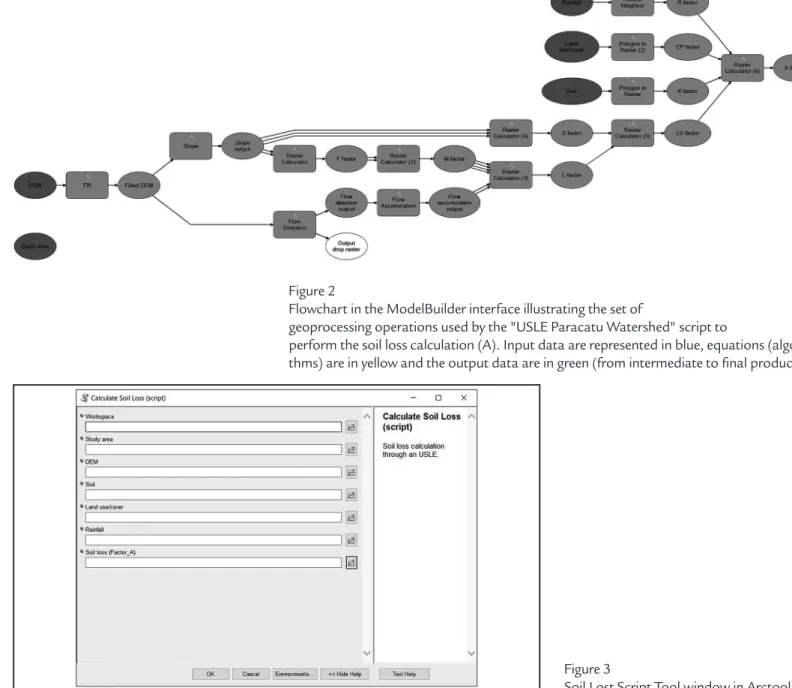
In the cartographic modeling, the geoprocessing mechanism in-volves entering input data, perform-ing a mathematical operation in this set of data and returning the results as output data. It was observed that these mathematical operations are carried out with matrix and vector data. The implementation of equations described above (Figure 2) was carried
out in the graphical interface of the ModelBuilder in ArcGis® for desktop software 10.2.2 (ESRI, 2015) and sub-sequently implemented in Python 2.7 programming language, thereby help-ing to create a speciic script to make the soil loss calculation (A). Then, the code for implementing the Phyton algorithm was created, subsequently used for adding a tool (script tool –
Figure 3) in a set of tools (toolbox) in the ArcGIS software with the Spatial Analyst extension. This tool runs in ArcGis versions that support Phyton 2.7. Raster Calculator deines raster cell size based on DEM resolution.
Thus, erosion estimate (A) was obtained from the product (output) of all plans of information related to the USLE factors, using equation 1 (inputs).
Figure 2
Flowchart in the ModelBuilder interface illustrating the set of
geoprocessing operations used by the "USLE Paracatu Watershed" script to
perform the soil loss calculation (A). Input data are represented in blue, equations (algori-thms) are in yellow and the output data are in green (from intermediate to final products).
Figure 3
Soil Lost Script Tool window in Arctoolbox.
2.4 Data Validation
2.4.1 Total soil loss (A)
After applying Equation 1, the total soil loss maps (A) were obtained. In order to validate these results, the average soil losses were calculated for each sub-basin,
eliminating 10% of their most extreme values, according to the procedure ad-opted by Silva (2004). Then, the values obtained for soil loss in each sub-basin
421
Total annual sediment load (t/year)
Stations Current study
(estimated for 2006)
Silva, 2004 (estimated for 1999)
Carvalho, 1994 (measured between 1976 e 1982)
Santa Rosa 2.22 x 10⁶ 2.92 x 10⁶ 2.02 x 10⁶
Porto Alegre - 5.48 x 10⁶ 5.20 x 10⁶
Table 1 Total annual sediment load (t/year) in Santa Rosa and Porto Alegre stations.
2.4.2 Sedimentological data
Unfortunately, there are no sedi-mentometrical stations in the basins studied, so the erosion values obtained were compared to sedimentological
data from two stations of the Para-catu Watershed: Santa Rosa station - covering a drainage area of 13,067? km2 (downstream of the Rio Escuro
sub-basin - Figure 1); and the Porto Alegre station - with drainage surface of 42,171? km2 (downstream of all sub-basins - Figure 1).
2.4.3 Sediment delivery
The total soil loss calculated by USLE is most often greater than the sediment load measured at the mouth of basins (Zhou and Wu, 2008), the
re-sult of sedimentation along waterways. The sediment delivery ratio (SDR) is used to correct this reduction. Thus, to validate the results, from values of the
average annual soil loss of the sediment delivery in stations, Equation 8 (Lu et al., 2003) and Equation 9 were used
(Renfro, 1975).
where SDR is the sediment delivery ratio (%); Y is the sediment supply in the mouth of the basin (t/year); A is the average loss of soil within the basin (t ha-1/year); a is the contribution area.
The sediment input values in the mouth of each station are in Table 1. In this study, the value was estimated for the year 2006 from the liquid low x solid low ratio in the time historical series from 1976 to
2015. The average soil loss calculated for the input area of each station was then compared with value corresponding to that obtained by USLE for each sub-basin, assuming the value obtained as a function of the input area. Equation (8)
SDR =
y
A
Equation (9)
SDR =
1
a
0.23. Results and discussion
3.1 Processing time optimization
After installing the script, the pro-cessing time is a few minutes per basin,
0.12 seconds per km2 in computer with processor I7 and 8GB of RAM.
3.2 Soil loss and geographical distribution of soil erosions
The three sub-basins show a simi-lar pattern of soil use and occupation. Livestock activity occupies the largest area always above 45%: (49.79% (RV), 52.28% (RE) and 49.45% (ER)), values similar to those of still preserved areas: (43.39% (RV); 41.68% (RE) and 45.89% (ER). The latter situated on the banks of waterways (riparian forests) and slopes (rocky grassland).
Entre Ribeiros: The highest erosion
rates were found for Lithic Neosols and Haplic Cambisols (Figure 4), which are associated with cliffs of the São Fran-cisco plateau and Unai ridges, register-ing annual soil loss values (A) greater than 12.7t/ha.year (Figure 4a).Due to the geomorphology and poor and shal-low soils, these areas are considered to be restricted to agriculture. Areas with lower erosion values in the ER basin (Figure 4a) are located in geomorphology
unit designated by São Francisco depres-sion, where (A) values range from 0.0t/ ha.year to 12.6t/ha.year. Predominant soils are "red latosols" described as not hydromorphic mineral soils, deep and porous, with thick B horizon, and in addition to these physical characteristics (EMBRAPA, 1999), these are associ-ated with a lat and gently wavy relief, where there are large areas of irrigated agriculture, pastures and reforestation. The lowest erosion values are related to the reduced slope along with the practice of good conservation techniques, despite the intense soil use.
Rio Escuro: Analyzing erosion
maps (A) (Figure 4b) it was observed that the highest erosion rates are in Lithic Neosols and Haplic Cambisols, with values above 17.2t/ha.year. Areas of lat and gently wavy relief show the lowest A values, which range from 0.0t/ha.year to
17.1t/ha.year, dominated by red latosols and red yellow latosols, which by their physical and chemical characteristics allow the development of agricultural activities.
Rio Verde: In Rio Verde, the
within expected values, i.e., between 0.0t/ha.year and 9.3t/ha.year because, according to (Bertoni and Lombardi Neto, 1990), the soil loss tolerance in Brazil ranges from 4.5 to 15.0t/ha.year
with average of 10t/ha.year. The highest erosion rates were registered for Lithic Neosols, and these values are related to cliffs. According to soil loss data, although these regions are susceptible
to erosion, the soil use and occupation map has shown that these are covered by natural vegetation (forest and savanna), reducing the erosive process. However, if vegetation is removed, erosion can occur.
Figure 4
a - Spatial soil erosion distribution (A) of the Entre Ribeiros sub-basin; b – Rio Escuro sub- basin; c- Rio Verde sub basin.
3.3 Results validation
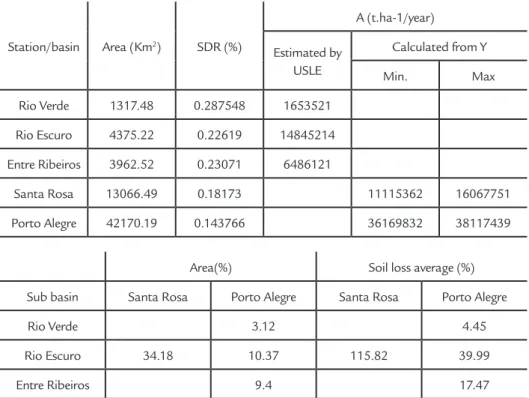
Observing data shown in Tables 2 and 3, it is clear that high erosion values (A), especially in the Rio Escuro basin, are directly related to the LS factor and not the use of the basin. This trend becomes clear when the results of the study sub-basins are observed; that is,
the sub-basin with higher percentage of area with LS values ≥2.1 (5.9% in Rio Verde, 15.03% in Entre Ribeiros and 22.86% in Rio Escuro). The Rio Escuro sub-basin presented the most discrep-ant values calculated for SDR. Several studies have shown that when the LS
factor is high (many sloping areas), this predominates over the other USLE parameters and hence increases the A values (Zhang et al. 2011; Wenyi et al.
2013). When applied to areas with steep slopes, this soil loss calculation model results in overvalued A values.
(a)
423
Station/basin Area (Km2) SDR (%)
A (t.ha-1/year)
Estimated by USLE
Calculated from Y
Min. Max
Rio Verde 1317.48 0.287548 1653521
Rio Escuro 4375.22 0.22619 14845214
Entre Ribeiros 3962.52 0.23071 6486121
Santa Rosa 13066.49 0.18173 11115362 16067751
Porto Alegre 42170.19 0.143766 36169832 38117439
Table 2 Sediment contribution (%) and soil loss average (A) in the stations and sub-basins.
Table 3 Estimated loss soil contribution (%) based on sub-basin areas.
Area(%) Soil loss average (%)
Sub basin Santa Rosa Porto Alegre Santa Rosa Porto Alegre
Rio Verde 3.12 4.45
Rio Escuro 34.18 10.37 115.82 39.99
Entre Ribeiros 9.4 17.47
4. Conclusions
The results of this study showed that the universal soil loss equation (USLE) was effective in estimating the erosion in large watersheds when adapt-ed to a Geographic Information System (GIS). The "USLE Paracatu Watershed" script developed for these basins allowed the identiication and characterization of soil loss in a prompt, effective and robust manner. The processing time for the three sub-basins showed that although areas are large, the average processing time was less than one second per km2.
Thus, for future management, this model could be used in a practical and effective way because now the user needs only to enter updated data (DEM, Land Use/ cover map and Rainfall map), and the software will automatically process the algorithms previously described in the methodology, generating the product; in this case, the amount of erosion of the selected area. This tool (script) will contribute to eficiency as it will optimize time and will offer greater lexibility in order to enable the implementation of
processes with updated input parameters from different years, or even different locations. According to results obtained by Gomez (2012), the soil erosion mod-eling on large scales using the universal soil loss equation (USLE) showed good results in the characterization of the Brazilian territory. The automated (GIS) modeling provides an overview of the system, allowing easy access to informa-tion by the general public, and therefore the generation of conservation policies in units under study.
5. References
BERTONI, J., NETO, L. Conservação do Solo. São Paulo. Icone, 1990. 335 p.
BESKOW. S., MELLO, C. R., NORTON, L. D., CURI, N., VIOLA, M, R., AVANZI, J. C. Soil erosion prediction in the Grande River Basin, Brazil using distributed mode-ling. Catena, v. 79, n. 1, p. 49-59, 2009.
CARVALHO, M. P., LOMBARDI, N., FILHO, V. J., CATANEO, A. Corrrelação entre o índice de erosividade EI30 médio mensal e o coeiciente de chuva do município de Mococa – SP. Cientíica, v. 19, p. 1-7, 1991.
DABRAL, P. P., BAITHURI, N., PANDEY, A. Soil erosion assessment in a hilly catch-ment of North Eastern India using USLE, GIS and remote sensing. Water Resources Management, v. 22, n. 12, p 1783–1798, 2008.
DESMET, P. J. J., GOVERS, G. A Gis procedure for automatically calculating the USLE LS factor on topographically complex landscape units. Journal soil and Water Con-servation, v. 51, n. 5, p. 427-433, 1996.
DEVATHA, C. P., DESHPANDE, V., RENUKAPRASAD, M. S. Estimation of soil loss using USLE model for Kulhan Watershed, Chattisgarh- a case study. Aquatic Proce-dia, v. 4, p. 1429–1436, 2015.
EMBRAPA - Empresa Brasileira de Pesquisa Pecuária. Sistema Brasileiro de Classiica-ção de Solos. Brasília: Serviço de ProduClassiica-ção da InformaClassiica-ção – SPI, 1999. 412p.. ERDOGAN, E. H., ERPUL, G., BAYRAMIN, I. Use of USLE/GIS methodology for
Monito-Received: 18 January 2016 - Accepted: 10 August 2016. ring Assessment, v. 131, n. (1-3), p. 153–161, 2007.
ESRI, 2015. ArcGIS for Desktop, version 10.2.1: Gis Software. Redlands, CA, Environ-mental Sytems Research Institute.
FISTIKOGLU, O., HARMANCIOGLU, N. B. Integration of GIS and USLE in assess-ment of soil erosion. Water Resources Manageassess-ment, v. 16, n. 6, p. 447–467, 2002. FOUCHER, A., BLANES, S. S., EVRARD O., SIMONNEAU, E.C., CHAPRON, E.,
COURP, T., CERDAN, O., LEFEVRE, I., ADRIAENSEN, H., LECOMPTE, F., DESMET, M. Increase in soil erosion after agricultural intensiication : evidence from a lowland basin in France. Anthropocene, v. 7, p. 30–41, 2014.
GÓMEZ, J. D. P. Estimativa de erosão pela Equação Universal de Perda de Solo (USLE) e transferência de sedimentos para todo território Brasileiro Piracicaba. São Paulo: Universidade de São Paulo - Escola Superior Agrícola de Agricultura “Luiz de Queiroz”, 2012. 90 p. (Dissertação de Mestrado).
GUO, L., DI, L., LI, G., LUO, Q., GAO, M. GIS-based detection of land use transfor-mation in the Loess Plateau: a case study in Baota District, Shaanxi Province, China. Journal of Geographical Sciences, v. 25, n. 12, p 1467–1478, 2015.
INSTITUTO GESTÃO DE ÁGUA DE MINAS. IGAM. Plano Diretor de Recursos Hí-dricos da Bacia Hidrográica do Rio Paracatu. p. 387, 2006.
LU, D., LI, G., VALLADARES, G. S., BATISTELLA, M. Mapping soil erosion risk in Rondonia, Brazilian Amazonia: using rusle, remote sensing and gis. Land Degrada-tion and Development, v. 15, p. 499–512, 2004.
MCCOOL, D. K., BROWN, L. C., FOSTER, G. R., MUTCHLER, C. K., MEYER, L. D. Revised slope steepness factor for the Universal Soil Loss Equation. Trans ASAE, v. 30, p. 1387-1396, 1987.
OZCAN, A. U., ERPUL, G., BASARAN, M., ERDOGAN, H. E. Use of USLE/GIS technology integrated with geostatistics to assess soil erosion risk in different land uses of Indagi Mountain Pass–Çankiri, Turkey. Environmental Geology, v. 53, n. 8, p. 1731–1741, 2008.
PANDEY, A., CHOWDARY,V. M., MAL, B. C. Identiication of critical erosion prone areas in the small agricultural watershed using USLE, GIS and remote sensing. Water Resources Management, v. 21, n. 4, p. 729–746, 2007.
PEEL, M. C., FINLAYSON, B. L., MCMAHON. Updated world map of the Köppen--Geiger climate classiication. Hydrology and Earth System Sciences, v. 11, p. 1633-1644, 2007.
RENARD, K. G., FOSTER, G. A., WEESIES, G. A., MCCOOL, D. K., YODER, D. C. Predicting soil erosion by water: a guide to conservation planning with the revised universal soil loss equation (RUSLE). Washington, 1997. 703 p.
RENFRO, W. Use of erosion equations and sediment delivery ratios for predicting sediment yield, in present and prospective technology for predicting sediment yield and sources. USDA ARSS-40. Washington, 1975. p. 33-45.
SILVA, V. C. Erosão atual, erosão potencial e aporte de sedimento na bacia do Rio Paracatu (MG/GO/DF). Brasília: Universidade de Brasília, 2001. 222 p. (Tese de Doutorado).
SREEJA, K. G. C., MADHUSOODHANAN, G., ELDHO, T. I. Transforming river ba-sins : post-livelihood transition agricultural landscapes and implications for natural re-source governance. Journal of Environmental Management, v.159, p. 254–26, 2015. WARREN, A. Land degradation is contextual. Land Degradation and Development, v.
13, p. 449-459, 2002.
WENYI, S., SHAO, Q., LIU, J. Soil erosion and its response to the changes of precipita-tion and vegetaprecipita-tion cover on the Loess Plateau. Journal of Geographical Sciences, v. 23, n.6, p.91–1106, 2013.
WISCHMEIER, W. H., SMITH, D. D. Predicting rainfall erosion losses - a guide to conservation planning. Agriculture Handbook. Washington: Agriculture Science and Education Administration. , 1978. 58 p.
ZHANG, C., XIE, G., LIU, C., LU, C. Assessment of soil erosion under woodlands using USLE in China. Frontiers of Earth Science, v.5, n. 2, p. 150–161, 2011. ZHOU. W., WU, B. Assessment of soil erosion and sediment delivery ratio using remote