_________________________________
1 Engo Agrônomo, Doutorando em Engenharia de Sistemas Agrícolas - ESALQ / USP, Piracicaba - SP, Fone: (0XX19) 3447.8530,
2 Engo Agrônomo, Professor Doutor da ESALQ / USP, Piracicaba - SP, Fone: (0XX19) 3447.8530, [email protected].
Recebido pelo Conselho Editorial em: 7-10-2010 Aprovado pelo Conselho Editorial em: 22-8-2011
THE RELIEF AND FOREST COVER
RAFAEL MINGOTI1, CARLOS A. VETTORAZZI2
ABSTRACT:With the intense debate, in Brazil, between landowners and public agencies about the amount of area with forest cover needed in different regions, there is an increase of the need for provision of technical data used as a basis for decision making. One of the criteria to evaluate the effect of forest cover in protecting water resources is the soil loss, which leads to several consequences on the environment, including the silting of the rivers. Therefore, this study aimed to evaluate the reduction in the soil loss in micro watersheds with different reliefs, size and location of forest cover, in the Corumbataí River watershed, in the state of São Paulo, using the Revised Universal Soil Loss Equation (RUSLE) in a GIS environment. For this study, 18 watersheds in three degrees of slope were selected, and 20 scenarios for land-use were established, by analyzing the influence of the PPA size, and the size and the location of the Legal Reserve. The results showed that: a) the effect of forest cover in reducing annual soil loss varies depending on the average slope of the watershed; b) the PPA width must be determined taking into account the slope of the watershed; c) the Legal Reserve must be located along the PPA. These provide better results in reducing annual soil loss.
KEYWORDS:GIS, RUSLE, legal reserve, permanent preservation area.
REDUÇÃO RELATIVA DA PERDA DE SOLO ANUAL EM MICROBACIAS HIDROGRÁFICAS EM FUNÇÃO DO RELEVO E DA COBERTURA FLORESTAL
RESUMO: Com a intensa discussão, no Brasil, entre proprietários e órgãos públicos sobre a quantidade de área com cobertura florestal necessária em diferentes biomas, ocorre o aumento da necessidade de disponibilização de dados técnicos que sirvam de embasamento para a tomada de decisões. Um dos critérios para se avaliar o efeito da cobertura florestal na proteção aos recursos hídricos é a perda de solo, que ocasiona diversas consequências no ambiente, entre as quais o assoreamento dos cursos d’água. Com isso, este trabalho teve como objetivo geral avaliar a redução na perda de solos em microbacias hidrográficas com diferentes relevos e diferentes tamanhos, e as localizações da cobertura florestal, na bacia do Rio Corumbataí-SP, usando a Equação Universal de Perda de Solo Revisada (RUSLE) em ambiente SIG. Para o estudo, foram escolhidas 18 microbacias, em três classes de declividade, e estabelecidos 20 cenários de uso e ocupação do solo, analisando a influência do tamanho da APP e do tamanho e localização da Reserva Legal. Os resultados permitiram concluir que: a) o efeito da cobertura florestal na redução da perda de solo anual é variável, em função da declividade média da microbacia; b) a largura da faixa de APP deve ser determinada levando-se em consideração a declividade da microbacia; c) a RL deve estar localizada ao longo da APP. Estas características trazem melhores efeitos na redução da perda de solo anual.
INTRODUCTION
The role of forests in the life of the population, in the habitat of countless species of plants and animals, in the maintenance of the hydrological cycle (adding water to the atmosphere through the process of transpiration), it is understood long time ago, however, only in recent decades is that the influence of forests on climate, air, water, soil, health and psychological aspects of mankind has gained its real importance, because negative effects on quality of life began to appear. The destruction of forests has caused serious problems for the balance of the biosphere, such as loss of soil by wind, by water, soil degeneration, and air pollution.
In Brazil, deforestation began in its discovery, because, according to BARBOSA (2009), slightly more than 500 years of the country were undoubtedly made at the mercy and luck of the Atlantic Forest and part of the Amazon. Regarding the Brazilian Atlantic Forest, its most significant deforestation began after the arrival of the first European settlers, when the process of exploitation and consequent fragmentation of the forest have intensified up to the present day, i.e., after five hundred years of colonization, many of these forests have been devastated, leaving currently less than 7% of its original area, mainly distributed in the states of São Paulo, Paraná, Santa Catarina and Rio Grande do Sul (ROCHA & FELDMANN, 2006).
In order to establish the amount and form of preservation of forests in Brazil, the Forest Code was published in 1965. Through this law, Permanent Preservation Areas (PPA) and the areas of Legal Reserve (LR) were created, which, in turn, specify to different biome which is the amount of forest that must be preserved. After the publication of the Forest Code, a discussion began, that has not stopped intensifying until the current time, between landowners and public agencies on the amount of area with forest cover that must be preserved in different regions, as the landowners claim they have acquired the land in a state of complete deforestation, and they are having losses to recover the native vegetation, while, on the other hand, government and environmental groups argue that the requirements of the present legislation are the minimum necessary to maintain the sustainability of ecosystems, including the human presence, with its agricultural and industrial activities.
One of the functions of forest cover on farms along the waterways, according to the Forest Code, is the reduction of erosion and decrease of sediments deposition in waterways. The study of these erosion processes, involving measurements of all variables involved in a wide scale, is very time-consuming and requires a large amount of financial resources. To assist these studies of predicting the impact of agricultural activities on water quality, GIS hydrologic models are being developed and revised, which are very important and useful, and have a great potential of applicability, since it becomes clear that a model does not replace the measurement and observation of processes in the watershed, in their different scales, being necessary to this the collection of field data (TUCCI, 2005).
Considering the need for more information on the impact of agricultural activities on water quality, this study has been prepared, which aims to analyze the relative reduction in annual soil loss in micro watersheds with different slopes in different size scenarios of Permanent Preservation Areas, and size and location of the Legal Reserve.
MATERIAL AND METHODS
WSCR, after a reclassification of Semi-detailed Pedological Survey of the State of São Paulo (PRADO, 2005) for the first orders of the Brazilian System of Soil Classification (SiBCS) (EMBRAPA, 2006), VALENTE & VETTORAZZI (2008) state that the WSCR has approximately 46% of its area occupied by Ultisols; 30% by Oxisols; 22% by Entisols; 0.56% by Gleysols; 0.41% by Nitosols; and only 0.28% by Chernosols. VALENTE & VETTORAZZI (2008), based on the map of use and land cover produced for the year of 2000, reported that, in the watershed, there are only 11% of native forest and 1.25% of cerrado “lato sensu”, and that the remaining vegetation is highly fragmented. They also show that the pasture represents approximately 44% of land use, and sugar cane accounts for approximately 26% of the total area of the watershed.
It was used the following digital maps of the WSCR which are part of the cartographic database of the GIS Laboratory of the Department of Biosystem Engineering, ESALQ/USP: Contour lines and esteemed points; Hydrography; Soils (first order of SiBCS); Soil use (VALENTE & VETTORAZZI, 2003); Limit of the WSCR; and Micro Watershed Delineation of WSCR.
Using the map of contour lines and esteemed points and IDRISI Kilimanjaro software, the Digital Terrain Model (DTM) of the WSCR was drawn up using the Delaunay Triangulation method. Using the DTM generated, we calculated the slope of each pixel of the map area, and then calculate the average slope (AS) for each micro watershed of the WSCR. For the separation of the micro watershed in three different groups, according to their AS, it was used the following criteria: 1) Micro watershed of mild relief: AS from 0 to 8%; six micro watersheds with slopes around 5% were selected; 2) Micro watershed of intermediary relief: AS from 8 to 20%; six micro watersheds with slopes around 15% were selected; and 3) Micro watershed of sloping relief: AS above 20%; six micro watersheds with slopes around 20% were selected. With these 18 micro watersheds, it was formed the map of division of the selected micro watersheds.
To calculate the soil loss in the selected micro watersheds, it was used the RUSLE (Revised Universal Soil Loss Equation, RENARD et al., 1997), Equation 1. This equation is an update of the USLE (Universal Soil Loss Equation, WISHMEYER & Smith, 1978), where new equations were established for the length of the ramp and slope (L and S factors).
E = R * K * L * S * C * P (1)
In which: E is the annual soil loss, in Mg ha-1 year-1; R is the erosivity of rainfall and runoff associated with it, in MJ mm ha-1 h-1 year-1; K is the soil erodibility in Mg h MJ-1 mm-1); L is the effect of the length of the ramp, dimensionless; S is the effect of slope of the ramp, dimensionless; C is the effect of coverage and soil management, dimensionless; and P is the effect of support conservation practices, dimensionless.
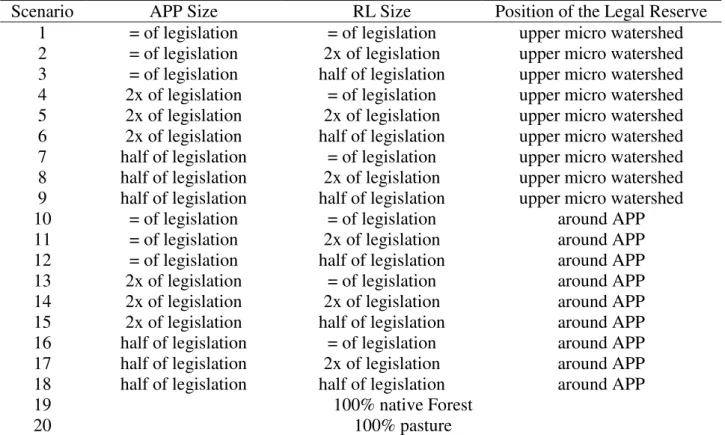
It was created scenarios of land use in order to evaluate the effect of forest cover in reducing soil loss annually. The forest cover used was as provided by law with the following variations: 1) Size of the permanent preservation area (PPA): same of legislation, twice the value of legislation and half the value of legislation; 2) Size of the legal reserve (LR): same of legislation, twice the value of legislation, and half the value of legislation, and 3) Location of LR: in the upper micro watershed and in the lower micro watershed. These criteria were created from the experience of the authors. Table 1 shows all scenarios for estimating sediment yield that were generated for each micro watershed.
TABLE 1. Characteristics of the evaluated scenarios.
Scenario APP Size RL Size Position of the Legal Reserve 1 = of legislation = of legislation upper micro watershed 2 = of legislation 2x of legislation upper micro watershed 3 = of legislation half of legislation upper micro watershed 4 2x of legislation = of legislation upper micro watershed 5 2x of legislation 2x of legislation upper micro watershed 6 2x of legislation half of legislation upper micro watershed 7 half of legislation = of legislation upper micro watershed 8 half of legislation 2x of legislation upper micro watershed 9 half of legislation half of legislation upper micro watershed 10 = of legislation = of legislation around APP 11 = of legislation 2x of legislation around APP 12 = of legislation half of legislation around APP 13 2x of legislation = of legislation around APP 14 2x of legislation 2x of legislation around APP 15 2x of legislation half of legislation around APP 16 half of legislation = of legislation around APP 17 half of legislation 2x of legislation around APP 18 half of legislation half of legislation around APP
19 100% native Forest
20 100% pasture
In order to better compare the effects of different scenarios and the factors (PPA size, size and location of LR), an index was proposed, called Relative Reduction of Annual Soil Loss (RR). This relative reduction is the comparison of how much the scenario reduced the annual soil loss compared with the potential, which was determined by the difference between the annual soil loss produced with the micro watersheds totally covered with grass and they totally covered with native forest. Equation 2 summarizes the methodology for the generation of this index:
1 i F *100
P F
E E
RR
E E
(2)
In which: RR is the relative reduction of the annual soil loss, in %; Ei is the average annual
soil loss (all micro watersheds) for the i-hundredth scenario, in MJ mm ha-1 h-1 year-1; EF is the
average annual soil loss (all micro watersheds) for the scenario where the micro watersheds were considered with 100% native forest, in MJ mm ha-1 h-1 year-1; and EC is the average annual soil loss
(all micro watersheds) for the scenario where the micro watersheds were considered with 100% of pasture, in MJ mm ha-1 h-1 year-1.
For the elaboration of the RR index, it was necessary to determine the maximum reduction potential of soil loss by the difference between the annual soil loss provided in each micro watershed using 100% of native forest and using 100% pasture. For this to be possible, two scenarios were created: 1) considering the entire micro watershed covered with native forest; and 2) considering the entire micro watershed covered with pasture.
From these files, the layers of C and P factors (Table 2) were generated for each scenario of the selected micro watersheds through the reclassification of land use for the values of these factors.
TABLE 2. C and P Factors used.
Soil Use and Cover C Factor P Factor
Native Forest 0.004 0.200
Pasture 0.030 0.500
Source: BERTONI & LOMBARDI NETO (1999)
The soil map of the WSCR in DXF format was imported into Idrisi in vector format, and then converted to raster format (5m pixel). Then, for each selected micro watershed, the reclassification of soil types for values of erodibility (K factor) was made, using the data proposed in BERTONI & LOMBARDI NETO (1999), presented in Table 3.
TABLE 3. Erodibility values used for the soil classes of the study area.
Soil Classes Erodibility (K Factor of RUSLE)
Oxisol 0.0175
Ultisols 0.0350
Nitosols 0.0296
Entisols 0.0296
Gleysols 0.0000
Chernosols 0.0175
Source: Adapted de BERTONI & LOMBARDI NETO (1999)
For the elaboration of the layer of the R factor (rainfall erosivity), first the calculation of rainfall erosivity was made using monthly rainfall data from rainfall stations shown in Table 4, for the years of 1970 to 2007, using the methodology proposed by BERTONI & LOMBARDI NETO (1999). The points with the locations of rainfall stations and their proper erosivity values calculated were imported into Idrisi Kilimanjaro in vector format, and from these a raster file was generated for the R factor of the micro watersheds selected by the interpolation method of the inverse square of the distance.
TABLE 4. Rainfall stations used.
Rainfall Station Localization
CH 012 Rio Claro
CH 014 Itirapina
CH 016 Rio Claro
CH 027 Araras
CH 032 Santa Cruz da Conceição
CH 035 Analândia
CH 036 Itirapina
CH 037 Itirapina
CH 056 Piracicaba
CH 059 Santa Gertrudes
C4-43 Corumbataí
C4-54 Charqueada
C4-60 São Pedro
C4-61 Piracicaba
C4-88 Santa Bárbara D’Oeste
C4-98 Brotas
CH 012 Rio Claro
After creating all the layers (raster files) necessary (C, P, K, R, and DTM factors) for all micro watersheds selected, the RUSLE module from the IDRISI Kilimanjaro software was used to calculate the annual soil loss per pixel, in all micro watersheds for all scenarios. This module automatically produced the layers L and S from the DTM and also the result of annual soil loss of each micro watershed.
RESULTS AND DISCUSSION
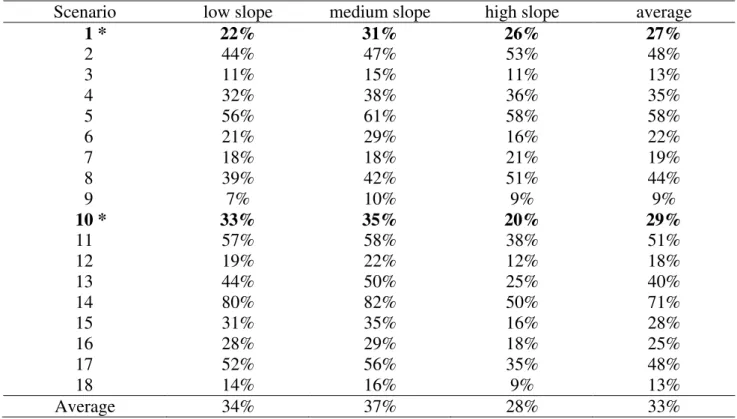
The effects of different scenarios and their factors (PPA size, LR size and location) are analyzed in relation to the values of the relative reduction in average annual soil loss and slope class (Table 5).
TABLE 5. Relative reduction of average annual soil loss for each scenario and slope class. Scenario low slope medium slope high slope average
1 * 22% 31% 26% 27%
2 44% 47% 53% 48%
3 11% 15% 11% 13%
4 32% 38% 36% 35%
5 56% 61% 58% 58%
6 21% 29% 16% 22%
7 18% 18% 21% 19%
8 39% 42% 51% 44%
9 7% 10% 9% 9%
10 * 33% 35% 20% 29%
11 57% 58% 38% 51%
12 19% 22% 12% 18%
13 44% 50% 25% 40%
14 80% 82% 50% 71%
15 31% 35% 16% 28%
16 28% 29% 18% 25%
17 52% 56% 35% 48%
18 14% 16% 9% 13%
Average 34% 37% 28% 33%
(*) scenarios which are in accordance with current legislation
Scenarios 1 and 10, which are in accordance with current legislation, promoted a relative reduction of 26 and 29%, respectively. It is observed that the relative reduction of soil loss of these scenarios presents intermediate values, reaching less than 30% of the potential reduction of soil loss that would be possible in a micro watershed.
Scenarios 5 and 14, which, considering the factors described in Table 1, have the largest area of forest cover, showed the highest values, 58 and 71%, respectively, while the scenarios 9 and 18, which has the smallest area of forest cover, showed the lowest values, 9 and 13%, respectively. This tendency of lower annual soil losses in scenarios with larger areas of native forest was expected due to differences in the values of the C factor used in the two land uses analyzed (Table 2).
The summary of the results of relative reduction obtained (Table 5) was prepared by slope class and by factor studied (PPA size, and LR size and location).
TABLE 5. Relative reduction of average annual soil loss by slope class for each analyzed scenario. Relative reduction of average annual soil loss (%)
Analyzed factor Low Slope Medium Slope High Slope
PPA = legislation 31 35 27
PPA = twice of legislation 44 49 34 PPA = half of legislation 26 28 24
LR = legislation 29 55 17
LR = twice of legislation 33 58 21
LR = half of legislation 24 48 12
upper LR 28 32 31
lower LR 40 43 24
Average 34 37 28
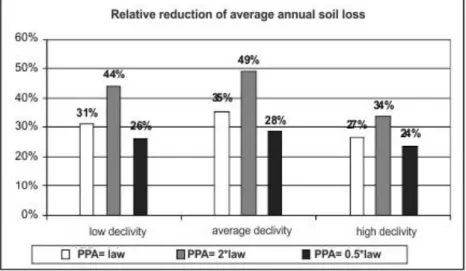
The relative reduction of average annual soil loss by PPA size and by each slope class is shown in Figure 1.
FIGURE 1. Relative reduction of average annual soil loss by PPA size scenarios for each slope class.
For the low slope class when the PPA size was equal to or half of the one defined in the legislation, the average values of the relative reduction of the annual soil loss were very close, 31 and 26%, respectively, while for the PPA twice the value of legislation the average reduction was 44%. However, for the high slope class there was a different behavior, because when the PPA was equal to or half of the one defined in the legislation, the average values of the relative reduction of the annual soil loss were also very close, 27 and 24%, respectively, but for the PPA twice the value of legislation the average reduction was 34%.
This indicates that the effect of the PPA size on the relative reduction in the annual soil loss varies depending on the slope class of the micro watershed, or rather, varies largely depending on the value of the S factor (slope).
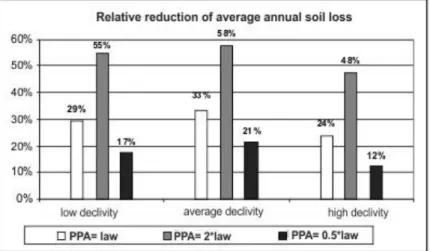
The relative reduction of average annual soil loss by LR size and for each slope class is shown in Figure 2.
FIGURE 2. Relative reduction of average annual soil loss by RL size scenarios for each slope class.
As the results for the effect of the PPA size, the results of the relative reduction of soil loss for the effect of the LR size show that the larger the area of native forest, the greater this relative reduction. It was also observed that at high slopes, the effect of the higher S factor causes smaller relative reductions.
The relative reduction of average annual soil loss by LR location and by each slope class is shown in Figure 3.
FIGURE 3. Relative reduction of average annual soil loss by LR location scenarios for each slope class.
In micro watersheds with low and medium slopes, it was observed that when the LR is located in the lower micro watershed, i.e., around the PPA, it has a relative reduction in annual soil loss greater than with the LR in its upper part. This is just not observed in the micro watersheds with high slope class, where the result was reversed due to the occurrence of very large values of C factor in the upper part of these watersheds.
Several authors (MOSTER, 2007; GURNELL & PETTS, 2006; LIMA et al., 2006; LIMA & ZAKIA, 2006; ATTANASIO et al., 2006) show the importance of maintaining a forest cover around the water courses greater than required by the current legislation for the PPA, for the protection of the entire riparian zone. The relative reduction of annual soil loss presented (Figure 3) agrees with these authors, when the average slope of the micro watershed is up to 20%.
would bring a greater sediment removal than is provided by the width required by legislation (30 m).
However, as the areas close to watercourses generally have lower slopes than the remaining areas of the watershed, this result is not confirming those of MACHADO et al. (2003) and MORO (2005), because according to these authors the allocation of forest cover in areas of highest slope would bring greater reductions in sediment formation.
The inversion of the result for the micro watersheds with high slope class is related to configuration of those, for when the LR is in the low part, areas without forest cover are more associated with sloping ramps, which is not true for the other micro watersheds, this was also observed by ZOLINE (2010).
Regarding the position of LR, and considering the great variability of relief of WSCR, the results show that one cannot adopt a single strategy to maximize the relative reduction in annual erosion throughout the entire watershed, but instead allocate this LR around the PPA when the micro watershed has an average slope less than 20%, and allocate in the upper part when the micro watershed has more than 20% average slope.
CONCLUSIONS
The use of GIS environment to study the effect of different scenarios of land cover on sediment yield using the RUSLE is necessary and crucial.
The effect of forest cover in reducing soil loss varies annually according to the average slope of the micro watershed.
The implementation of current legislation on the PPAs and LR provided a reduction of less than 30% of the potential reduction in annual soil loss that can exist on a micro watershed.
The PPA width should be determined taking into account the slope of the micro watershed, and the LR should be located along the PPA, in micro watersheds with average slopes below 20%, and located in the upper part when this slope is greater, because these features bring better effects on reducing annual soil loss.
ACKNOWLEDGEMENT
To the Coordination for the Improvement of Higher Level Personnel - CAPES - for the scholarship granting.
REFERENCES
A9 TECH. A9CAD. Disponível em: <http://www.a9tech.com>. Acesso em: 2 fev. 2009. ATTANASIO, C.M.; LIMA, W.P.; GANDOLFI, S.; ZAKIA, M. J. B.; VERIZIANI JR., C.T. Método para a identificação da zona ripária: microbacia hidrográfica do Ribeirão São João (Mineiros do Tietê, SP). Scientia Forestalis, Piracicaba, v.71, p.131-140, 2006.
BARBOSA, A. O desmatamento no Brasil: uma questão histórica.2009. Disponível em: <http://www.brasilescola.com/brasil/o-desmatamento-no-brasil-uma-questao- historica.htm>. Acesso em: 15 abr. 2009.
BERTONI, J.; LOMBARDI NETO, F. Conservação do solo. São Paulo: Ícone, 1999. 355 p. EMBRAPA - EMPRESA BRASILEIRA DE PESQUISA AGROPECUÁRIA. Centro Nacional de Pesquisa de Solos. Sistema brasileiro de classificação de solos. Brasília, 2006. 412 p.
KOFFLER, N.F. Uso das terras da bacia do Rio Corumbataí em 1990. Geografia, Rio Claro, v.18, n.1, p.135-150, 1993.
LIMA, W.P.; RIGHETTO, A.M.; FERRAZ, F.F. B.; ZAKIA, M.J.B. Delimitação da zona ripária em uma microbacia. In: LIMA, W.P.; ZAKIA, M.J.B. (Org.). As florestas plantadas e a água: implementando o conceito da microbacia hidrográfica como unidade de planejamento. São Carlos: Rima, 2006. v.1, p.89-106.
LIMA, W.P.; ZÁKIA, M.J.B . O papel do ecossistema ripário. In: LIMA, W.P.; ZAKIA, M.J.B. (Org.). As florestas plantadas e a água: implementando o conceito da microbacia hidrográfica como unidade de planejamento. São Carlos: Rima Editora, 2006. v.1, p.77-88.
MACHADO, R.E.; VETTORAZZI, C.A.; CRUCIANI, D.E. Simulação de escoamento em uma microbacia hidrográfica utilizando técnicas de modelagem e geoprocessamento. Revista Brasileira de Recursos Hídricos, Porto Alegre, v.8, n.1, p.147-155, 2003.
MORO, M.A. Utilização da interface SWAT-SIG no estudo da produção de sedimentos e do volume de escoamento superficial com simulação de cenários alternativos. 2005. 100 f. Dissertação
(Mestrado em Irrigação e Drenagem) - Escola Superior de Agricultura “Luiz de Queiroz”, Universidade de São Paulo, Piracicaba, 2005.
MOSTER, C. Avaliação hidrológica da zona ripária através da análise da água subterrânea ao longo das vertentes de uma microbacia experimental. 2007. 82 f. Dissertação (Mestrado em Recursos Florestais) - Escola Superior de Agricultura “Luiz de Queiroz”, Universidade de São Paulo, Piracicaba, 2007.
PRADO, H. Solos do Brasil:gênese, morfologia, classificação, levantamento, manejo. 4.ed. Piracicaba: ESALQ, 2005. 281 p.
RENARD, K.G.; FORSTER, G.R.; WEESIES, G.A.; McCOOL, D.K.; YODER, D.C. Predicting soil erosion by water: a guide to conservation, planning with the revised universal soil loss equation (RUSLE). Washington: USDA, ARS, 1997. p.2-18, (Agriculture Handbook, 703). ROCHA, A.A.; FELDMANN, F.J. A Mata Atlântica é aqui. E daí? História e luta da Fundação SOS Mata Atlântica. São Paulo: Terra Virgem, 2006. 176 p.
SPAROVEK, G.; RANIERI, S.B.L.; GASSNER, A.; DE MARIA, I.C.; SCHNUG, E.; DOS SANTOS, R.F.; JOUBERT, A. A conceptual framework for the definition of the optimal width of riparian forests. Agricultural, Ecosystems and Environment, Amsterdam, v.90, p.169-175, 2002. TUCCI, C.E.M. Modelos hidrológicos. 2.ed. PortoAlegre: Editora da UFRGS, 2005. 678 p.
VALENTE, R.O.A.; VETTORAZZI, C.A. Mapeamento do uso e cobertura do solo na bacia do Rio Corumbataí, SP. Piracicaba: IPEF, 2003. 9 p. (Circular Técnica, 196).
VALENTE, R.O.A.; VETTORAZZI, C.A. Definition of priority areas for forest conservation through the Ordered Weighted Averaging Method. Forest Ecology and Management, v.256, p.1408-1417, 2008.
WEILL, M.A.M.; SPAROVEK, G. Estudo da perda de solo na Microbacia do Ceveiro (Piracicaba, SP). I- Estimativa das taxas de perda de solo e estudo de sensibilidade dos fatores do modelo EUPS. Revista Brasileira de Ciência do Solo, Viçosa-MG, v.32, p.801-814, 2008.
WISCHMEIER, W.H.; SMITH, D.D. Predicting rainfall erosion losses: a guide to conservation planning. Washington: USDA, 1978. 58 p. (Agriculture Handbook, 537).
ZOLIN, C.A.Análise e otimização de projetos de pagamentos por serviços ambientais (PSA) utilizando sistemas de informações geográficas (SIG) - o caso do município de Extrema, MG.2010. 128 f. Tese (Doutorado em Irrigação e Drenagem) - Escola Superior de Agricultura “Luiz de