ISSN 1546-9239
© Science Publications, 2005
Corresponding Author: CAI Chong-Fa, Huazhong Agricultural University, Wuhan 430070 (China) E-mail:cfcai@mail.hzau.edu.cn
Application of Geo-Information Technology in the Study of Soil
and Nutrients Loss by Water Erosion for three Different Land Cover
1, 2
Mushtak T. Jabbar,
1C.A.I. Chong-Fa,
1Shi Zhi-Hua and
1Wang Tian-Wei
1Huazhong Agricultural University, Wuhan 430070 (China)
2Department of soil and water, college of agriculture, University of Basrah (Iraq)
Abstract: This research integrated the Revised Universal Soil Loss Equation (RUSLE) and the soil statistical analysis with RS and GIS techniques to quantify soil and nutrient loss risk. The Letianxi watershed, located in the southwest part of Hubei Province of China was taken as a case. A system was established for rating soil erodibility, slope length/gradient, rainfall erosivity and conservation practices. The rating values serve as inputs into a Revised Universal Soil Loss Equation (RUSLE) to calculate the risk for soil degradation processes, namely soil water erosion. Two Landsat TM senses in 1997 and ETM 2002, respectively, were used to produce land use/cover maps of the study area based on the maximum likelihood classification method. These maps were then used to generate the conservation practice factor in the RUSLE. In order to assess the effect of land cover and landscape position on soil nutrient consisting of Soil Organic Mater (SOM), Total N (TN), Total P (TP) and Total K (TK), soil samples were collected from the top to foot of hill slope in the study area. The three categories consisted of a typical land cover structure for each polygon in the study area: Soil under forest cover (T1), soil under agriculture crops cover (T2) and soil under no vegetation cover (T3). Annual loss of total N (8.24 kg ha1), total P (5.88 kg ha1) and total K (6.98 kg ha1), per unit loss of soil (t ha1), was maximum from the soil under no vegetation cover (T3). The loss of total N ranged between 5.30 and 32.27 kg ha1, total P ranged between 2.14 and 12.42 kg ha1, total K ranged from 2.12 to 10.31 kg ha-1 whereas organic matter loss varied between 10.65 and 236.16 kg ha-1, from three different land covers. ERmapper and Arc/Info software were used to manage and manipulate thematic data, to process satellite images and tabular data source. Results showed that 110.72 km2 (27.09%) was exposed to very slight soil loss and 227.01 km2 (55.55%) was exposed to slight soil loss. This study demonstrates the effectiveness of Geo-information technology in generating a soil and nutrient loss map.
Key words: Soil and Nutrient Loss, RUSLE, RS and GIS Technology
INTRODUCTION
Soil and nutrient loss has been identified as an important factor controlling net primary productivity[2]. Therefore, characterizing special variability and distribution of soil and nutrient loss in relation to site characteristics including climate, land cover, landscape position and other variables is critical for predicting the rates of ecosystem processes[3], understanding how ecosystems work[4] and assessing the effects of future land cover change on nutrients[1].
Land cover is an Integrator of several environmental attributes which influence nutrients export[5]. Land cover and soil management practices influence the soil nutrient related soil processes, such as erosion, oxidation, mineralization and leaching, etc.[6] and consequently modify the processes of transport and re-distribution of nutrients. In non cultivated land uses, the type of vegetative cover is a factor influencing the soil organic matter content[7]. Moreover, soils, through
land cover change, also produce considerable alterations[8] and usually diminish soil quality after the cultivation of previously untilled soils[9]. Thus, land cover and type of vegetation must be taken into account when relating soil nutrient with environmental conditions[6].
pressure for more land have accelerated the rate of soil erosion on sloping lands[11]. The objectives of this study are to assessment soil loss by using Geographic Information System and Remote Sensing technology and to determine the effect of land cover on soil nutrient loss include Soil Organic Mater (SOM), Total N (TN), Total P (TP) and Total K (TK) in the Letianxi watershed, located in the Three Gorges Area in Hubei Province of China.
MATERIALS AND METHODS
Materials: The study area, located in the southwest part of Hubei province, lies within longitude E 110° 54′to 111° 08′and from latitude N 30° 50′ to 31° 10′ and has a total area of 408.62 km2 (Fig. 1). Present population density averages 74 persons km2. The area is situated between the Three Gorges dam and the Guozhouban dam location in a subtropical zone with a monsoonal climate. The mean annual precipitation is 900--1 500 mm, that occurs between May and September and the annual average temperature is 14--18°C. The landform is gentle in the location area, with the elevation ranging from 497 to 1 800 m. The land surface is mainly yellow red soil derived from granite and sandy shale which are classified into Ultisols, based on the soil Taxonomy of the U.S.D.A, (Soil Survey Staff, 1999). All the five thematic layers are generated in the GIS environment at a scale of 1:50 000. The images were acquired in September, 1997 and in September, 2002. The software used for this study was Arc/Info, Erdas and ERmapper imagine.
Methods: RS and GIS Data Processing: Landsat TM and Landsat ETM images from 1997 and 2002 were used to study the location. In order to perform the geometric correction of the image, several ground control point coordinates had to be collected. The ARC EDIT program was used to collect the location of these points from the layer of irrigation and drainage channels and roads. Erdas software was used for geometric correction of the images. The live-link model between ARC/INFO and Erdas was used to match the image and the thematic map layers. More information was collected or calculated and entered into the GIS system. The ARC/INFO and ArcView system is capable of using different information layers for different purposes. The principle thematic layer is the soil map where, all other information is related to its soil polygons. A master tic file was created, with 30 tic points, for geometric correction. The coordinates were converted to the Universal Transverse Mercator (UTM) system using the ARC/INFO software. ARCEDIT was used to edit each information layer and to assign attributes to each polygon. The Table program was also used to assign additional attributes to soil polygon. Other information layers were transferred from Erdas software to the ARC/INFO system. The JOINITEM function of “TABLES” program was used to have all needed attributes in one Polygon attributes table. A
calculation function was used to compute the Revised Universal Soil Loss Equation (RUSLE) for soil erosion processes. The ARC PLOT program was used to plot maps of soil erosion risk. Erdas software was used to classify and compute the (NDVI). ISO-clustering classification technique was used to classify the (NDVI) image into six vegetation density classes (i.e. 0-10%, 10-20%, 20-40%, 40-60%, 60-80% and 80-100%). The classified image file was converted to ARC/INFO vector format to produce nine polygons (Fig. 2)[12].
Field Work and Laboratory Studies: Nine polygons were chosen for taking the soil samples for the study of the Letianxi watershed, located in the southwest part of Hubei Province of through the fieldwork (Fig. 1). Four typical randomized samples were taken from the top to foot of hill slope for each polygon by using a manual tool to pluck out the aggregates without agitating it from the soil surface layer and then placed in cans and taken to the laboratory for analysis.
Fig. 1: General Location of Study Area in the (Letianxi Watershed) of South Hubei Province
Table 1: Some Chemical and Physical Properties of Soil and their Average Value of the Polygons in Study Area Physical and
Chemical Properties Polygons (ID number
Soil particle 1 2 3 4 5 6 7 8 9
Sand (gm Kg1) 578.7 670.7 488.9 718.9 734.1 475.2 471.8 307.7 710.9 Silt (gm Kg1) 240.4 188.5 340.2 180.8 161.3 344.4 349.3 460.6 188.7 Clay (gm Kg1) 180.9 140.8 170.9 100.5 95.6 180.4 178.9 231.7 100.4
Texture Loamy Sandy Loam Sandy Sandy Loam Loam Silty Sandy
Sand Loam Loam Loam Loam Loam
Bulk density (g cm1) 1.589 1.592 1.385 1.469 1.422 1.382 1.371 1.315 1.425
pH 5.65 5.54 5.45 5.28 5.45 5.86 5.72 5.69 5.91
O.M (gm Kg1) 1.92 1.97 0.74 0.47 0.41 0.49 1.91 1.89 0.72
EC (dsm1) 0.006 0.005 0.006 0.005 0.005 0.004 0.006 0.004 0.008
Total N% 0. 152 0.161 0.048 0.033 0.04 0.035 0.188 0.113 0.056
Total P% 0. 028 0.035 0.011 0.006 0.017 0.011 0.069 0.043 0.015
Total K% 1. 782 1.617 0.612 2.762 2.181 2.663 1.929 3.118 2.301
Note: 1-Soil particle size: Sand 2-0.05 mm; Silt 0.05-0.005mm; Clay <0.005 mm 2-Analytical method: Soil texture: hydrometer method; Aggregate size: sieve method 3-Analytical method: O.M: K2Cr2O7+H2SO4 → FeSO4 titration; HCl → NaOH titration
A total 36 sample point was selected based on three categories of land cover. Important physical and chemical properties of the soils were listed in (Table 1) by the procedures of Black et al.,[13]. An extensive field survey was performed throughout the Letianxi watershed using Global Positioning System (GPS) Garmin receiver equipment. The GPS has developed into an efficient GIS data collection technology, that allows for users to compile their own data sets directly from the field as part of ‘ground truthing’. The spatial data were digitized from the topographic maps of the study areas by using Arc/view GIS version 3.2a and then the vegetation density attribute data were edited and added to the study databases. The polygons and their attributes were connected with uniform code. Value for average meteorological data were obtained for the investigated location according to information recorded during the period 1997- 2002 from the meteorological station. The present methodology is based upon such parametric models. The Revised Universal Soil Loss Equation (RUSLE) was adopted for the assessment of soil erosion.
Assigning Environmental Factors for Each Soil Polygon: Numerical values were assigned to each soil polygon in the polygon attribute table of the soil coverage layer. The form of the (RUSLE) is:
A= F (K*R*LS*C*P) (1)
where, A is the soil loss in t ha1 y1 ; F is the function; K is the soil erodibility factor (t. ha. h. ha1. mJ1. mm1); R is the rainfall-runoff erosivity factor in MJ mm ha1 h1; L is the slope length factors; S is the slope steepness factor; C is the cover and management factor; and P is the conservation practice factor.
The values of the variable are chosen in such a way that the solving of the equation gives a numerical indication of the degradation rate. This indication is expressed as soil loss in t/h/year for soil water erosion. The formula describes the processes only approximately and the values assigned to each factor are approximate in the present state of knowledge. These values merely give an approximate indication of the magnitude of degradation[14]. The values were chosen according to the following parameters.
Soil Erodibility Factor (K): The K values were usually estimated using the soil-erodibility nomograph method[15]. This method uses % clay, % silt (0.002mm – 0.1 mm), % sand (0.1mm- 2mm) and % carbon and soil structure and permeability class to calculate K. However, there is a lack of structure and permeability class data in the soil survey data source. Therefore, we adapted following equation, which is recommended by RUSLE when lacking observation data. The soil erodibility factor was estimated using the equation of William and Renard[16] which is:
K = {0.2 + 0.3 exp [- 0.0256 Sd (1 - S i/100)]} × [Si / (C l + S i)] 0.3
× {1.0 - 0.25 C / [C + exp (3.72 - 2.95 C)]} (2) × [1.0 - 0.7 (1 - S d /100)] /
{1 - S d /100 + exp [- 5.51 + 22.9 (1 - S d /100)]}
where, K, soil erodibility factor (t. ha. h. ha1. mJ1. mm1); Sd, Sand (%); Si, Silt (%); C l, Clay (%); and C, Carbon (%).
is the process of erosion on barren soil surfaces. The rainfall database obtained from the meteorological office in Letianxi watershed, located in the southwest part of Hubei Province includes the rainfall data for the years 1997 and 2002. Rainfall erosivity was determined by following relationship[17]:
2
12
1.5Logpi / p 0.8188
i 1
R 1.735 10 −
=
=∑ × (3)
where, Pi is the monthly amount of precipitation and P is the annual precipitation
Topographic Factors (LS): The LS factor was limited of slope ≤ 18% because the data used to develop RUSLE involved slopes up to 18 percent only. However, the study area has 43% of its slope gradient in excess of 30%. Liu et al.[18] employed data from three sites in China with slopes up to 57.7% and reported that the relationship between slope length and soil loss was well approximated by the USLE for computing the L-factor was adopted in this study, i. e. L-factor was described follow:
L= λ( / 22.13)m (4)
where: m is an exponent that depends on slope steepness, being 0.5 for slope exceeding 5 percent, 0.4 to 4 percent slopes and 0.3 for slopes less than 3%.
To describe the influence of slope steepness, Nearing[19] produce a single continuous function for S:
s 1.5 2.3 6.1sin17
1 e − θ
= − +
+ (5)
where θ is the slope angle (degrees).
In order to utilize DEM is calculating LS factor, a program USLE2D.EXE, which is designed to calculate the LS-factor in the RUSLE from a grid-based DEM and provided the user with a number of options in selecting the hydrological flow routing algorithm and the LS algorithm[20] was used to compute LS factor.
Table 2: C-Factor Value for Different Classes
Land use/cover class RUSEL-H factor average value
Forest 0.003
Bush and Grasslands 0.01
Weak vegetation 0. 60
Sparse vegetation 0. 90
Barren soil 1. 0
Urban areas 0. 0001
Crop lands 0. 40
Sand dunes 1.0
Sand lands 1. 0
Water bodies 0. 0001
Cover and Management Factor (C): The classified land cover map was converted to the C factor layer in RUSLE through reclassification of each land cover type in its corresponding C factor value, which estimated from RUSLE guide tables[15]. (Table 2) lists the C-factor values for the land use categories. These values were used to re-classify the land cover map to obtain the C-factor for each polygon in the study area. While the RUSLE P-factor reflects the impact of support practices dealing with the average annual erosion rate. It is the ratio of soil loss with contouring and/or strip cropping to that with straight row farming up-and-down the slope. As with the other factors, the P-factor differentiates between cropland and rangeland or permanent pasture. As the study of this research work to estimate soil degradation using RUSLE modeling was applied in the area of non-agriculture or on natural (geological) erosion, it was considered that there was no conservation practice (P) in non-agricultural areas. Therefore as the conservation practice factor (P) value ranges from 0.0-1.0 and the highest value is assigned to areas with no conservation practice, the maximum value for P, which is 1.0, is assigned to this research work area.
Statistical Analysis: Statistical analyses were performed to test the influence of land cover and soil nutrients using one- way ANOVA and mean comparisons were made using the least significant difference (LSD) method with p<0.05. The independent variables used in this study were land cover types and slope aspects. The significance of both of their interactive effect was identified using GLM-MANOVA. All the analyses were conducted through the SPSS program[21].
RESULTS AND DISCUSSION
Table 3: Average Value of Soil Loss by Water Erosion and Input Parameters for their Computation for three Different Land Covers for each Polygon
K R Soil Loss Water
ID LC (t*h/(MJ* mm)) y MJ* mm/(ha* h) LS C and P (t ha1. yr1) Erosion Grade
1 T1*1 0.118 423.5 1.077 0.011 0.592 V. slight
T2 0. 125 423.5 1.084 0.011 0.631 V. slight
T3 0. 124 423.5 1.095 0.031 1.788 V. slight
2 T1 0.146 423.5 1.409 0.034 2.962 V. slight
T2 0. 159 423.5 1.458 0.048 4.712 V. slight
T3 0.177 423.5 1.574 0.087 10.264 Slight
3 T1 0.236 423.5 1.035 0.072 7.447 Slight
T2 0.238 423.5 1.038 0.072 7.532 Slight
T3 0.239 423.5 1.038 0.072 7.564 Slight
4 T1 0.141 423.5 1.127 0.037 2.489 V. slight
T2 0.142 423.5 1.127 0.054 3.659 V. slight
T3 0.145 423.5 1.127 0.057 3.959 V. slight
5 T1 0.139 423.5 1.132 0.056 3.731 V. slight
T2 0.145 423.5 1.116 0.056 3.837 V. slight
T3 0.145 423.5 1.134 0.056 3.899 V. slight
6 T1 0.196 423.5 1.023 0.055 4.670 V. slight
T2 0.228 423.5 1.033 0.069 6.662 Slight
T3 0.250 423.5 1.033 0.092 10.061 Slight
7 T1 0.227 423.5 1.540 0.119 17.617 Moderate
T2 0.231 423.5 1.540 0.113 17.024 Moderate
T3 0.239 423.5 1.540 0.216 33.669 High
8 T1 0.231 423.5 1.463 0.162 23.185 Moderate
T2 0.238 423.5 1.471 0.162 24.019 Moderate
T3 0.252 423.5 1.479 0.162 25.570 Moderate
9 T1 0.164 423.5 1.011 0.055 3.861 V. slight
T2 0.161 423.5 1.011 0.069 4.704 V. slight
T3 0.168 423.5 1.011 0.088 6.329 Slight
Numeric range (t ha1. yr1): V. slight (0-5), Slight (5-10), Moderate (10-30), High (30-80) and V. high (>80)
*1
(T1) soil nutrients under forest cover, (T2) soil nutrients under Agriculture crops cover and (T3) soil nutrients under no vegetation cover
Fig. 3: Risk of Soil Water Erosion in the Location Study
Also, rugged topographic steep slopes and dissected landscape concentrate runoff.
MANOVA results indicated that significant differences in T1, T2 and T3 for soil loss (Table 4). The low value of soil loss in T1 and T2 for each polygon is partly because of the soil under forest and crops cover and their rooting characteristics and partly because of the protection of the soil surface from raindrop impact by the plant canopy[22]. Forest offers better ground protection than crops. Their cover develops faster than crop area and it is larger to the ground surface cover. The best protection against erosion was attained by intercropping chestnuts (Castanea mollissima Bl) and tea (Camellia sinensis O. Ktze.).
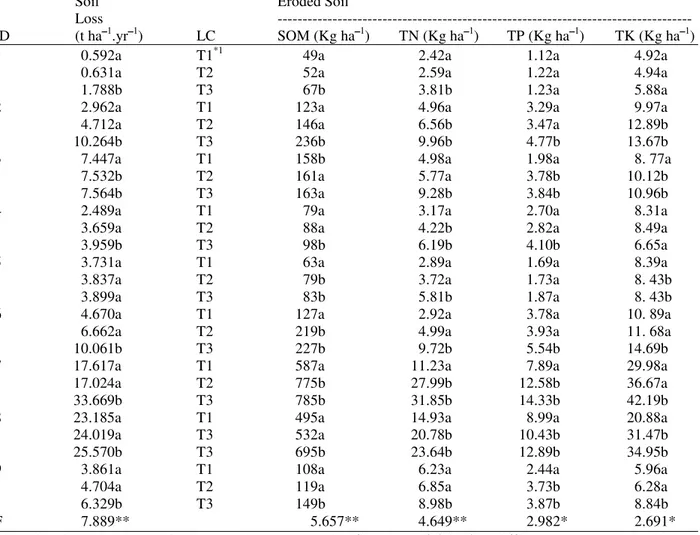
Table 4: Soil Nutrient Losses as a Result of Soil Loss
Soil Eroded Soil
Loss --- ID (t ha1.yr1) LC SOM (Kg ha1) TN (Kg ha1) TP (Kg ha1) TK (Kg ha1)
1 0.592a T1*1 49a 2.42a 1.12a 4.92a
0.631a T2 52a 2.59a 1.22a 4.94a
1.788b T3 67b 3.81b 1.23a 5.88a
2 2.962a T1 123a 4.96a 3.29a 9.97a
4.712a T2 146a 6.56b 3.47a 12.89b
10.264b T3 236b 9.96b 4.77b 13.67b
3 7.447a T1 158b 4.98a 1.98a 8. 77a
7.532b T2 161a 5.77a 3.78b 10.12b
7.564b T3 163a 9.28b 3.84b 10.96b
4 2.489a T1 79a 3.17a 2.70a 8.31a
3.659a T2 88a 4.22b 2.82a 8.49a
3.959b T3 98b 6.19b 4.10b 6.65a
5 3.731a T1 63a 2.89a 1.69a 8.39a
3.837a T2 79b 3.72a 1.73a 8. 43b
3.899a T3 83b 5.81b 1.87a 8. 43b
6 4.670a T1 127a 2.92a 3.78a 10. 89a
6.662a T2 219b 4.99a 3.93a 11. 68a
10.061b T3 227b 9.72b 5.54b 14.69b
7 17.617a T1 587a 11.23a 7.89a 29.98a
17.024a T2 775b 27.99b 12.58b 36.67a
33.669b T3 785b 31.85b 14.33b 42.19b
8 23.185a T1 495a 14.93a 8.99a 20.88a
24.019a T3 532a 20.78b 10.43b 31.47b
25.570b T3 695b 23.64b 12.89b 34.95b
9 3.861a T1 108a 6.23a 2.44a 5.96a
4.704a T2 119a 6.85a 3.73b 6.28a
6.329b T3 149b 8.98b 3.87b 8.84b
F 7.889** 5.657** 4.649** 2.982* 2.691*
The values in each column with the same letter are not significantly (p<0.05, LSD) different among eroded soil
*1
(T1) soil nutrients under forest cover, (T2) soil nutrients under Agriculture crops cover and (T3) soil nutrients under no vegetation cover
Soil Loss-Nutrient Loss Relationship: Soil Organic Matter (SOM), TN and TP were more important than TK (Table 4), the reason being the greater SOM and TN content of soil at study site (Table 1). Both TN and TP are essential for plant growth and hence their loss from runoff and erosion is detrimental to agricultural production, especially where fertilizers are unavailable or too expensive. The study soil contained very little TP because the P was fixed and absorbed in the low pH soil[23] so, an increase of the soil pH would raise the availability of P for plants. Despite these possible improvements, the reduction of soil erosion probably remains the most effective short-term solution to minimize P losses. Another important aspect of P loss from agricultural land by runoff and soil erosion is the eutrophication of surface water[23]. In absolute terms, relatively large values of loss of total N are associated with the T3 because of high values of soil loss here. Regression relationships between total N and soil loss are also derived and listed in (Table 4). Relatively higher R2 values obtained for these may be noted. The values of loss of total N per unit loss of soil (i.e. Slope
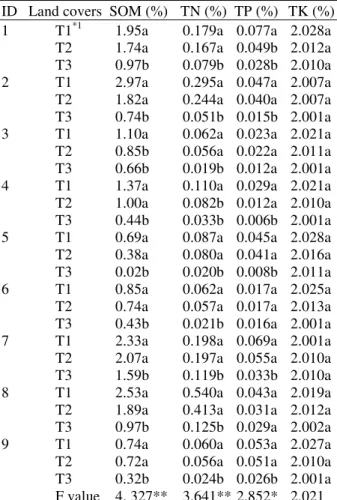
Table 5: Comparisons of Soil Nutrients Change for the three Lands Cover Type
ID Land covers SOM (%) TN (%) TP (%) TK (%) 1 T1*1 1.95a 0.179a 0.077a 2.028a
T2 1.74a 0.167a 0.049b 2.012a T3 0.97b 0.079b 0.028b 2.010a 2 T1 2.97a 0.295a 0.047a 2.007a T2 1.82a 0.244a 0.040a 2.007a T3 0.74b 0.051b 0.015b 2.001a 3 T1 1.10a 0.062a 0.023a 2.021a T2 0.85b 0.056a 0.022a 2.011a T3 0.66b 0.019b 0.012a 2.001a 4 T1 1.37a 0.110a 0.029a 2.021a T2 1.00a 0.082b 0.012a 2.010a T3 0.44b 0.033b 0.006b 2.001a 5 T1 0.69a 0.087a 0.045a 2.028a T2 0.38a 0.080a 0.041a 2.016a T3 0.02b 0.020b 0.008b 2.011a 6 T1 0.85a 0.062a 0.017a 2.025a T2 0.74a 0.057a 0.017a 2.013a T3 0.43b 0.021b 0.016a 2.001a 7 T1 2.33a 0.198a 0.069a 2.001a T2 2.07a 0.197a 0.055a 2.010a T3 1.59b 0.119b 0.033b 2.010a 8 T1 2.53a 0.540a 0.043a 2.019a T2 1.89a 0.413a 0.031a 2.012a T3 0.97b 0.125b 0.029a 2.002a 9 T1 0.74a 0.060a 0.053a 2.027a T2 0.72a 0.056a 0.051a 2.010a T3 0.32b 0.024b 0.026b 2.001a F value 4. 327** 3.641** 2.852* 2.021 The values in each column with the same letter are not significantly (p<0.05, LSD) different among land covers
*, ** Significant at the 0.05 and 0.01 levels, respectively
*1
(T1) soil nutrients under forest cover, (T2) soil nutrients under Agriculture crops cover and (T3) soil nutrients under no vegetation cover
However, the study also showed that the correct choice of agricultural crops offers an effective means to reduce soil and nutrient losses.
Soil Nutrients Losses and Land Cover: The soil nutrients to the location study area differed considerably in SOM, TN, TP and TK (Table 5), the higher SOM and TN contents occurred in soil nutrients under forest cover (T1) and soil nutrients under agriculture crops cover (T2) areas than those under no vegetation cover (T3). Their highest values corresponded to woodland, shrub land and grassland in vegetation cover areas. The results indicate that soil erosion decreases soil nutrient levels, as has been noted by many authors[25]. There were statistically significant differences in SOM and TN among the three land cover types (Table 5). The mean SOM content varied between 0.32 and 2.97%. Multiple comparisons of SOM
revealed that the SOM level under forest cover and agriculture crops cover was significantly higher compared to under no vegetation cover. Averages of TN (0.024- 0.295%) displayed similar patterns to SOM for multiple comparisons. This similarity may be related to SOM influencing nutrient retention and supply (Brubaker et al., 1993). Mean TP and TK content did not show a marked difference among land covers. High values for TP tended to occur in the orchard and intercropping land with fruit trees. Therefore, differences in soil erosion control of land cover[26] in such an erosion risky area[27], may contribute to the significant differences in nutrients for no vegetation cover and vegetation cover areas. In addition, a combination of lower SOM inputs because of less SOM return on land cover, increased aeration by tillage and crop residue collecting partly causes the reduction of TN in cultivated soils[28]. Unlike SOM and TN there was no significant difference for TP and TK among these land cover. TP content with a narrow range within 0.05 and no differences among land cover may be due to the fact that most of the P is held very firmly in the crystal lattices of largely insoluble forms, such as various CA, Fe and AlPO4-and also is chemically bonded to the surface of clay minerals[28]. The high TP content, however, tended to exist in land covers with soil under forest cover. Similar patterns were observed in the three land cover sampling (Table 5).
CONCLUSION
This study assessed the effects of land cover on soil and nutrient loss. Significant differences among land cover were found for most soil nutrients. Soil Organic Matter and TN contents had the higher levels in the forest and crop land than those with no vegetation cover land, while no marked differences in TP and TK occurred among land covers. The soil loss analysis indicated that soil status would suffer from very slight to slight deterioration when the woodland is exploited for agriculture. Under the present land cover management and climate conditions of the study area, the lands with no vegetation cover lands must be abandoned before soil organic matter content is depleted to a the critical value of 0.389% because at that level it is too low to sustain economic yield of crops and erosional processes may be very active resulting in further degradation. The land covers and landscape position resulted in more complex patterns of soil nutrient distribution. Because of the complex nature of soil nutrient patterns largely depending on the land covers and landscape positions, additional research is needed in order to more fully understand the interactive relationships among landscape position, soil erosion, soil nutrient, land cover and its history and management.
ACKNOWLEDGMENT
authors wish to acknowledge Yuling Soil and Water Conservation Bureau for assistance provided in the field survey.
REFERENCE
1. Kosmas, C., S. Gerontidis and M. Marathianou, 2000. The effect of land use change on soils and vegetation over various lithological formations on Lesvos, Catena, Greece, 40: 51-68.
2. Seastedt, T.R., J.M. Briggs and D.J. Gibson, 1991. Controls of nitrogen limitation in Tallgrass prairie. Oecologia, 87: 72-79.
3. Schimel, D.S., T.G.F. Kittel, A.K. Knapp, T.R. Seastedt, W.J. Parton and V.B. Brown, 1991. Physiological interactions along resource gradients in Tallgrass prairie. Ecology, 72: 672-684.
4. Townsend, A.R., P.M. Vitousek and S.E. Trumbore, 1995. Soil organic matter dynamics along gradients in temperature and land use on the island of Hawaii. Ecology, 76: 721-733.
5. Young, W.J., F.M. Marston and J.R. Davis, 1996. Nutrient exports and land use in Australian catchments. J. Envir. Management, 47: 165-183. 6. Hontoria, C., J.C. RodrmH Guez-Murillo and A.
Saa, 1999. Relationships between soil organic carbon and site characteristics in Peninsular Spain. Soil Sci. Society of Am. J., 63: 614-621.
7. Grigal, D.E. and L.F. Ohmann, 1992. Carbon storage in upland forests of the Lake States. Soil Science Society of Am. J., 56: 935-943.
8. Fu, B., L. Chen, K. Ma, H. Zhou and J. Wang, 2000. The relationships between land use and soil conditions in the hilly area of the loess plateau in northern Shaanxi, Catena, China, 39: 69-78. 9. Jaiyeoba, I.A., 1995. Changes in soil properties
related to different land uses in part of the Nigerian semi-arid Savannah. Soil Land Use and Management J., 11: 84-89.
10. Shi, Z.H., 2004. Research on change of landscape pattern and Responses of soil erosion in a watershed level using GIS and RS. Huazhong Agric. Univ.
11. Du, R.H., 1994. The Impact of soil and water losses Upon Ecosystem and Environment in the Three Gorge Area of the Changjiang River. Since press, Beijing.
12. Tucker, C.J., 1979. Red and photographic infrared linear combinations for monitoring vegetation. Remote Sensing of the Environment. 8: 127-150. 13. Black, G.R., 1965. Bulk Density. In: Black, C.A.,
D.D. Evans and J.L. White Eds. Methods of Soil Analysis. Part 1. Agron, 9: 379-390.
14. United Nations Convention to Combat Desertification (UNCCD), 1994. United Nations Convention to Combat Desertification in Those Countries Experiencing Serious Drought and/or Desertification, Particularly in Africa. New York.
15. Wischmeier, W.H. and D.D. Smith, 1978. Predicting Rainfall Erosion Losses, a Guide to Conservation Planning. Agric. Handbook No. 537, US Department of Agriculture, Washington D.C. 16. Williams, J.R. and E.P.I.C. Renard, 1983. A new
method for assessing erosion’s effects on soil productivity. J. Soil and Water Conservation, 38: 381-383.
17. Ma Jianwen, C.F.M., Y. Xue and Z.G. Wang., 2002. Soil Erosion Monitoring in the Upper Yangtze River Basin of China Using ETM Temporal Data. IEEE., pp: 2365-2367.
18. Liu, B.Y., M.A. Nearing, P.J. Shi and Z.W. Jia, 2000. Slope length effect on soil loss for steep slopes. Soil Sci. Soc. Am. J., 64: 1759-1763. 19. Nearing, M.A., 1997. A Single Continuous
Function for Slope Steepness Influence on Soil Loss. Soil Sci. Soc. of Am. J., 61: 917-919. 20. Desmet, P.J. and G. Govers, 1996. Comparison of
Routing Algorithms for Digital Elevation Models and their Implications for Predicting Ephemeral Gullies. Intl. J. of Geographic Information Systems, 10: 311-331.
21. SPSS Inc., 1993. SPSS for widows base system user’s guide release 6.0. Marija J. Norusis/SPSS Inc.
22. Quansah, C., E. Baffoc-Bonnic and F. Agyei, 1990. Runoff and soil loss under four legumes. In ; M.A. Zöbisch (Editor), Land use and the Environment. Proc. 11th Annual General Meeting. Soil science Society of Ghana, pp: 67-76.
23. Sharpley, A.N. and S.J. Smith, 1992. Prediction of bioavailabile phosphorus loss in agricultural runoff. J. Environ. Qual., 21: 32-37.
24. China National Committee for the Implementation of the United Nations Convention to Combat Desertification (CCICCD), 1996. Country report on combating desertification, The Proc. of the Asia-Africa Forum on Combating Desertification, Beijing. China Forestry Publishing House, pp: 27-52.
25. Lepsch, I.F., J.R.F. Menk and J.B. Oliveira, 1994. Carbon storage and other properties of soils under agriculture and natural vegetation in Sao Paulo State, Brazil. Soil Use Management, 10: 34-42. 26. Jiang, Z., Z. Wang and Z. Liu, 1996. Quantitative
study of spatial variation of soil erosion in a small watershed in the loess hills region. J. Soil Erosion and Soil and Water Conservation, 2: 1-9.
27. Fu, B. and L. Chen, 2000. Agricultural landscape spatial pattern analysis in the semi-arid hill area of the Loess Plateau, China. J. Arid Environments, 44: 291-303.
28. Girma, T., 1998. Effect of cultivation on physical and chemical properties of a Vertisol in Middle Awash Valley, Ethiopia. Communications in Soil Science and Plant Analysis, 29: 287-295.