Smeti A - Cholesteri Phase Transition Investigated
By Small Angle X-Ray Diration and
Visosity Measurements
E. L. Duarte 1
, R.Itri 1
,A. R. Sampaio 2
, M. Sim~oes 3
,and A. J. Palangana 2
1
Instituto deFsia,UniversidadedeS~aoPaulo,
CaixaPostal66318, 05315-970-S~aoPaulo,S~aoPaulo,Brazil
2
Departamento deFsia,UniversidadeEstadual deMaringa,
87020-900-Maringa, Parana,Brazil
3
Departamento deFsia,UniversidadeEstadual deLondrina, 86051-970, Londrina,Parana,Brazil
Reeivedon30November,2001
Wehavestudiedtheinueneofthemeanmoleularlengthonthenatureoftheholesteri(N
)
smetiA (A)liquidrystalphasetransitionfor thermotropiompoundsofholesterylmyristate
(C14),holesterylnonanoate(C9),andbinarymixturesofC14 C9 andholesterylaproate(C6)
C9. Mesosopi properties of these systems, as the distane between smeti layers in the A
phase(dA),themeanmoleularlength(
`)intheN
domain,andtheorrelationlength("),aswell
as hangesalong theN
Aphase transition, were determinedfrom theX-ray diration data.
TheresultsshowadereaseinAphasedomainand anexpansionofthe N
domainas themean
moleularlengthis diminished. SuheetinduesaseondorderA N
phasetransition fora
partiularmixtureof 63:1mol%ofC
9
and36:9mol%ofC
6
,evidenedbyvisositymeasurements
ingoodagreementwithpreviousdensitydata.
I Introdution
The rst (disontinuous) and seond (ontinuous)
or-der nature of theliquid rystalphasetransitions have
beenthesubjetofmanyworksalongthelast30years.
In partiular, the Smeti A (A) Nemati (N) or
holesteri(N
)phasetransitionwasdemostratedtobe
of either rstorder orseondorder,depending onthe
smeti layer thikness and the redued temperature,
aording to MMillan's moleular model [1, 2℄. The
redued temperatureis dened as[1℄: r=T
AN =T
NI ,
whereT
AN andT
NI
represent,respetively,theA N
and N Isotropi (I) phase transition temperatures,
also known as MMillan ratio. In a extension of the
MMillan's model proposed byLeeet al. [3℄,the
the-oretial resultspointoutthattheenergyassoiatedto
the smeti ordering inreases with moleular length
and r, ourring a seond order phase transition for
r 6 0:88. Several alorimetri measurements were
performed on binary mixtures (where the molar
ra-tio was varied between two dierent homologous
liq-uid rystal moleules of distint lengths) and showed
that the redued temperature an vary from 0.89 to
0.99 [4, 5℄. In fat, alorimetri measurements
per-formed by two of us on binary mixtures omposed of
holesterylpalmitate(C
16
),holesterylmyristate(C
14 ),
holesteryl nonanoate (C ) and holesteryl aproate
( C
6
) [6℄ and C
9
, holesteryl heptanoate (C
7
) and C
6
[7℄, that present a A N
phase transition, gave
ev-idene of a triritial point around r ' 0:90 - 0.92.
Reently,wehaveinvestigatedthepossibleexisteneof
aseond orderphase transition at r'0:92for a
par-tiularmixture ofC
6 C
9
(63.1mol%of C
9
)through
densitymeasurements[8℄.
It is well known that the average orrelation
length(") in a seond order phase transition diverges
ontinuouslyintheviinitiesofthetransition. Witha
viewofinvestigatingtheorrelationlengthbehaviorin
oursystems, we extended the previous work [8℄
mak-inguseoftheX-raysatteringtehniquetoexplorethe
valuesof"withintheN
andAphasesdomainaswell
asalongtheA N
phasetransition. Inthisontext,
we have studied the same samples previously
investi-gated [8℄ omposed of pure C
9 and C
14
, and binary
mixturesofC
14 C
9 andC
9 C
6
. Themeanmoleular
lengths(l
M
) aredisplayedin Table1,alulatedfrom
themoleular struturetaking into aountthemolar
ratiooftheompoundsemployedinthemixtures. The
moleularlengthofeahompoundwasestimatedasa
sumof theholesterol length(18
A) [9℄plus aradial
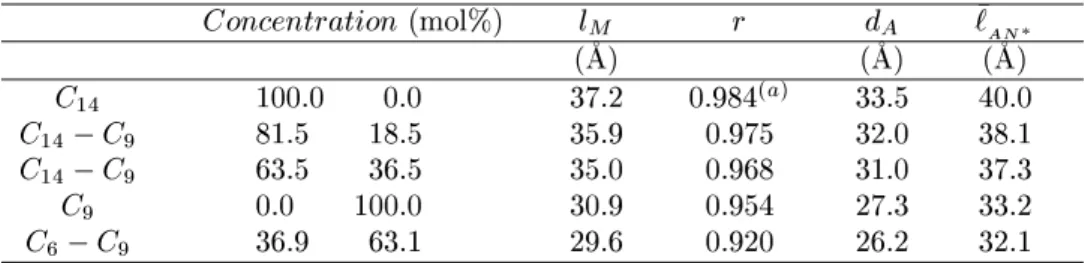
Table1:Calulated meanmoleularlength(l
M
),reduedtemperaturer=T
AN =T
IN
reportedin[8 ℄andd
A ,
`
AN
,
determinedbyX-raydiration(seetextfordetails).
Conentration(mol%) l
M
r d
A
`
AN
(
A) (
A) (
A )
C
14
100:0 0:0 37:2 0:984
(a)
33:5 40:0
C
14 C
9
81:5 18:5 35:9 0:975 32:0 38:1
C
14 C
9
63:5 36:5 35:0 0:968 31:0 37:3
C
9
0:0 100:0 30:9 0:954 27:3 33:2
C
6 C
9
36:9 63:1 29:6 0:920 26:2 32:1
(a)
ThebluephasewasobservedbetweentheN
andAphases,inagreementwithliterature[17 ℄. However,forsimpliity
duetoitsnarrowdomain,thebluephasewasnotaountedforinthereduedtemperaturedenition.
Thevariationinonentrationimpliesahange
in the meanmoleular length and plays an important
roleasathermodynamialvariableinthestudyofthese
systems. TheX-raydatafurnishesthedistanebetween
thesmetilayers(d
A
)inAphasesandthe
experimen-tal mean moleular length (
`) in N
phases from the
dirationpeakposition,and"fromthedirationline
width, as shownbelow. Inthe literature, few
investi-gationshavebeenreported onthevisosity () values
assoiated to the A N
phase transition. In
parti-ular, Porteret al.[11℄ have arried out visosity
mea-surementsasafuntion oftemperatureforholesteryl
myristate (C
14
) in the A, N
and I phases. The
au-thorsshowedthatthevisositiesforboththeholesteri
andsmetiAphasespresentanon-Newtonian
behav-iorwithasharptransitionbetweenthetwomesophases.
II Experimental
II.1 Samples
Cholesteryln-alkanoate homologousseries C
14 , C
9
and C
6
were obtained from Sigma and used without
furtherpuriation. CalorimetriandX-raysattering
measurements were performed on C
14 and C
9
and on
three binary mixtures in the following onentrations:
81:5mol%and63:5mol%C
14
inthebinarymixtureof
C
14 C
9
and63:1mol%ofC
9
inthemixtureofC
9 C
6 .
Itshould beremarkedthatonlytheC
14
ompound
presents the rystalline, A, N
and I phases at
heat-ing and ooling yles. The other samples present
monotropy in the A phase [6, 7℄. Then, the samples
were rst heated up to the I phasein a fast way
fol-lowedbyasloweroolingproedureuptotheAphase.
Whenthelatterwasreahed(without the appearane
ofarystalline phase) theproesswasreverted,rising
again the temperature. Suh proedure permitted to
aquiretheA N
phasetransitiondataatboth
ool-II.2 Methods
TheX-raysatteringmeasurementswereperformed
by using a fousing amera in a 18 kW rotating
an-ode X-raygenerator (Rigaku-Denki) with CuK (Ni
lter, = 1:5418
A) radiation at 50kV 200mA and
an image plate detetion system. Samples were
a-onditioned in sealed 1 mm-thik atmylarwindows,
perpendiularto theinident X-raybeam,plaedin a
opper sample holder in whih a temperature ontrol
wasattahed(EuroControlmodelPC-850A).Further,
the sample holder wasrotated during the X-ray data
aquisitiontoavoidtextureseets(preferential
orien-tation)inthedirationlines. Dataaquisitionofthree
hourswas taken foreah studied temperatureand the
temperature step was 2 Æ
C at both yles. The
spe-tra registered in the image plate were digitized using
a Sanner model STOR M 820 with a help of a P
C-miroomputer.
The 2-D spetra were onverted in 1-D (area
in-tegration) by using the \X-Ray" program [12℄, that
showedtobeanexellentsoftwaretoanalysethistype
of image, furnishing the X-ray intensity (I
obs
(q))as a
funtionofthesatteringvetor(q=4sin=,where
2 is the X-ray sattering angle). The total intensity
was normalized by the exposition time and orreted
bysubtrating aparasitisatteringonsidered asthe
lowsattering ofthe I phase. Thepositionand width
ofthe dirationpeak wereobtainedthroughttinga
Lorentzianfuntion[13℄to theexperimental dataas:
I
obs
(q)/[" 2
(q q
)
2
+1℄ 1
(1)
where q
is the peak position, and " is the
orrela-tion length. From q
, we obtainthe distane between
the smeti layers in the A phase: d
A
= 2=q
;
and themean moleular length in the N
phase [14℄:
`=2(1:229)=q
. Thevaluesofd
A and
` presentedin
the urrent work, orrespond to the mean values
simi-Visositymeasurementsasafuntionofthe
temper-atureneartheA N
phasetransitionweredetermined
bymeansofaBrookeldCone/PlateRheometermodel
LVDV III. The rheometer was alibrated with a
standardoil ofknownvisosity. Thesample
tempera-turewasontrolled byaHetoCB8 30E=DT 1
ir-ulatingtemperaturebath,ensuringthatthe
tempera-turereadingswerestableat0.01K.Aoolingrateof6
mKs 1
wasusedduringthemeasurements. Additional
measurements were also made as a funtion of shear
rate. Thephasetransition temperatures were heked
byusingapolarizedlightmirosope.
III Results and disussion
III.1 X-Ray Sattering
The X-ray sattering spetra of thermotropi
mesophasesAandN
presenttworings[14℄. Therst
ring appears in a small angle range and is assoiated
tothelayerrepetitiondistaneintheAphase,andthe
mean moleular length in the N
phase. The seond
ring, presentedin largerangles, isharateristiof an
average distane between the moleules perpendiular
tothelongaxisofthesame,withsmallvariationalong
ofthephases.
In this work, we are interested in investigating
the variation of the orrelation length (") in the two
mesophases, as well as along the A N
phase
tran-sition. Therefore, we fous our attention on the rst
dirationring(2'2:5 Æ
). Thefeaturesof theX-ray
spetra (Fig. 1) of eah phase an be summarized as
follows:
1. I phase: theX-raysatteringisdiuse(Fig.1-a),
harateristi of a disordereddistribution of the
moleules.
2. N
phase: the X-ray sattering presents a well
denedring(Fig. 1-b),relatedtotheorrelation
betweenmoleules nearly orientedalonga
dire-toraxis.
3. A phase:theX-ray satteringpresentsathinner
and stronger ringthan that observed in the N
phase(Fig. 1-),duetoamoreorderedstrutural
arrangement.
0 .1
0 .2
0 .3
0 .1
0 .2
0 .3
0 .1
0 .2
0 .3
I
ob
s
I
M A X
~ 4 x 1 0
- 9
I
M A X
~ 4 x 1 0
- 6
c .
b .
a .
I
M A X
~ 1 x 1 0
- 7
q (Å
-1
)
Figure1. 2-DX-raysatteringspetraand1-DintensityIobs(q): experimental(),andLorentzianfuntiontting(Eq. 1)
(|)inthephases: (a)I;(b)N
;()A. I
max
orrespondstomaximumintensityatpeakposition.
Figure1 alsopresentsthe 1-DX-ray sattering
re-latedtothe2-Dimages. NotethattheX-raysattering
peak intensity risesand the width beomes narrowas
thepositionalorderinreasesin thesystem.
III.1.1 Distanebetween smetiplanesandthe
mean moleular length
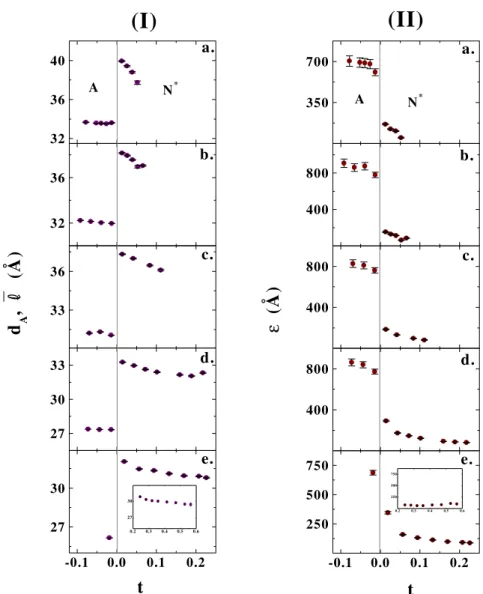
Figure2(part I)presentsthedistanebetweenthe
smeti A planes (d
A
), and the experimental mean
moleularlength(
`)in theN
phase[14℄asafuntion
of the temperature ratio: t = (T T
)=T
[8℄.
Aordingly,d
A
is pratiallyonstantin the Aphase
domain, whereas
` dereases astemperatureinreases
inN
phases. Table1showstheobservedd
A
valuesin
omparisonwiththosealulatedfromthemean
mole-ularstruture (l
M
). Thus, one annote that the
dis-tane between the layersin the A phase is ira 10%
smallerthantheorrespondingmeanmoleularlength
alulatedbyassuming atotalextended hain
onfor-mation. Moreover,d
A
dereaseswithl
M
0.2
0.3
0.4
0.5
0.6
27
30
0.2
0.3
0.4
0.5
0.6
250
500
750
33
36
c.
27
30
33
d.
-0.1
0.0
0.1
0.2
27
30
(II)
(I)
t
e.
350
700
N
*
A
a.
400
800
b.
400
800
c.
400
800
ε
(Å
)
d.
-0.1
0.0
0.1
0.2
250
500
750
t
e.
32
36
d
A
,
(Å
)
b.
32
36
40
N
*
A
a.
Figure2. (I)distane(d
A
)betweenthesmetiAlayersandmeanmoleularlength
`
intheN
phase;and(II)orrelation
length(")(average valuesbetweenoolingandheating yles)asafuntionofthetemperatureratio t[8 ℄for thefollowing
samples:(a)C
14
;(b)81:5 mol%ofC
14
intheC
9 C
14
mixture;()63:5 mol%ofC
14
intheC
9 C
14
mixture;(d)C
9 ;(e)
63:1mol%ofC
9
intheC
9 C
6
mixture. Theinsetin(e)shows
`and"valuesforagreaterintervaloft=(T T
AN )
=T
AN
obtainedforthissamplewithintheN
phase.
On the other hand, the observed mean moleular
length
`intheN
phaseneartheA N
phase
transi-tion(
`
AN )
isgreaterthanl
M
(Table1). Thisbehavior
anbedue tothefat thattheexpressionto alulate
`,suggestedbydeVries[14℄,isvalidinI andN phases,
whenthemoleules donothaveastrong orientational
order eet. Therefore,webelievethat
`
IN (
`in the
N
phaseneartheN
I phasetransition)is,indeed,
themeanmoleularlength,and
`
AN
hasnomeaning.
Anyway,d
A
isalwayssmallerthan
`
IN
duetothe
on-trationofthemoleulesasthetemperatureisredued.
Aspreviouslymentioned,oneannotefromtheFig.
2(part I) that theA phasedomain dereases andthe
N
phaseinreasesasl
M
dereases.
III.2 Correlation length
in the A and N
phases for all studied samples. As
one anobserve, "inreases in N
phase as
tempera-turedereases. Thisisdue toaninreaseinthe
orien-tationalorderwhenthetemperaturemovesawayfrom
theI N
phasetransitionandapproahstotheN
A
phasetransition.
Inontrast,theorrelationlengthispratially
on-stant in the A phases with a small derease in the
N
A phase transition viinity, still in theA phase
domain. Regarding to 63:1 mol%C
9
in the C
9 C
6
binary mixture, just onetemperature in the A phase
(Fig. 2.I-e) was experimentally obtained, beause its
domain is very narrow before the appearane of the
rystalphase. Moreover,there is aleardisontinuity
in the values of " along the N
A phase transition
mole-lation lengthdisontinuity(") at the N
A phase
transition. This beause the orrelation lengthin the
N
phaseneartheN
Aphasetransitionisgreaterfor
samples with shorter mean moleular length bringing
aboutadereasein"inthereferredphasetransition.
III.3 Visosity
The visosity, , results versus temperature ratio
and shear rate, , near the A N
phase transition,
fromthepureompoundsC
14 andC
9
areshowninthe
gure 3. Note the presene of a peak [15, 16℄ at the
A N
phase transition for the C
14
pure ompound
(Fig. 3-a). Indeedvisositydatahaveprovideda
sensi-tivemeasurementforphasetransitions[15℄ and,inthis
ase,aleardistintionbetweenthesmetiAandthe
holesteriphases visosity values. Themagnitude of
thepeakaswellas thevisosityvaluesatA phase
de-reasemarkedlywithinreasingshearrate. Thismight
beorrelatedtothefatthatitiseasiertobreakupthe
smetistrutureastheshearrateisinreased. Similar
resultsforthesameompoundwasobtainedbyPorter
etal. [11℄.
Figure 3. Visosity vs temperature ratio t = (T
TAN
)=TAN
atA N
phasetransition: (a)C14 and(b)
C9. Shearrate():F!1:5s 1
andM!3:0s 1
.
Thevisosity valuesinreaseat the A N
phase
transition for the C
9
while r diminishes from 0:986
(C
14
)to0:956 (C
9
)shownin gure3-b. Onthe other
hand, thehanges in the valuesarenot sharpin C
9
as in C ompound from N
to A phases (t 0:2
forC
9
). ThisA N
phasetransitionhasbeen
onsid-eredasbeingweaklyofrstorderbyMMillan[1℄. His
X-rayexperiments point upto the growth of
smeti-likeshort-rangeorderin theholesteriphasenearthe
A N
phasetransition. Ourexperimentalresultsseem
to be onsistentwith this fat. Suh pretransition
ef-fetanberelatedto theinreaseinthevisosity
val-uesand reduedtemperatureintervalobserved in this
phasetransition.
Figure 4 shows the visosity values at shear rate
of = 0:4s 1
for 63.1 mol% C
9
at r = 0:918 in
the C
9 C
6
system, where the existene of a
possi-bleseondorderA N
phasetransitionwasreently
investigated[8℄. Suhlowvalueof shear ratewasused
due tothe stronginrease in thevisosityvaluesnear
the phase transition. Note that the visosity for this
mixture at = 0:4s 1
is on the same order of
mag-nitude observedforC
14
ompound at =3s 1
. Suh
inreasein visosity fortheC
9 C
6
ompound in the
N
A phase transition an be related to the small
domain of the A phase in this mixture, as shown in
thex-rayexperiments,followed byaverynear rystal
phase. Moreover, the interval of temperature
assoi-ated to the hanges in the values from N
to A is
largerthanforC
9
(t0:4forthismixture).
Figure 4. Visosity vs temperature ratio t = (T
TAN
)=TAN
atA N
phasetransitionforthe63.1mol%
ofC9 intheC9 C6 mixture(=0:4s 1
).
To sum up, the results obtained through X-ray
and visosity measurements used in this work,
inves-tigatingthe same liquid rystalline ompounds of the
homologous series of the holesteryl n-alkanoates [8℄,
presentseveralinterestingfeaturesin thenatureofthe
A N
phasetransition,dependingonthemean
mole-ularlength.AsfarastheX-raysatteringdataare
on-erned,adereaseinAphasedomainandanexpansion
ofthe N
phasedomain with the redutionof thel
M
wereobserved. Thisbehavioristhesameobtained
the-oretiallybyLeeetal. [3℄. Thedistanebetweenlayers
intheAphaseisompatible,althoughalittlesmaller,
to thealulatedl
M
and theexperimental
`
IN
mean
moleular length. Moreover, d
A
dereases with l
M as
expeted. The orrelation length in the N
greater for the samples with smaller mean moleular
lengths. Thevisosityvaluesinreases at theA N
phase transition while r diminishes. For 63.1 mol%
C
9
in the C
9 C
6
a big inrease in the visosity of
thesystemwas observedasN
Aphasetransitionis
approahed, where the existene of a possible seond
orderphasetransitionwas pointedout[8℄.
Aknowledgments
This work wassupported by researh grants from
Pronex/MCT and FAPESP to R. Itri, Funda~ao
Arauaria and CNPq to A. J. Palangana and M.
Sim~oes. E.L.DuarteandA.R.Sampaiohadamaster
fellowship from FAPESP and CAPES, Brazil,
respe-tively. ResearhfellowshiptoR.ItrifromCNPqisalso
appreiated.
Referenes
[1℄ W.L.MMillan, Phys.Rev.A,6,936(1972); Phys.
Rev.A,4, 3,1238(1972).
[2℄ T.C.Lubensky, J.Phyique,36, C1-151(1975).
[3℄ F.T.Lee,H.T.Tan,Y.M.Shih,andC.W.Woo,Phys.
Rev.Lett.31,1117 (1973).
[4℄ D. L. Johnson, C. Maze, Z. Oppenheim, and R.
Reynolds, Phys.Rev.Lett.34,1143(1975).
[5℄ J.Thoen,H.Marynissen,andW.Vandael, Phys.Rev.
Lett.52,204(1984).
[6℄ A.J. Palangana, S. Jayaraman, and T. Kroin, Mol.
Cryst.Liq.Cryst.,131,217(1985).
[7℄ A.J.Palangana, L. R.Evangelista,M. Sim~oes,and S.
Jayaraman, Liq.Cryst.,15,3,377(1993).
[8℄ E.L. Duarte, A.J. Palangana, R. Itri, A.R. Sampaio,
andA.A.Barbosa, Eur.Phys.J.B5,835(1998).
[9℄ J.H.WendorandF.P.Prie, Mol.Cryst.Liq.Cryst.
22, 85(1973).
[10℄ C.Tanford, J.Phys.Chem.76,3020(1972); 78,2469
(1974).
[11℄ K. Sakamoto, R.S. Porter, and J.F.Johnson, Mol.
Cryst.Liq.Cryst.8,443(1969).
[12℄ http://www.umh.a.be/~poly/XRay/X-Ray.htm.
[13℄ D.E.MontonandR.Pindak, Phys.Rev.Lett.43,10
(1979).
[14℄ A. de Vries, Mol. Cryst. Liq.Cryst. 10, 219(1970);
11,361(1970); 20,119(1973).
[15℄ M. Kuzma, Y.W. Hui, and M.M. Labes, Mol. Cryst.
Liq.Cryst.172,211(1989).
[16℄ A.R.Sampaio,P.R.G.Fernandes,M.Simoes,andA.J.
Palangana,Mol.Cryst.Liq.Cryst.359,269(2001).
[17℄ D. Demus, H.G. Hahn, and F. Kushel, Mol. Cryst.