ISSN 0104-6632 Printed in Brazil
www.abeq.org.br/bjche
Vol. 25, No. 01, pp. 71 - 82, January - March, 2008
Brazilian Journal
of Chemical
Engineering
INFLUENCE OF REMOVAL TIME AND
PARTICLE SIZE ON THE PARTICLE
SUBSTRATE ADHESION FORCE
M. A. Felicetti, F. Piantino, J. R. Coury and M. L. Aguiar
*Department of Chemical Engineering, Federal University of São Carlos, Phone: +(55) (16) 3351-8695, Fax: +(55) (16) 3351-8266.
Cx. Postal 676, CEP: 13565-905 São Carlos - SP, Brazil. E-mail: [email protected],
E-mail: [email protected]
(Received: March 09, 2006 ; Accepted: November 08, 2007)
Abstract - An investigation was conducted on influence of removal time on the particle substrate adhesive force. The centrifuge technique was used to determine the adhesion force at different compression and removal rates. A microcentrifuge with a maximum rotation of 14000 rpm was used to both compress upon particles and remove them from the surface of the substrate. An image analysis program (Image-Pro Plus 4.5) was employed to monitor the number of particles adhering to and removed from the surface of the substrate after each increase in angular speed. The influence of removal time on the adhesion force was investigated, using removal times of 1, 3 and 5 minutes, which indicated that removal time does not interfere with the adhesion force within the diameter range analyzed here.
Keywords: Adhesion force; Centrifuge technique; Time of removal, Adhesion.
INTRODUCTION
In the context of this study, adhesion can be understood as the attraction between two solid bodies with common contact surfaces, which is produced by intermolecular attractive forces of short-distance action (Zhou, 2003). Knowledge of the adhesion force is important not only in the quantitative description of filtration, but also in various technological processes. A greater understanding of the interactions of adhesion can contribute toward knowledge of phenomena such as friction, lubrication and equipment wear (Bowden & Tabor, 1950). For this reason, a considerable number of theoretical and experimental studies have been dedicated to problems of adhesion, including those reported by Kordecki and Orr (1960), Corn (1961), Krupp (1967), Zimon (1982) and Lee and Jaffe (1988). Determination of the adhesion force between particles is of great interest in a wide range of industrial operations, from ceramic materials
processing to the cleanup of gases. Besides the major role it plays in such operations, the adhesion force poses a practical problem in the electronics industry (Soltani, 1995), in the removal of particles from elastic substrates and in xerography (Zhou et al., 2003). In the operation of equipment such as heat exchangers, cooling systems and food processing equipment, adhesion is responsible for the formation of biofilms, which significantly affect the performance of this equipment as well as the safety of the product from biocontamination (Flemming, 1996). However, adhesion is desirable in many cases, such as in operations of compaction and of particle and surface coating.
contact with each other (Podczeck et al., 1996). All these forces are affected by the material, its shape, surface roughness, particle size, relative air humidity, duration of contact and initial speed of contact (Ahrens et al., 2005). Therefore, the total adhesion force (Fadhesion) is known as the sum of various forces
(Stewart, 1986), as illustrated in Equation (1):
Fadhesion =Fvdw +Fc +Fes (1)
where Fvdw is the van der Waals force, Fc
corresponds to the capillary force and Fes represents
the electrostatic force.
Various experimental methods and techniques have been developed to measure the adhesion forces between particles and a surface (Krupp, 1967; Boehme et al., 1962). Of these methods, the ones most commonly used are atomic force microscopy, electric field separation and the centrifuge technique. However, the centrifuge technique offers the advantage of allowing one to easily determine the adhesion forces between real particles with regular and irregular shapes on smooth or rough surfaces, since it is a simple, accessible method providing reliable results (Lam & Newton, 1991; Böhme et al., 1962; Booth & Newton, 1987). Moreover, with only one measurement, it allows one to determine the adhesion force based on the distribution of the adhesion force within a large group of particles (containing up to 1000 particles) on a substrate. In this method, the adhesion force is equal in magnitude, but with a sign opposite to the centrifugal force required to remove the particles from the substrate.
Therefore, this work purported to investigate the influence of removal time and particle size of inorganic powdery material on the particle substrate adhesion force, using the centrifuge technique at different compression and decompression speeds.
The experimental methodology employed here was developed by Banda (2002) at the Federal University of São Carlos’ Environmental Control Laboratory 1. The influence of the forces applied in the adhesion of phosphate rock and dolomitic limestone in the range of 10 - 17 µm, 17 - 24 µm and 24 - 31 µm to a stainless steel substrate, was investigated by the centrifuge technique.
MATERIAL AND METHODS
Powdery Material
The powdery inorganic material used in the experiments was phosphate rock (from Fosfértil S.A., Patos de Minas, MG, Brazil) with a density of 3.066 g/cm3 and dp = 14.91 µm, while the dolomitic
limestone (supplied by Riedi S.A., Toledo, PR, Brazil) had a density of 2.838 g/cm3 and dp = 11.97
µm. A sieve was used to separate the powdery
material into fractions smaller than 400 mesh (opening of 37 µm). The material was separated with a microcentrifuge in order to obtain the diameter of powdery materials used in experiments. The use of sieves was necessary because this powdery material is considerably heterogeneous.
The granulometric distribution of the phosphate rock and the dolomitic limestone is shown in Figure 1.
100 10 1 0,1
0 20 40 60 80 100
Ac
c
u
m
u
la
te
d
M
a
s
s
(%
)
Particle Size (µm)
Powdery Material
Phosphate rock Dolomitic limestone
Figure 1: Granulometric distribution of the phosphate rock (solid line) and the dolomitic limestone (dashed line) determined in a Horiba characterizer at the Federal
Methodology
The adhesion force was determined by the centrifuge technique. The experimental system basically consisted of a microcentrifuge (MA – 860, Marconi Equipamentos), a powder disperser, an optical microscope (Olympus BX60), an image analyzer (Image-Pro Plus 4.5) and a microcomputer equipped with the software required for processing the data and analyzing the results.
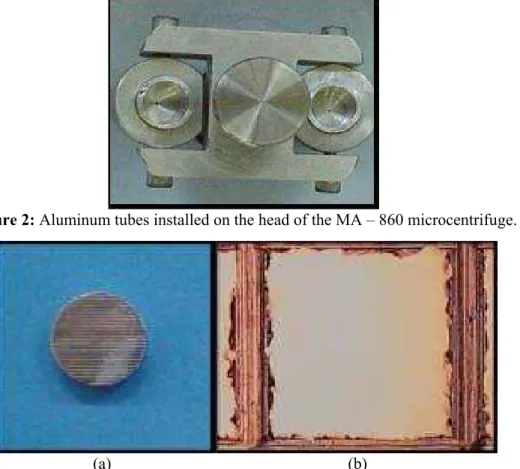
The microcentrifuge operated at a maximum speed of 14000 rpm. As depicted in Figure 2, two aluminum tubes were installed on the head of this microcentrifuge specifically to support the test discs with the powdery material spread over their surfaces.
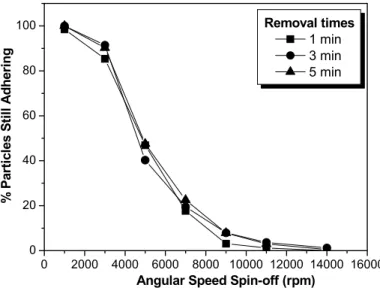
These tubes were installed in a fixed angle rotor to allow for deposition of the particles perpendicular to the rotation shaft of the centrifuge. The tubes contained adapters, also made of aluminum, with steel test discs having polished surfaces. Reticles were etched onto these polished surfaces to form a grid of squares each with an area of 0.5 mm2. These squares were used as references, serving, after each centrifugation, to localize a given particle under the optical microscope and thus determine the centrifugal decompression (spin-off) force at which that particle was removed. A polished test disc with its reticulated surface and beside it the same image
magnified 100 times through the optical microscope, an Olympus BX60, are shown in Figure 3.
The relative humidity of the air in the laboratory was controlled and kept below 50%, while the temperature in the laboratory where the experimental runs were conducted was kept between 15 and 20°C.
After carrying out the aforementioned preparatory steps, the particles of powdery material were placed on the disc surface using a powder dispersal system (a Galai PD-10 vacuum gage) to prevent them from agglomerating. The dusty test disc surfaces containing the powdery material were positioned facing toward the rotor shaft so that the centrifugal compression (press-on) force would act first on the particles and then on the surface. A press-on of 5000 rpm was applied for 1 min to study the influence of removal time of phosphate rock particles on the particle substrate adhesive force, while press-on of 1000, 2000 and 10000 rpm were applied for 1 min to study the influence of phosphate rock and dolomitic limestone particles on the particle substrate adhesion force. The sample was then removed from the centrifuge and the particles counted, using the image analyzer (Image-Pro Plus 4.5) on a PC microcomputer connected to the optical microscope (Olympus BX60 - Olympus Co., Tokyo, Japan) and coupled to a CCD-IRIS (Sony Co., Japan) color videocamera to determine the number of particles adhering to the surface.
Figure 2: Aluminum tubes installed on the head of the MA – 860 microcentrifuge.
The test discs were then put back into the microcentrifuge with their dusty surfaces positioned facing toward the external part of the rotor head, so that the centrifugal decompression (spin-off) force would act first on the surfaces and then on the particles, removing them from the surfaces.
During the particle removal operation (application of spin-off), disc was subjected to increasing rotation speeds, and hence to increasing centrifugal forces. Images of the remaining particles on the discs were acquired at each increase in angular speed. The spin-off speeds for removal of the particles used in these experimental runs were 1000, 3000, 5000, 7000, 9000, 11000, 13000 and 14000 rpm.
RESULTS AND DISCUSSION
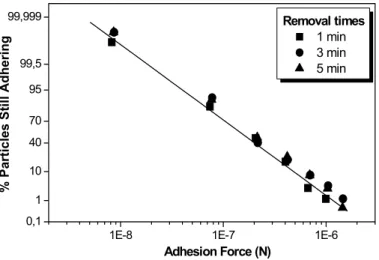
Based on the test results, graphs were plotted showing percentage of particles adhering to the surface of the disc as a function of spin-off applied in removal of the particles. Figure 4 contains these graphs for a diameter range of 17 - 24 µm and removal times of 1, 3 and 5 minutes at a press-on of 5000 rpm.
The graphs depicted in Figure 5 were plotted based on the curves presented in Figure 4. These graphs show the percentage of particles adhering to the disc surfaces as a function of adhesion force,
which was calculated using Equations (2) and (3):
Fadhesion= - Fcentrifugal (2)
and
2
Fcentrifugal =M ωd c d (3)
The magnitude of Fcentrifugal applied depended on
the particle mass (m), given in kg; on the angular speed (ωd) of the surface of the substrate in the
centrifuge, given in rad/s; and on the distance between the surface of the substrate and the rotation shaft (dc). This distance between the substrate and
the rotation shaft was 0.057 m. The mass of phosphate rock particles was obtained using Equation (4):
M=ρp Vp (4)
where ρP is the particle density and VP is the particle
volume.
As the graphs in Figures 4 and 5 indicate, the spin-off time is unimportant in this methodology. The mean adhesive force at 1, 3 and 5 minutes was 1.87 × 10⁻⁷N, while the standard deviation was 0.45 after application of a press-on force of 5000 rpm.
0 2000 4000 6000 8000 10000 12000 14000 16000 0
20 40 60 80 100
%
P
a
rtic
le
s
S
till
A
d
h
e
rin
g
Angular Speed Spin-off (rpm) Removal times
1 min
3 min
5 min
1E-8 1E-7 1E-6 0,1
1 10 40 70 95 99,5 99,999
%
P
a
rt
icles
S
til
l Adh
erin
g
Removal times
1 min 3 min 5 min
Adhesion Force (N)
Figure 5: Percentage of particles that remained as a function of adhesion force after 1, 2 and 3 min removal times.
Figure 6 contains the results of one of the experimental tests, for which a graph was plotted of the percentage of particles still adhering to the surface of the discs as a function of angular speed of removal of phosphate rock particles after application of a spin-off speed of 1000 rpm. Note that, as the angular speed increased, the percentage of particles adhering to the surface decreased until all the particles had been removed upon application of the spin-off speed of 14000 rpm.
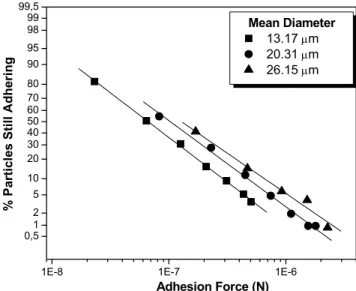
Using the curves presented in Figure 6, the
graphs in Figure 7 were made, showing the percentage of particles adhering to the disc surfaces as a function of the adhesion force of three powder fractions. The adhesion force was calculated using Equation (2).
In Figure 7 the curves for these coordinates are linear, which illustrates the fact that the data followed a log-normal distribution. The same behavior was observed for press-on speeds of 2000 and 10000 rpm and also for the other powder investigated here, i.e., dolomitic limestone.
0 2000 4000 6000 8000 10000 12000 14000 0
10 20 30 40 50 60 70 80 90 100 110
% Par
ticles
Still Ad
he
rin
g
Angular Speed Spin-off (rpm)
Mean Diameter
13.17 µm 20.31 µm 26.15 µm
1E-8 1E-7 1E-6 0,5
1 2 5 10 20 30 40 50 60 70 80 90 95 98 99 99,5
%
Pa
rt
ic
le
s
St
il
l Ad
h
e
rin
g
Adhesion Force (N)
Mean Diameter
13.17 µm 20.31 µm 26.15 µm
Figure 7: Percentage of particles still adhering as a function of adhesion force for phosphate rock after application of a spin-off speed of 1000 rpm.
The average adhesion force (geometric median) and the geometric standard deviation can be characterized for each curve representing the percentage of particles adhering as a function of adhesion force (Zimon, 1982). The geometric median can be defined as the adhesion force at which there is a 50% probability that the particles will still be adhering to the surface after centrifugation. This median was used to represent the average adhesion force of a particle on the substrate. The geometric
standard deviation, σg, was calculated using
Equation (5).
50% probability force value
σg
16% probability force value
= (5)
In this equation, the value of the force, which is equivalent to a 16% probability that the particles will still be adhering to the substrate, was determined graphically.
This procedure was used to determine the average adhesion force and its respective geometric standard deviations for the three ranges of powdery material diameters, as indicated in Table 1. This table also shows that the adhesion force between the particles of the powdery materials and the surface of the stainless steel disc increased with particle size and the press-on force.
The graph in Figure 8 depicts the adhesion force as a function of mean particle diameter of the powdery materials used in these experiments after
application of the centrifugal press-on speed of 10000 rpm. Note the increasing adhesion force of the particles of the powdery materials on the surface of the stainless steel disc as particle size increased. This same behavior was observed at the press-on speeds of 1000 and 2000 rpm.
Based on the results of the adhesion force of the two powdery materials, the distance of effective separation (z0) between the surface of the particle
and that of the test disc was determined using Equation (6). Assuming that the powdery materials used here were dry, since the experimental runs were carried out at a relative air humidity of less than 50%, the van der Waals force determined with Equation (7) was the most important component and was what limited the adhesion force (Banda, 2002).
H dp z0
12 Fadhesion
= (6)
H dp Fadhesion Fvdw
2 12 z0
= = (7)
where dp is the particle diameter in meters, z0 is the
Table 1: Comparison of geometric median and adhesion force of the two materials after application of centrifugal speeds press-on of 1000, 2000 and 10000 rpm.
Powdery Material Press-on (rpm) Average Diameter
(µm)
Adhesion Force (× 10-7 N)
Geometric Standard Deviation σg 1000 13.38 20.87 27.25 0.85 2.27 5.03 0.19 0.21 0.27 2000 12.73 19.99 27.62 1.39 3.94 5.79 0.26 0.24 0.20 Dolomitic Limestone 10000 12.81 20.19 27.30 2.48 4.40 7.34 0.34 0.33 0.44 1000 13.17 20.31 26.15 0.66 1.02 1.29 0.32 0.31 0.28 2000 12.66 19.83 27.42 0.86 1.32 1.84 0.32 0.35 0.39 Phosphate rock 10000 13.01 19.97 26.09 2.37 4.17 5.53 0.45 0.49 0.54
12 14 16 18 20 22 24 26 28
2x10⁻⁷ 3x10⁻⁷ 4x10⁻⁷ 5x10⁻⁷ 6x10⁻⁷ 7x10⁻⁷ 8x10⁻⁷ A dhesi on For ce ( N )
Average Diameter of Particles (µm)
Powdery Material
Dolomitic limestone Phosphate rock
Figure 8: Adhesion force as a function of mean particle diameter for both powdery materials after application of a press-on speed of 10000 rpm.
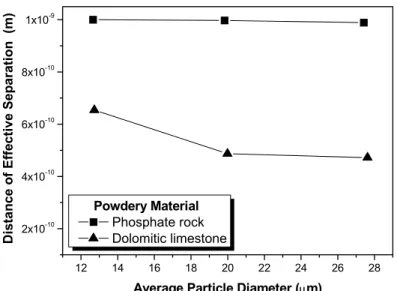
The graph in Figure 9 illustrates the distance of effective separation as a function of mean particle size of the two powdery materials used in these experiments after application of a centrifugal press-on speed of 2000 rpm. As can be seen, the distance
of effective separation (z0) obtained for the
phosphate rock remained practically constant, indicating that z0 was practically independent of
particle size. The distance of effective separation (z0)
for the dolomitic limestone decreased as the press-on force on the particles increased. The same procedure was used for press-on speeds of 1000 and 10000
rpm, which produced results similar to those presented in Figure 9.
According to Schubert (1981), the smallest possible distance between two smooth spherical particles in contact with each other is 4 × 10⁻¹⁰ meters. This author suggested that, for real particles, this value would be between 4 × 10⁻¹⁰ m and 4 × 10⁻⁸ m. As can be seen in Figure 9, the values of z0 lie
within this range.
glass and quartz particles (> 20 µm) at 25°C, is as follows:
(
)
Fadhesion = 0.063 d 1 0.009 %RHp + (8)
where the adhesion force, Fadhesion, is given in
newtons; the particle diameter, dp, is given in meters;
and the relative air humidity, %RH, is given in percentage.
Based on Equation (8), we attempted to fit an equation that would better reflect the experimental
results found in this study. Since the relative air humidity was kept constant at 39% throughout the experiments, Equation (8) can be written Equation (9):
Fadhesion =k dp (9)
where k is a constant in which the relative air humidity and the physicochemical properties of the powdery materials are included and dp is the particle
diameter in meters.
12 14 16 18 20 22 24 26 28
2x10⁻¹⁰
4x10⁻¹⁰ 6x10⁻¹⁰ 8x10⁻¹⁰ 1x10⁻⁹
Di
s
tan
ce
o
f Eff
e
ct
ive
Sep
a
rati
on
(m
)
Average Particle Diameter (µm)
Powdery Material
Phosphate rock Dolomitic limestone
Figure 9: Distance of effective separation as a function of average particle diameter of the two powders after application of a speed of 2000 rpm.
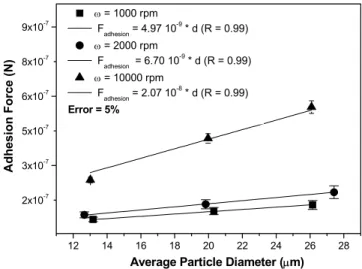
The graph in Figure 10 shows the adhesion force as a function of mean particle diameter of the phosphate rock after application of centrifugal compression force of 1000, 2000 and 10000 rpm.
In Figure 10, note that the adhesive force increases linearly with the increase in particle diameter of the phosphate rock, whose sphericity is 0.6, and with the increase in angular press-on speed. Hence, a linear equation was fit for the phosphate rock, represented by Equation (10), for the three press-on speeds, as indicated in Figure 10, where the linear correlation coefficient for the three equations was 0.99.
k1
Fadhesion =k dp (10)
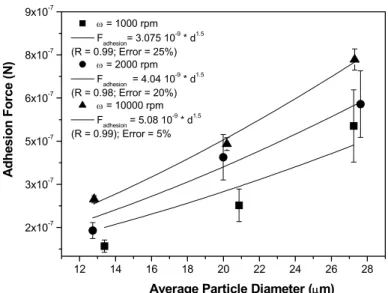
Figure 11 contains a graph of the adhesive force as a function of mean particle size of the phosphate
rock after application of the centrifugal compression force of 1000, 2000 and 1000 rpm.
In Figure 11, note the same behavior assumed for the phosphate rock. However, the equations of adhesion force as a function of this material’s mean particle diameter, whose sphericity is 0.64, are nonlinearly dependent, albeit only at three points.
A curve was fit to verify the relation of adhesion force to particle diameter. The best fit was that of Equation (11), with a linear correlation coefficient of 0.99, as illustrated in Figure 11.
1.5
Fadhesion = k dp (11)
2000 and 10000 rpm were applied.
As indicated in Figures 12 and 13, the adhesive force increased nonlinearly with the increase in angular press-on speed of the particles of phosphate rock and dolomitic limestone.
The equation that best fits the experimental data is Equation (12):
k2 Fadhesion k w
d
= (12)
For the phosphate rock, the exponent k2 was 0.6
in all the mean particle diameter ranges, as indicated in Figure 12. For dolomitic limestone, the exponent k2 was equal to 0.2 for the particle diameters of 20.35
and 27.39 µm and 0.3 for the particle diameter of 12.97 µm.
An analysis of Figures 10 to 13 gives one an idea of how the adhesion force varied according to the mean particle diameter and the angular press-on speed. For the phosphate rock, note that the variation in adhesion force according to mean particle size is similar to that in Equation (8) proposed by Corn (1961). However, this variation did not occur with the dolomitic limestone, for which the adhesion force
was also found to vary nonlinearly, even though only three points were used.
Using the experimental results obtained in this work and Microsoft Excel and Origin 7.0 software, and based on Equation (8) and the graphs in Figures 10 to 13, an equation was proposed which would provide a more comprehensive representation of the experimental results obtained for the two inorganic powdery materials. The equation below, Equation (13), best represented the adhesion force between the stainless steel surface and the particles of the two inorganic powdery materials at a constant relative air humidity.
k
k1 2
Fadhesion k dp d
= ω φ (13)
where k is a constant in which the relative air humidity and the physicochemical characteristics of the powdery materials are included, while k1 and k2
are the parameters of the equation; dp is the particle
diameter in meters; ωd is the angular press-on speed,
whose unit is s-1; and the particle sphericity (φ) is dimensionless. However, Equation (13) still requires further investigation in order to be validated.
12 14 16 18 20 22 24 26 28 2x10⁻⁷
3x10⁻⁷ 5x10⁻⁷ 6x10⁻⁷ 8x10⁻⁷ 9x10⁻⁷
A
d
h
e
sion Force
(N)
Average Particle Diameter (µm) ω = 1000 rpm
Fadhesion = 4.97 10-9 * d (R = 0.99) ω = 2000 rpm
Fadhesion = 6.70 10-9 * d (R = 0.99) ω = 10000 rpm
F
adhesion = 2.07 10 -8
* d (R = 0.99)
Error = 5%
12 14 16 18 20 22 24 26 28 2x10⁻⁷
3x10⁻⁷ 5x10⁻⁷ 6x10⁻⁷ 8x10⁻⁷ 9x10⁻⁷
A
dhes
ion For
c
e
(N
)
Average Particle Diameter (µm)
ω = 1000 rpm Fadhesion= 3.075 10-9 * d1.5 (R = 0.99; Error = 25%)
ω = 2000 rpm Fadhesion = 4.04 10-9 * d1.5 (R = 0.98; Error = 20%)
ω = 10000 rpm Fadhesion = 5.08 10-9 * d1.5 (R = 0.99); Error = 5%
Figure 11: Adhesion force as a function of average particle diameter of dolomitic limestone after application of spin-off speeds of 1000, 2000 and 10000 rpm.
0 2000 4000 6000 8000 10000 1x10⁻⁷
2x10⁻⁷ 3x10⁻⁷ 4x10⁻⁷ 5x10⁻⁷ 6x10⁻⁷ 7x10⁻⁷
A
dhesi
on For
ce
(N
)
Angular Press-on Speed (rpm)
d = 12.95 µm Fadhesion = 9.44 10-10 * ω0.6
(R = 0.99) d = 20.04 µm
Fadhesion = 1.62 10-9 * ω0.6 (R = 0.99) d = 26.53 µm
Fadhesion = 2.16 10-9 * ω0.6
(R = 0.99) Error = 5%
Figure 12: Adhesion force as a result of angular press-on speed of phosphate rock particles after application of centrifugal press-on speeds of 1000, 2000 and 10000 rpm.
0 2000 4000 6000 8000 10000
2.0x10⁻⁷ 4.0x10⁻⁷ 6.0x10⁻⁷ 8.0x10⁻⁷
1.0x10⁻⁶ 1.2x10⁻⁶ 1.4x10⁻⁶
A
dhes
ion
Fo
rc
e
(
N
)
Angular Press-on Speed (rpm)
d = 12.97 µm Fadhesion= 1.45 10-8 * ω0.3
(R = 0.95) d = 20.35 µm
Fadhesion= 7.16 10-8 * ω0.2
(R = 0.83; Error = 15%) d = 27.39 µm
Fadhesion= 1.21 10-7 * ω0.2 (R = 0.96) Error = 5%
CONCLUSIONS
Variations in removal time did not affect the adhesion force. Therefore, to facilitate the acquisition of data and based on the results of this study, we recommend the use of a one-min removal time for further experiments.
The adhesion force between the particles of the powdery inorganic materials used in these experiments and the surface of the stainless steel disc increased with increasing particle size and with increasing press-on speed.
The values of adhesion force for the dolomitic limestone were higher than those for the phosphate rock for all the diameters and at all the press-on speeds investigated in this study.
All the z0 values estimated for the phosphate rock
and dolomitic limestone particles fell within the range of values suggested by Schubert (1981), i.e., 4 × 10⁻¹⁰ m < z0 < 4 × 10⁻⁸ m.
The dependence of the adhesion force on particle diameter increased as sphericity of the powdery material increased.
The adhesion force increased nonlinearly with the increase in angular press-on speeds on the phosphate rock and dolomitic limestone particles.
ACKNOWLEDGMENTS
The authors gratefully acknowledge the financial support received from CAPES (Brazil) for this work.
NOMENCLATURE
d c Distance between the
surface of the sample and the shaft of the rotor
L
dp Particle diameter L
Fadhesio Adhesion force M L t-2
Fc Capillary force M L t-2
Fcentrifugal Centrifugal force M L t-2
Fe Electrostatic force M L t-2
Fvdw van der Waals force M L t-2
H Hamaker’s constant M L2 t-2
k Constant of Equations (9) to (13)
(-)
k1 Parameter of equations (10)
and (13)
(-)
k2 Parameter of the equation (-)
M Mean particle mass M
RH Relative air humidity (-)
Vp Particle volume L3
z0 Distance of effective
separation between surfaces
L
φ Sphericity of the particle (-)
ωd Angular speed T
-1
σg Geometric standard
deviation
(-)
ρP Particle density ML
-3
REFERENCES
Aguiar, M. L., Filtração de gases em filtros de tecido: deposição e remoção da camada de pó formada. Ph.D. Thesis, Universidade Federal de São Carlos (1995).
Ahrens, F., Patterson, T., Mueller, S., Hojjatie, B., Investigation of paper dryer picking, web transfer and quality issues using a new web adhesion and drying simulator. Braz. J. Chem. Eng., 22 (2), 217-225 (2005).
Banda, S. G., Desenvolvimento de uma metodologia experimental, para determinar a força de adesão entre partículas e uma superfície plana, utilizando a técnica centrífuga. MSc. Dissertation, Universidade Federal de São Carlos (2002).
Boehme, G., Krupp, H., Rabenhorst, H. And Sandstede G., Adhesion measurements involving small particles, Trans. Inst. Chem. Eng., 40, 252-259 (1962).
Booth, S. W. & Newton, J.M., Experimental investigation of adhesion between powders and surfaces, Journal of Pharmaceutical and Pharmacology., 39, 679-684 (1987).
Bowden, F. P. & Tabor, D., The Friction and lubrication of solids, Part. 1. Oxford University Press, London, (1950).
Corn, M., The adhesion of solid particles to solid surfaces, I. A review, J. Air Pollution Control Assoc., 11, 523-528 (1961).
Flemming, H. C., Griebe, T. and Schaule, G., Antifouling strategies in technical systems - a short review, Water Science and Technology, vol. 34 (5-6), 517-524 (1996).
Kordecki, M. C. & Orr, C. Adhesion of solid particles to solid-surfaces, Archives of environmental health, 1, 1-9 (1960).
Krupp, H. Adv. Coll. Interface Science, 1, 111-239 (1967).
Lee, M. H. & Jaffe, A. B. Em Mittal K. L. (ed), Particles on Surfaces I Plenum Press, New York, 169 (1988).
Li, W.; Perzl, M.; Heyder, J.; Langer, R.; Brain, J. D.; Englmeier, K.H.; Niven, R.W., Edwards; D. A. Aerodynamics and aerosol particle deggregation phenomena in model oral-pharyngeal cavities, Journal of Aerosol Science, 27 (8), 1269-1286 (1996).
Podczeck, F.; Newton, J. M.; James, M.B., The influence of constant and changing relative humidity of the air on the autoadhesion force between pharmaceutical powder particles, International Journal of Pharm., 145, 221-229 (1996).
Schubert, H, Principles of Agglomeration, Int. Chem. Eng., 21 (3), 363-371 (1981).
Siegel, S.; Hanus, E. J. and Carr, J.W., Polytetrafluorethylene types tabled punches, Journal of Pharmaceutical Sciences, 52 (6), 604 (1963). Silva, C. R. N.; Negrini, V.S.; Aguiar, M. L. and
Coury, J. R., Influence of gas velocity on cake formation and detachment, Powder Technology, vol. 101, 165-172 (1999).
Soltani, M. & Ahmadi, G.,Particle Detachment from Rough Surfaces in Turbulent Flows. The Journal of Adhesion, vol. 51 (1-4), 105-123 (1995). Stewart, P. J. Particle interaction in pharmaceutical
systems. Pharm. Int., vol. 7, 146-149 (1986). Weiner, J. J.; Kokosinski, J.; Cook, M. R. and
Grunze, M., MITTAL K. L. (ed), Particles and Surfaces I, Plenum Press, New York, vol. 69 (1988).
Zimon, A. D., Adhesion of Dust and Powders, Consultants Bureau, New York, 109-125 (1982). Zhou, S. A., On forces in microelectromechanical
systems, International Journal of Engineering Science, vol. 41 (3-5), 313-335 (2003).