Obtaining and Characterization of W-Cu Composite Powder Produced by Mixing and
Sintering of Ammonium Paratungstate (Apt) and Copper Nitrate
Maria José Santos Limaa*, Fernando Erick Santos da Silvab, Maria Veronilda Macedo Soutoa,
Meysam Mashhadikarimia, Ariadne Sousa Silvaa, Uilame Umbelino Gomesa,
Carlson Pereira de Souzab
Received: December 12, 2016; Revised: April 11, 2017; Accepted: April 21, 2017
The objective of this work is obtaining W-30 wt% Cu composite powder from ammonium paratungstate hydrated (APT) and hydrated copper nitrate and investigating the inluence of some production process parameters of W- 30 wt% Cu in particles form which results in high sinterability and densiication of W-30 wt% Cu composite. To achieve this objective, the powder was obtained by manually mixing the APT and copper nitrate and reducing under a hydrogen atmosphere at 800 °C and then compacting at 500 MPa and sintering in a tubular furnace at 1200 °C for 60 minutes. The obtained materials were characterized by XRD, SEM, EDS, particle size analysis, density and microhardness measurements. The composite powder showed a good homogenization of Cu in W with very ine and agglomerated particles and a mean crystallite size of 25.64 nm. SEM coupled with EDS with mapping analysis revealed a homogeneous distribution of Cu and W in the sintered sample. The composite had a relative density of 96.77% and a microhardness of 523.66 HV. Therefore the method of obtaining the composite powder is feasible to sinter W-30 wt% Cu powder due to a greater dispersion and homogenization of phases and the average particle size.
Keywords: Composite W-Cu, Ammonium Paratungstate, Copper Nitrate
* e-mail: [email protected]
1. Introduction
Tungsten and Copper (W-Cu) composites are widely used for electrical and thermal purposes such as heat sinks and electrical contacts. The combination of excellent thermal and electrical conductivity with low thermal expansion coeicient provides a variety of applications in electronics, electromechanical, military, and aerospace and other industries.
For a material to be used as an electrical contact, it must have properties such as high electrical conductivity, high thermal conductivity, chemical stability and high voltaic arc resistance. This material is produced by Powder Metallurgy, usually from metallic copper (Cu) and tungsten (W). The W-Cu composite powder can be obtained by various processes, such as: manual mixing, mixing in a conventional ball milling GOMES et al., 20001, 20012 and high energy milling that uses high energy milling to form particles of W-Cu composite powders, MOON et al., 19973; COSTA et al. 20004, 20025.
The properties of these powders are dependent on their composition, characteristics of the starting powders and mainly manufacturing process. Thus, particle size, shape
and distribution of W phase, microstructure homogeneity and amount of pores afect the electrical, mechanical and thermal properties of composite material. According to Chen et al. 20056, microstructure reinement is of great importance to improve the performance of contact materials, including mechanical strength and electrical conductivity.
According to Moon et al., 1997, despite the low sinterability of Composite W-Cu, it is possible to obtain a structure with high structural homogeneity and a density close to theoretical density by using a W-Cu powder formed by W and Cu composite particles. Therefore, the densiication of the W-Cu composite is directly related to dispersion of tungsten and copper by obtaining W-Cu composite particles and sintering the same.
The objective of this work is obtaining W-30 wt% Cu composite powder from ammonium paratungstate hydrated (APT) and hydrated copper nitrate and investigating the inluence of some production process parameters of W- 30 wt% Cu in particles form which results in high sinterability and densiication of W-30 wt% Cu composite. To achieve this objective, the powder was obtained by manually mixing the APT and copper nitrate and reducing under a hydrogen atmosphere at 800 ° C and then compacting at 500 MPa and sintering in a tubular furnace at 1200 °C for 60 minutes. The a Programa de Pós-Graduação em Ciência e Engenharia de Materiais, Universidade Federal do Rio
Grande do Norte - UFRN, Campus Universitário, 59072-970, Natal, RN, Brazil.
b Departamento de Engenharia Química, Universidade Federal do Rio Grande do Norte - UFRN,
obtained materials were characterized by XRD, SEM, EDS and particle size analysis. The density of sintered sample and the inal structure were observed through density measurements according the Geometric density and by optical microscopy and scanning electron microscopy, respectively.
2. Methodology
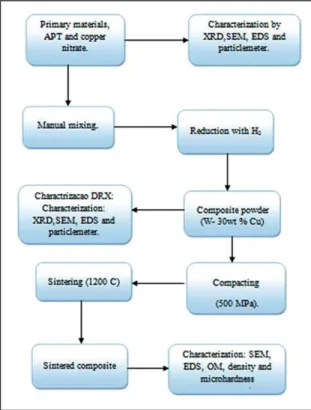
The procedures used in this work were characterization of the starting powders, preparation of the powders by manual mixing and reduction, characterization the prepared mixture, compaction, sintering and characterization of the sintered structures.
Figure 1 show in detail all procedures were used throughout this work.
ml/sec. Gas low was kept until the furnace cooled to 500 °C and tehn Argon low was used to room temperature in order to avoid oxidation. These powders were characterized by XRD, SEM, EDS, particle size analysis and crystallite size measurement by Scherrer.
2.2. Powder compacting
Cylindrical samples with 5mm diameter and 3 to 4mm thickness were prepared for sintering. These samples were uniaxially compacted in a 5 mm diameter steel mold using a single section press with pressures of 500 MPa.
2.3. Sintering
The green samples were sintered in a tubular furnace under an argon atmosphere with 10 ml/sec low at 1200 °C. Heating rate was 10 °C/min and samples were isothermally held 60 minutes. The samples were cooled in the furnace to room temperature and then the sintered bodies were characterized by OM, SEM and EDS. Density measurements and microhardness Vickers (HV) were also realized.
3. Results and Discussion
3.1. Starting powder analysis
APT thermogravimetric analysis
The thermogravimetric analysis of the APT was performed, which is shown in igure 2. It shows a mass loss of approximately 10%. It can be seen in Figure 2 that the inal amount after calcination is about 90%. The irst mass loss occurs near 110 °C (point 1) for the dehydration of the complex. The second mass loss related to the evaporation of the ammonia molecules (NH3) occurs after 110 °C to near 220 °C (between points 1 and 2), decomposition of APT starts from 220 °C (point 3), between 260 and 280 °C (between points 3 and 4) there is a signiicant mass loss due to simultaneous evaporation of water and ammonia. The fourth mass loss occurs from 350 °C to approximately 500 °C, in this stage, only the evaporation of last residue ammonia occurs. From 500 °C no mass loss occurs, showing that from this temperature, APT reaches its thermal stability and no further reaction occurs, a fact that can lead to a decrease in APT to tungsten (W) reduction temperature.
Particle size analysis of APT
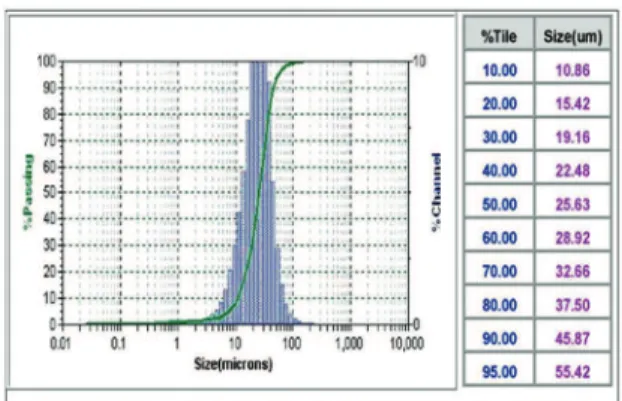
Figure 3 shows the particle size distribution curve and APT particle size in diferent proportions with a unimodal distribution which has a mean diameter distribution by volume (MV of 28.63 mm). Through the analysis of particle size coupled to the micrograph performed for APT, the irregularity in particle size can be conirmed.
Figure 1. Process lowchart for obtaining the W-30%p.Cu composites.
2.1. Preparation of W-Cu composite powder
Figure 2. APT thermogravimetric analysis Curve
Figure 3. Particle size distribution curve and mean diameter
distribution by volume of the APT particles.
Morphological analysis of APT
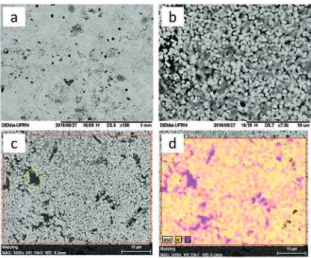
SEM morphology of the APT, shown in Figure 4 (a) and 4 (b), presents particles with very irregular geometric shapes having diferent sizes and shapes, some in cube form, others in hexagon form and a large varieties with irregular forms. Many particles are agglomerated, with a smooth surface and a low surface roughness. They also have few pores and some cracks as shown in Figures 2 (a) and 3 (b).
3.2. Analysis of W-30% wt cu composite
powder
Particle size analysis of W-30 wt% Cu composite powder
Figure 5 shows the particle size of W-30 wt% Cu, distribution curve tends to a normal distribution and particle sizes in different proportions has a mean distribution diameter by volume of 14.82 mm. Through this analysis it can be seen that there was a good refinment in particle size after reduction compared to the initial APT powder.
Morphological analysis of the W-30 wt% Cu composite powder
Figure 6(a) shows morphology of W-30 wt% Cu composite powder with different shapes, very small particle sizes and larger particle sizes formed by agglomeration. This agglomeration is a characteristic of very fine particles that tend to agglomerate and form large agglomerates. These larger particles are formed by agglomeration of small W-Cu composite particles. Although they seem to be very solid, they are easily fragmented. Figure 6(a) is a mapping analysis of W-30 wt% Cu obtained through EDS. It can be seen that there is good dispersion of Cu (green) in W (red) despite using high energy milling for obtaining powders.
X-ray diffraction analysis of the W-30 wt% Cu composite powder
The X-ray diffraction in Figure 7 shows only the characteristic peaks of W and Cu. Therefore, impurities in the powder are discharged, showing that the reduction process was effective and confirming it was possible to obtain the desired composite.
The average crystallite size of the composite powder was calculated by the Scherrer equation which revealed an average size of 25.64 nm, a fact that confirming the presence of nanometric composite powder.
Figure 5. Particle size distribution curve and mean diameter
distribution by volume of W-30 wt% Cu composite particles.
Figure 6. (A) SEM micrograph of W-30 wt% Cu composite powder and (b) EDS mapping
Figure 7. X-ray difraction of W-30 wt% Cu composite powder.
Figure 8. (a) Optical micrograph of W-30 wt% Cu composite at
diferent magniications.
Figure 9. SEM micrograph of W-30 wt% Cu (a) 100x and (b) 7000x
and (c and d) Mapping by EDS.
Table 1. Percentage of components in W-30 wt% Cu by EDS.
ELEMENTS WEIGHT (%)
WEIGHT
(%) Σ ATOMIC (%)
Copper 43,13 46,13 71,84
Tungsten 48,91 53,14 28,16
Total 92,04 100 100
3.3. Analysis of W-30 wt% cu sintered composite
Analysis by optical microscopy
Fig. 8(a) and 8(b) are optical microscopy micrographs of the sintered sample. In Fig. 8(a), it is possible to observe a sintered body without cracks and with few pores as well as a good copper dispersion in the system. Figure 8(b) shows some copper particles dispersed in W-Cu system. Through these optical micrographs it can be seen that the composite is well densiied. This fact was conirmed by geometric density measurement, presenting a relative density of 96.77%. Such high densiication of the sintered sample occurred above copper melting point (1200 °C), is related to the rearrangement of crystallites caused by exiting the copper from composite particles to ill the surrounding porosity when the temperature approaches its melting point and by appearance of liquid copper phase as it melts. Filling inter-particles porosity by copper increases the density.
Scanning Electron Microscopy Analysis
Density and microhardness measurements
The evaluated properties in this study were density and microhardness. The microhardness value was obtained using 500 gf load and 15 seconds dwell time. Three random measurements were performed and the inal result was the average of them. Finally, the sample presented a microhardness value of 236 HV.
Density of sintered composite was measured using geometry method. The results showed a density of 13.35 g/cm3, close to the theoretical density, with relative density of 96.78%.
4. Conclusion
The obtaining of the W-30 wt% Cu composite powder from APT and copper nitrate favored its sintering due to good phase dispersion and the powder particle size as well as its crystallite size of 25.64 nm. The result showed that the density of produced W-30 wt% Cu may reach very close to theoretical density when sintered at 1200 °C. The microstructural analysis by SEM shows that Cu ills the voids and forms some copper rich regions. Therefore, it is possible to obtain a homogeneous structure with a density close to the theoretical density when the W-30 wt% Cu powder is obtained from APT and copper nitrate without a previous reining.
5. Acknowledgments
Post-Graduate Program in Materials Science and Engineering - PPGCEM;
Federal University of Rio Grande do Norte- UFRN; Ceramic Materials and Special Metals Laboratory - LMCME;
Nanostructured Materials and Catalytic Reactors Laboratory - LAMNRC;
Science and Technology Foundation Support of Pernambuco State - FACEPE
Strategic Technologies Center of Northeast – CETENE
6. References
1. Gomes UU, Costa FA, Silva AGP. Inluence of the dispersion
technique on the formation of the W-Cu powder and on the
sintering kinetics of W-Cu composite alloys. In: 7th Annual
International Conference on Composites Engineering; 2000
Jul 2-8; Denver, CO, USA. p. 281-282.
2. Gomes UU, Costa FA, Silva AGP. On sintering of W-Cu composite
alloys. In: Proceedings of the 15th International Plansee Seminar.
Reutte: Plansee; 2001. p. 177-189.
3. Moon IH, Ryu SS, Kim JC. Sintering behaviour of mechanical
alloyed W-Cu composite powder. In: Proceedings of the
14th International Plansee Seminar. Reutte: Plansee; 1997. p. 16-26.
4. Costa FA, Silva AGP, Gomes UU. Inluência da dispersão dos pós de W e Cu no processo de sinterização do compósito W-Cu
realizado em moinho planetário. In: I Congresso Nacional de
Engenharia Mecânica; 2000 Ago 7-11; Natal, RN, Brazil. p.
306-314.
5. Costa FA, Ambrozio Filho F, Silva AGP, Gomes UU. Efeito da
moagem de alta energia, realizada em moinho planetário, na
sinterização do compósito W-Cu. In: II Congresso Nacional
de Engenharia Mecânica; 2002 Ago 12-16; João Pessoa,
PB, Brazil. p. 1-10.
6. Chen W, Kan Z, Ding B. Preparation and Arc Breakdown Behavior
of Nanocrystalline W-Cu Electrical Contact Materials. Journal