Artigo
*e-mail: [email protected]
SELECTIVE HYDROGENOLYSIS OF GLYCEROL TO PROPYLENE GLYCOL IN A CONTINUOUS FLOW TRICKLE BED REACTOR USING COPPER CHROMITE AND Cu/Al2O3 CATALYSTS
Jorge Sepúlvedaa, Debora Manualea, Lucia Santiagoa, Nicolás Carraraa, Gerardo Torresa Carlos Veraa, Maraisa Goncalvesb,c,
Wagner Carvalhob and Dalmo Mandellib,*
aInstituto de Investigaciones en Catálisis y Petroquímica – INCAPE (UNL-CONICET), Santiago del Estero 2654, 3000 Santa Fe, Argentina
bCentro de Ciencias Naturais e Humanas, Universidade Federal do ABC, Rua Santa Adelia, 166, 09210-070 Santo Andre – SP, Brasil cUniversidade Federal de São Paulo, Instituto de Ciencias e Tecnologia, Rua Talim 330, São Jose dos Campos – SP, Brasil
Recebido em 26/07/2016; aceito em 26/12/2016; publicado na web em 14/02/2017
SELECTIVE HYDROGENOLYSIS OF GLYCEROL TO PROPYLENE GLYCOL IN A CONTINUOUS FLOW TRICKLE BED REACTOR USING COPPER CHROMITE AND Cu/Al2O3 CATALYSTS. The glycerol hydrogenolysis reaction was performed in a continuous low trickle bed reactor using a water glycerol feed and both copper chromite and Cu/Al2O3 catalysts. The commercial copper chromite had a higher activity than the laboratory prepared Cu/Al2O3 and was used for most of the tests. Propylene glycol was the main product with both catalysts, acetol being the main by-product. It was found that temperature is the main variable inluencing the conversion of glycerol. When the state of the glycerol-water reactant mixture was completely liquid, at temperatures lower than 190 °C, conversion was low and deactivation was observed. At reaction temperatures of 210-230 °C the conversion of glycerol was complete and the selectivity to propylene glycol was stable at about 60-80% all throughout the reaction time span of 10 h, regardless of the hydrogen pressure level (1 to 20 atm). These optimal values could not be improved signiicantly by using other different reaction conditions or increasing the catalyst acidity. At higher temperatures (245-250 °C) the conversion was also 100%. Under reaction conditions at which copper chromite suffered deactivation, light by-products and surface deposits were formed. The deposits could be completely burned at 250 °C and the catalyst activity fully recovered.
Keywords: hydrogenolysis; copper chromite; glycerol conversion.
INTRODUCTION
The hydrogenolysis of glycerol to 1,2 propanediol (propylene glycol) and hydroxyacetone (acetol) is an important reaction from academic and industrial points of view. Many catalysts have been tried and the reaction has been performed both in the liquid and the vapor phase.1 Glycerol can be dehydrated to acrolein over acidic catalysts such as zeolites, heteropolyacids or sulfuric acid. Also, the glycerol can be dehydrated to acetol, e.g. over metal copper catalysts. In the presence of hydrogen however, glycerol can undergo hydrogenolysis to 1,2 and 1,3-propanediol. Copper containing catalysts of different composition are good catalysts for this purpose because of their poor hydrogenolytic activity toward C-C bonds and their eficient activity for hydrogenation or dehydrogenation of the C-O bond.2,3
Most of literature works indicate that the system eficiency is highly determined by the catalyst type, temperature, hydrogen pres-sure, residence time and glycerol content of the aqueous solution used as feed.
Copper-chromite has been identiied as the most effective cata-lyst for the hydrogenolysis of glycerol to propylene glycol in batch systems. Dasari and coworkers found that at mild reaction conditions of 200 °C and 14 atm of hydrogen pressure and 80% glycerol aque-ous solution yielded a 55% glycerol conversion and selectivity to propylene glycol of 85%. At similar reaction conditions, but using a 5% Pd/carbon catalyst, the conversion was only 5% and the selectivity 72%.2 Zhou and coworkers used a Cu-ZnO-Al2O3 catalyst in a reac-tion at 220 °C and 40 atm of hydrogen pressure and the selectivity to propylene glycol reached was 72-94 depending on the Cu:Zn:Al ratios of the catalyst.4 Yuanand coworkersreported the use of Cu/
MgO at 30 atm and 180 °C with the conversion of glycerol varying between 22 to 82% and selectivity between 87 and 96%.5 Ni-Ce/C was also used in the reaction at 50 atm hydrogen pressure and 200 °C. The conversion under these conditions was 90% and the selectivity to propylene glycol was 66%.6 With CuO/SiO
2 at 180 °C and 80 atm hydrogen pressure, the selectivity to propylene glycol was reported to be 90% and the conversion 25-30%.7 Some authors have performed the hydrogenolysis of glycerol in two steps and over copper catalysts.8 Some others have used acid materials as co-catalysts. For example reports exist on the use of several catalysts such as ion-exchange resins combined with Ru/C, Ru/C with niobia, 12-tungstophosphoric acid (TPA) supported on zirconia, HZSM5 and Cu/Al2O3. 9-13
The objective of this work was to study the inluence of some reaction conditions on the activity, selectivity and stability of copper chromite and Cu/Al2O3 catalysts in the glycerol hydrogenolysis reac-tion. The reactions were performed in a packed trickle-bed reactor at conditions close to real industrial ones.
EXPERIMENTAL PART
Catalysts materials
The copper chromite catalyst had a reported structure of cop-per Chromite and was supplied by Harshaw (CU-1808 T,density 1.1 gcm-3, Cu content 35%).14 A Cu/Al
0.49 cm3 g−1 and the average pore radius 5.4 nm.
Copper was incorporated into the alumina by incipient wetness impregnation with a Cu(NO3)2 aqueous solution. The concentration and volume of the impregnating solution were adjusted in order to give a inal copper content of 13%, 25% and 44% in the inal catalyst. However, the materials with lower copper content (13%) showed better catalyst activity than others materials, with higher selectivity to 1,2-PDO. Therefore, in this work, are only presented results with 13% of copper content.
Catalysts characterization
The crystalline structure of the catalyst was assessed by X-ray diffraction. Spectra were recorded in a Shimadzu XD-1 equipment, using CuK radiation iltered with Ni. Temperature programmed oxidation (TPO) tests were performed in order to characterize the surface carbon deposits formed during the reaction. A continuous low of a He:O2 (5%) mixture was passed over the catalyst, while irst keeping the temperature at 250 °C for 16 min and then heating at a rate of 16 °C min-1. Oxidation products (CO, CO
2) were sent to a methanation reactor loaded with a Ni/kieselghur catalyst, and then to a lame ionization detector.15 The FID signal was continu-ously recorded in a computer. The amount and strength of the acid sites were assessed by temperature programmed desorption of pyridine. The samples were irst immersed in an excess volume of pyridine (Merck, 99%) at room temperature for 6 h. Then they were iltered and dried in air in an open vial at room temperature and under a fume hood. The samples were then placed in a quartz microreactor and stabilized in N2 for 1 h at 100 °C and heated from this temperature to 650 °C at 10 °C min-1. The desorbed products were continuously analyzed in a FID detector. The speciic surface area was measured by means of nitrogen adsorption at -196 °C in a Micromeritics Accusorb 2100E.
Glycerol conversion reactions
The reaction was performed in a trickle-bed reactor. The scheme is showed in Figure 1.
The catalyst was placed over a quartz wool plug placed in the middle of the reactor. The catalyst was irst reduced in situ at 250 °C in hydrogen for 1 h. Then an aqueous solution of glycerol of 25 or 80% mass concentration was fed to the reactor in a down low fashion at lowrate values of 4.8 cm3 h-1 to 18 cm3 h-1. Hydrogen was fed to the reactor by means of a Cole-Parmer mass low controller (48 ml min-1) and the pressure was regulated at 1, 5, 18 and 20 atm
with a Swagelok spring loaded backpressure controller. The reaction products were cooled down in a condenser and the gas and liquid products were separated in a pressurized gas-liquid separator vessel upstream the backpressure controller.
In each catalytic test, 2 and 4 g of catalyst (35-80 mesh of particle size) were used, and the temperature was varied between 190 and 250 °C. The reaction products were sampled periodically and ana-lyzed off-line in a Shimadzu 2014 gas chromatograph equipped with a lame ionization detector and a capillary column (J&W INNOWax 19091N-213, 30 m length, 0.25 mm ID, 0.5 micron ilm thickness).
RESULTS AND DISCUSSION
Catalyst characterization
The structure of copper chromite was conirmed by means of X-ray diffraction. X-ray diffractograms can be seen in Figure 2. The diffractograms of the material reduced at 250 ºC, before and after the reaction, presented no differences indicating that no changes in the crystal habitat or the degree of crystallinity occurred during calcination or reaction. Peaks due to metallic copper were found at 2θ= 43°, 51° and 75°. A peak at 36.5° due to the Delafasite phase (CuCrO2) was found and a peak at 26.5° was addressed to carbon, possibly related to the decomposition of the catalyst binder during calcinations.16, 17
Pyridine thermal desorption was used to assess the concentration and strength of the surface acid sites of the catalysts.18
Total acidity was calculated from the total area of the Temperature programmed desorption (TPD) trace. Sites were clas-siied into weak acid sites (desorbing between 150-300 °C), mild acid sites (desorbing between 300-500 °C) and strong acid sites (desorbing at temperatures higher than 500 °C). Copper chromite had a total amount of acid sites of 0.31 mmol g-1. This is similar to the values reported by Mane et al.19 for copper chromite and by Romero et al.,20 both using ammonia TPD. Distribution of strength was concentrated on mild acidity (66%), the rest being weak (29%) and strong (5%). In the case of the pure alumina support the total acidity was 0.23 mmol g-1. Most of the sites were weak ones (82%) and mild ones (18%). The amount of strong acid sites was negli-gible. Addition of copper to the alumina support mainly increased the concentration of mild acid sites. The total amount of acid sites was 0.28 mmol g-1, distributed into weak acid sites (22%), mild acid sites (72%) and strong acid sites (4%).
Figure 1. Schemeof the reaction equipment. (1) Liquid feedstock reservoir;
(2) High pressure metering pump; (3) Manometer; (4) Mass flow controller; (5) Reactor and furnace; (6) Temperature controller and display; (7) Cooler/ condenser; (8) High pressure gas-liquid separator; (9) Backpressure regulator. CW: cooling water
Catalytic activity
Hydrogenolysis of glycerol is known to be a bifunctional reaction. It has been shown that the irst step is the dehydration of glycerol to acetol over an acid site. The second step would be the hydrogenation of acetol over a metal site.2 The dehydration of alcohols is favored at high temperatures and is catalyzed by acid sites. In the case of the dehydration of glycerol the reaction occurs between 160 and 320 ºC. When strong solid acids (in the Hammet Ho range of -8.2 < Ho < -3.0) and temperatures higher than 260 ºC are used dehydration proceeds with the formation of acrolein, i.e. the OH group of the central carbon is removed. Lauriol-Garbayand coworkers reported dehydrated glycerol selectively to acrolein at 300 ºC in the gas phase using a mixture of zirconium and niobium oxides as catalyst.18 Haider and coworkers dehydrated glycerol to acrolein at 270-300 ºC using Ru heteropolyacid catalysts.21 The dehydration of glycerol at differ-ent temperature also reported by Jiaand coworkers using a ZSM-5 catalysts at 320 ºC22 and Dalla Costa and coworkers using beta zeolite catalysts at 275 ºC.23
When the objective is to form propylene glycol from glycerol the reaction conditions needed are less energic than those for acrolein or acetol formation. Copper chromite is the most studied catalyst. It has suficient surface acid sites to catalyze the glycerol dehydration to acetol,24 and some works have indicated that the acidity of cop-per chromite is increased at higher chromium contents.25 Romero and coworkers measured the amount and strength of acid sites of copper chromite by ammonia TPD and found that the samples de-sorbed ammonia between 150-400 ºC.20 Using the same technique Maneand coworkers found that 60% of the ammonia desorbed between 200-400 ºC and that 25% was desorbed from strong acid sites at higher temperatures.19 From these reports it can be inferred that acidity promoters and acid co-catalysts enhance the global reaction rate.26,27 Balarajuand coworkers report that there exists a linear relation between the total acidity of the solid acid catalysts and the glycerol conversion. The same authors found that at 180 °C and 60 atm hydrogen pressure the addition of niobia to a Ru/C base catalyst of moderate acidity increases the total acidity and the resulting activity.12 Miyazawaand coworkers studied the hydroge-nolysis of glycerol at 160 °C and 60 atm hydrogen pressure using an Amberlyst ionic exchange resin as co-catalyst. They found that the use of Ru/C and this resin co-catalyst improved the conversion and selectivity to propylene glycol (60% conversion, 11% selectiv-ity to propylene glycol). The synergic effect between the metal and the acid support or acid co-catalyst was explained by Miyazawa, who proposed that acetol was formed as an intermediate on the acid sites.28,29
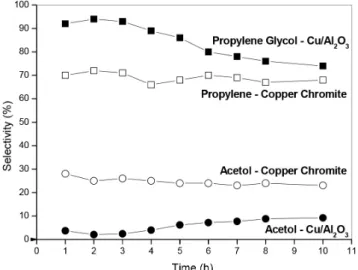
Figure 3 shows the results of catalytic activity at 220 °C and 18 atm of hydrogen pressure.
The conversion level was 100% throughout the whole reaction time (0-10 h). Though no activity changes were observed, selectiv-ity changes were indeed detected. In Figure 3 it can be seen that the selectivity to propylene glycol (desired) at the beginning of the reac-tion is higher on Cu/Al2O3 (90%) than on copper chromite (70%). The selectivity of Cu/Al2O3 to propylene glycol is reduced to 75% after 10 h but the selectivity on copper chromite is completely stable at 70%. Acetol is almost the only other product and in this sense its selectivity variation is inverse to that of propylene glycol. The se-lectivity to acetol is much higher on Cu/Al2O3 is low (4-8%) during the reaction. On copper chromite the selectivity to acetol is stable at 30% throughout the entire run.
Other glycerol dehydration tests were performed using nitrogen as gas carrier instead of hydrogen. At 210 °C the copper chromite catalyst had a 5% yield for acetol while Cu/Al2O3 had 8%.
Influence of the reaction temperature
Recalling that the hydrogenolysis of glycerol proceeds by two consecutive steps, dehydration and hydrogenation, it can be inferred that the dehydration is favored at higher temperatures while hydroge-nation is not. For dehydration there is mainly a kinetic effect due to the relatively high activation energy. In the case of dehydrogenation there is a thermodynamic effect mainly related to the exothermicity of the reaction. Dehydrogenation would be favored at low temperatures and high hydrogen pressure. There is, in consequence, an optimal temperature at which dehydration proceeds with a non-negligible rate and at which dehydrogenation is not very inhibited. 8, 30
The conversion of glycerol over copper chromite was irst stu-died as a function of temperature at 18 atm of hydrogen pressure (see Figure 4).
At 190 ºC and 18 atm hydrogen pressure a 25% conversion of glycerol and 79% selectivity to propylene glycol were found. When the reaction temperature was raised to 210 °C a great increase of conversion is seen, though the selectivity to propylene glycol remains constant. The activity, selectivity and stability of the catalyst are
Figure 3. Selectivity to propylene glycol and acetol when using Cu/Al2O3
and copper chromite at 220 ºC and 14 atm of total hydrogen pressure. The conversion of glycerol is kept at 100% during the reaction time
Figure 4. Reaction of glycerol (25%, aqueous solution) catalyzed by copper
strongly dependent on the physical state of the reactant and products under the reaction conditions.
Table 1 summarizes the properties of the liquid and gas phases in the reactor.
The physical (liquid or gas) states were inferred from vapor pressure equilibrium data for the pure compounds, as calculated with the HySys software (NRTL model). The increase in conversion upon the increase in temperature (to 220 °C) can be due to change of state of the water-glycerol reacting mixture from the liquid to the vapor state. In the vapor state the accessibility of the catalyst surface is increased due to the higher diffusivity of the reactants in the vapor phase.
In the 220-245 °C temperature range no change in the physical state of the reaction mixture is expected and both molecules are in the vapor state. At the reaction temperature of 245 °C the conversion of glycerol is stable at 100% but extensive changes in selectivity, as a function of reaction time, can be detected. The results in Figure 5 indicate that during the run the selectivity to propylene glycol is drastically reduced while the production of 1-propanol is increased to almost 40%. The selectivity to acetol does not change. Nakagawa and coworkers proposed a route in which propylene glycol form 1-propanol, a product of over-hydrogenolysis.31
Hydrogen pressure effects
An inspection of the literature indicates that the inluence of hydrogen pressure can be very different depending on the values of the rest of the reaction variables. For example at 240 °C and using a copper catalyst an almost linear relation is found between hydrogen pressure and initial conversion of glycerol.32 In attention to these
reported results a temperature range (190, 220 and 245 °C) was chosen in order to study the effect of the hydrogen pressure.
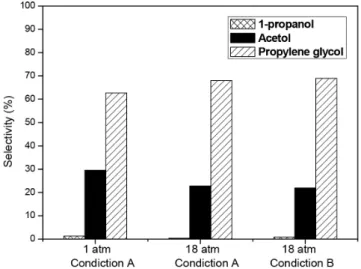
Figure 6 contains the results of catalytic activity and selectiv-ity as a function of hydrogen pressure (1 and 18 atm), at 220 °C, a time-on-stream of 10 h and two values of space velocity (WHSV of 0.7 and 2.1 h-1).
These results can be considered as representative of the activity pattern which was almost the same to others values. The conversion of glycerol was always complete (100%) either at the beginning of the reaction or after 10 hours. The main products were propylene glycol and acetol, with recorded selectivities of 63-68% and 0.3-1.3%, respectively. The selectivity to propylene glycol was improved by increasing the hydrogen pressure while the opposite occurred with acetol. This conirms that acetol is an intermediate product of the reaction; i.e. glycerol is dehydrated to acetol and then acetol is hydrogenated to propylene glycol.28
The results at 220 °C only indicate a mild effect of hydrogen pressure, improving the selectivity to propylene glycol. The effect of hydrogen is not to sustain the activity, since total conversion can be seen at widely different pressure conditions. With respect to the physical state of the reacting mixture, this is not greatly changed by increasing the pressure. Calculations indicate that at 1 atm the reacting mixture is 100% in the vapor state and that at 18 atm the mixture is 72% vaporized.
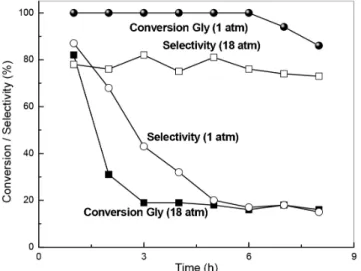
Results indicating the inluence of hydrogen pressure at a reaction temperature of 190 °C can be seen in Figure 7.
In these conditions high deactivation of the catalyst can be seen. This is be due to the low temperature leading to a reacting mixture mainly in the liquid state. At 190ºC the steam would also not be able to exert an effective stripping action of the glycerol reactant and the reaction products which then would not be able to desorb from the catalyst surface. It can also be seen that deactivation is more impor-tant at high pressure. At 18 atm and 3 h of time-on-stream only 20 % of the glycerol was converted although the selectivity to propylene glycol was about 80%. At a total pressure of 1 atm deactivation was less severe and after 6 h of time-on-stream the reaction still had a meaningful conversion level. The selectivity to propylene glycol, however, dropped to 20% after 5 h of time-on-stream. According to Table 1 at 190 °C and 18 atm total pressure glycerol is totally in the liquid phase, while at 1 atm 95% is in the vapor phase. Therefore
Table 1. Physical state of the feedstock solution (25% glycerol in water) as a function of pressure and temperature
Temperature, °C
Pressure = 1 atm Pressure = 18 atm Vapor molar
fraction State
Vapor molar
fraction State 190 0.95 Liquid-Vapor n.d. Líquid 220 1.00 Vapor 0.72 Liquid-Vapor 245 1.00 Vapor 0.88 Liquid-Vapor n.d.: not detectable.
Figure 5. Reaction of glycerol (25%, aqueous solution)catalyzed by copper
chromite at 245 °C. Selectivity to different reaction products at 18 atm hydro-gen pressure and three different values of time-on-stream (TOS)
Figure 6.Reaction of glycerol catalyzed by at 220 ºC and two different
conditions: A) 25% glycerol feed, 4.8 mL h-1 feed flowrate, 2 g of catalyst; B)
80% glycerol feed, 9 mL h-1 feed flowrate, 4 g of catalyst). Selectivity to the
we assume that the main cause of deactivation and loss of selectivity is the fouling of the catalyst surface by compounds that cannot be desorbed due to the low reaction temperature.
Finally it can be seen that no 1-propanol can be found at 190 °C among the reaction products. This indicates that over-hydrogenolysis is an activated reaction that needs higher temperatures to proceed to a meaningful extent.
Figure 8 contains results of selectivity as a function of time-on-stream, for the glycerol reaction at 245 °C (WHSV=0.71 h-1).
The selectivity values were, however, different than those of the tests at 190 or 220 °C (see Table 2, results at 18 atm). It can be seen that at 245 °C and 18 atm the selectivity to propylene glycol decreases from an initial value of 78% to a final value of 49% at 10 h. The drop in selectivity to propylene glycol is accompanied by an increase in the selectivity to 1-propanol which, for example, is 37% at 10 hour.
At 245 °C and 1 atm of hydrogen pressure both selectivities (to acetol and propylene glycol) fall sharply at high of time-on-stream dura-tions while the selectivity to 1-propanol increases until 65%. This trend is easily explained by the previously proposed mechanism. Dehydration would be much favored by the high temperature and hydrogenation would be disfavored at low hydrogen pressures, thus, acetol produc-tion is favored over that of propylene glycol under these condiproduc-tions.
The previous results would indicate that 220 °C is the optimal reaction temperature. Results obtained at 220 °C, 18 atm hydrogen pressure and different values of space velocity and reactant mixture composition can be seen in Table 2.
The reaction conditions are quite unfavorable in the case of the 80% glycerol mixture because a higher glycerol low rate reaction rate is needed for achieving a similar conversion value. Despite the
varying conditions of contact time and mixture composition, the selectivity results are very similar. In this sense, 220 °C and 18 atm hydrogen pressure seems to be a robust operation condition.
The results of this work can be compared with other reports on reactions performed in packed bed reactors. Abhari33 reacted pure glycerol (98%) in a trickle bed reactor in the presence of a nickel-tungsten catalyst under typical reining conditions of high tempera-ture and pressure, yielding propanediols and propane. Glycerol was supplied at 0.65 h-1 (LHSV) and 155 bar. At 345 ºC most of the feedstock was hydrotreated to propane though a liquid fraction (8.7 mass percentage of the feed) was also obtained. When lowering the temperature to 288 ºC, a liquid phase of 74.5% the mass of the feed (water product distilled off) was recovered and only minor amounts of gaseous propane were formed. The liquid phase contained 1,2-pro-panediol (74%) and 1,3-pro1,2-pro-panediol (5%). Casale and Gómez34 used a catalyst of CuO-ZnO-Al2O3 to react aqueous glycerol in a packed bed reactor. The hydrogen-to-glycerol molar ratio was 4:1 and the LHSV 1-1.6 h-1 and the temperature was 230-265 ºC. At these conditions conversion was 94.6-99.6% and selectivity to propylene glycol was 78-94%. Schuster and Eggersdorfer35 used a catalyst containing Cu, Co, Mn and Mo, packed in a tubular reactor, to react aqueous glycerol (86.5%), at 295 bar, 210-220 ºC, WHSV=0.07 h-1. The products were 92% 1,2-propanediol, 4.3% n-propanol, the rest being lower alcohols. Glycerol conversion was complete.
Deactivation
Temperature programmed oxidation tests were performed in order to determine whether carbonaceous deposits were formed that could
Figure 7. Hydrogenolysis of glycerol at 190 °C. Conversion and selectivity
to propylene glycol as a function of time-on-stream and system pressure. ()
Glycerol conversion, 1 atm. () Selectivity, 1 atm. () Glycerol conversion,
18 atm. () Selectivity, 18 atm
Table 2. Reaction of glycerol at 220 ºC and different values of hydrogen partial pressure (total pressure of 18 atm). Selectivity at 10 h time-on-stream. Catalyst mass of 4 g
H2 low rate, mL min-1
Glycerol low rate, mL h-1
Glycerol concentration, mass %
H2 partial pressure, atm
Selectivity to propylene glycol, %
48 4.8 25 15.4 70
48 9.0 25 13.5 65
120 4.8 25 16.8 73
48 9.0 80 13.5 64
120 9.0 80 15.9 65
Figure 8. Selectivity of products of hydrogenolysis of glycerol catalyzed
explain the deactivation detected under certain reaction conditions. In the case of copper catalysts some authors have reported that the metal function is deactivated by sintering, 36, 37 but this effect was not studied in this case.
The catalyst samples were collected after the reaction test and analyzed by TPO. The results can be seen in Figure 9.
The TPO traces have only one carbon deposit combustion peak, located at 280 °C in the case of Sample A (low pressure reaction) and at 260 °C in the case of Sample B (high pressure reaction). The area of the TPO trace of Sample B was almost one half that of Sample A. The coke contents were 3.9% and 2.6%. This indicates that the coke deposits on Sample A had a higher degree of polymerization than those of Sample B. This is normal because the higher hydrogen pressure in the case of Sample B prevents the formation of heavy coke deposits. The mechanism could be one of hydrogen activation on Cu metal sites and hydrogenation of coke precursors. The low temperature of combus-tion would indicate that in both cases the carbon deposits have a very low molecular weight, probably corresponding to light polyglycerol oligomers. In this sense, no peaks at 500-550 °C due to the combustion of aromatic, graphitic carbon could be detected.38
Some samples were also examined by ESR (electron spin resonance), however Cu+1 and Cu+2 species could not be detected. Unpaired electrons could not be detected in the used copper chromite.
The carbon deposits were easily eliminated by stopping the injection of the glycerol solution and stripping with air at the reac-tion temperature for 30 min. This indicates that, even in the case of catalytic activity decay, can be recovered by a simple regeneration procedure. One simple inspection of the catalyst particles with the naked eye indicated that they were dry, i.e. no liquid glycerol or any liquid products remained on the catalyst at the reaction temperature chosen, 220 °C.
At 190 °C the catalysts taken from the reactor after 10 h and cooled down to room temperature were wet. Their analysis by TPO produced carbon combustion traces similar to those of Figure 6. The catalyst surface is expected to be covered by either glycerol or propylene glycol, since both have boiling points higher than 190 °C. At the reaction temperature of 245 °C the catalyst after 10 h of reac-tion was dry.
CONCLUSIONS
The reaction of hydrogenolysis of glycerol to propylene glycol
Figure 9. Analysis of carbon deposits by temperature programmed oxidation.
A: Reaction at 220 °C, 1 atm. 10 h reaction time. B: Reaction at 220 °C, 18 atm, 10 h reaction time
in the temperature range of 190-245 °C does not require strong acid sites. The main products are acetol and 1,2 propylene glycol.
Reaction temperature is the main variable affecting the activity, selectivity and stability of copper chromite catalysts for glycerol hydrogenolysis.
Catalytic activity and selectivity at a reaction temperature of 220 °C are not affected by the hydrogen pressure or the hydrogen-to-glycerol ratio. At this temperature the surface of the catalyst is essentially dry (free of non-desorbed reactants or products) and the selectivity to propylene glycol is 63-68%.
At 190 °C the catalyst surface is covered by glycerol and its reac-tion products and hydrogen partial pressure becomes an important variable. The catalyst deactivates and the deactivation is enhanced at higher pressures. Selectivity to propylene glycol is about 80% at 18 atm.
At 245 °C hydrogen pressure has a positive inluence on the se-lectivity to 1,2-propanodiol, being 50% at 18 atm and 10% at 1 atm at the end of the run. At this temperature the selectivity to 1-propanol is much favored (70% at 1 atm).
The TPO experiments indicate that at these reaction conditions (1-18 atm, 190-245 °C) no graphitized coke is formed on the surface of the copper chromite catalysts. Polyglycerol oligomers of low combustion temperature seem to be the prevailing species.
ACKNOWLEDGEMENTS
The authors thank the inancial support of CAPES (Brazil) and MinCyT (Argentina) (CAPES/MINCyT 208/12) and FAPESP (2011/22264-4).
REFERENCES
1. Bienholz, A.; Hofmann, H.; Claus, P.; Appl. Catal. A2011, 391, 153. 2. Dasari, M. A.; Kiatsimkul, P.; Sutterlin, W. R.; Suppes, G. J.; Appl.
Catal. A2005, 281, 225.
3. Montassier, C.; Giraud, D.; Barbier, J.; Stud. Surf. Sci. Catal.1988, 41, 165.
4. Zhou, Z.; Li, X.; Zeng, T.; Hong W.; Cheng Z.; Yuan, W.; Chin. J. Chem. Eng. 2010, 18, 384.
5. Yuan, Z.; Wang, J.; Wang, L.; Xie, W.; Chen, P.; Hou, Z.; Bioresou.
Technol. 2010, 101, 7088.
6. Yu, W.; Zhao, J.; Ma H.; Miao, H.; Song, Q.; Xu J.; Appl. Catal., A
2010, 383,73.
7. Huang, Z.; Cui, F.; Kang, H.; Chen, J.; Xia, C.; Appl. Catal., A 2009,
366,288.
8. Sato, S.; Akiyama, M.; Takahashi, R.; Hara, T.; Inui, K.; Yokota, M.;
Appl. Catal., A 2008, 347,186.
9. Sun, D.; Yamada, Y.; Sato, S.; Ueda, W.; Appl. Catal., B 2016, 193, 75.
10. Liu, H.; Huang, Z.; Kang, H.; Xia, C.; Chen, J.; Chin. J. Catal. 2016,
37,700.
11. Soares, A. V. H.; Salazar, J. B.; Falcone, D. D.; Vasconcellos, F. A.; Davis, R. J.; Passos, F. B.; J.Mol. Catal. A: Chem. 2016, 415,27. 12. Balaraju, M.; Rekha, V.; Sai Prasad, P. S.; Prabhavathi Devi, B.; Prasad,
R. B. N.; Lingaiah, N.; Appl. Catal., A2009, 354, 82. 13. Jia, Y.; Liu, H.; Chin. J. Catal. 2015, 36,1552.
14. Rao, R.; Dandekar, A.; Baker, R. T. K.; Vannice, M. A.; J. Catal.1997,
171,406.
15. Fung, S. C.; Querini C.; J. Catal. 1992, 38, 240. 16. Deutsch, K. L.; Shanks, B. H.; J. Catal. 2012, 285, 235
17. Plyasova, L. M.; Solovyeva, L. P.; Krieger, T. A.; Makarova, O. V.; Yurieva, T. M.; J.Mol. Catal. A: Chem. 1996; 105,61.
18. Lauriol-Garbay, P.; Millet, J.; Loridant, S.; Belliere-Baca, V.; Rey P.; J.
19. Mane, R.; Ghalwadkar, A.; Hengne, A.; Suryawannshi, R.; Rode, C.;
Catal. Today2011, 164, 447.
20. Romero, A.; Santos, A.; Escrig, D.; Simon, E.; Appl. Catal., A2011,
392, 19.
21. Haider, M. H.; Dummer, N. F.; Zhang, D.; Miedziak, P.; Davies, T. E.; Taylor, S. H.; J. Catal.2012, 286,206.
22. Jia, C-J.; Liu, Y.; Schmidt, W.; Lu, A-H.; Schüth, F.; J. Catal. 2010, 269, 71.
23. Dalla Costa, B. O.; Peralta, M. A.; Querini, C. A.; Appl. Catal., A2014,
472, 53.
24. Chiu, C. W.; Dasari, M. A.; Suppes, G. J.; Sutterlin, W. R.; AIChE J.
2006, 52, 3543.
25. Johansson, L. E.; Lundin, S. T.; J. Am. Oil Chem. Soc. 1979, 56,974. 26. Chaminand, J.; Djakovitch.; L.; Gallezot, P.; Marion, P.; Pinel, C.;
Rosier, C.; Green Chem. 2004, 6,359.
27. Alhanash, A., Kozhevnikova, E. F.; Kozhevnikov, I. V.; Catal. Lett. 2008,
120, 307.
28. Miyazawa, T.; Koso S.; Kunimori K.; Tomishige, K.; Appl. Catal., A
2007, 329, 30.
29. Miyazawa, T.; Kusunoki, Y.; Kunimori, K.; Tonishige, K.; J. Catal. 2006,
240, 213.
30. Sato, S.; Akiyama, M.; Inui, K.; Yokota, M.; Chem. Lett.2009, 38, 560. 31. Nakagawa, Y.; Ning, X.; Amada, Y.; Tomishige, K.; Appl. Catal.,A2012,
433, 128.
32. Sharma, R. V.; Kumar, P.; Dalai, A. K.; Appl. Catal., A.2014, 477, 147. 33. Abhari, R.; US Pat. 8,058,4842011.
34. Casale, B.; Gómez, A. M.; US Pat. 5,214,2191993. 35. Schuster, L.; Eggersdorfer, M.; US Pat. 5,616,8171997.
36. Vasiliadou, E. S.; Lemonidou, A. A.; Appl. Catal., A2011, 396, 177. 37. Massa, M.; Andersson, A.; Finocchio, E.; Busca, G.; J. Catal. 2013, 307,
170.
38. Alvarez, W. E.; Kitiyanan, B.; Borgna, A.; Resasco D. E.; Carbon2001,