Efects of Solidiication Rate in the Microstructure of Al-Si5Cu3 Aluminum Cast Alloy
Maria Eduarda Farinaa*, Pedro Bella, Carlos Raimundo Frick Ferreirab, Berenice Anina Dedavida
Received: January 17, 2017; Revised: May 10, 2017; Accepted: June 20, 2017
Aluminium alloy Al-Si5Cu3 (319) is one of the most commonly used casting alloys for automobile
components, due to its casting characteristics. Iron is the major impurity element that inluences the detrimental β-phase formation in secondary aluminum alloys. In the present study, we investigated the inluence of the cooling rate on the formation of iron compounds, α-Al15(Mn,Fe)3Si2 and β-Fe5AlSi phases,
in Al-Si5Cu3 containing 1.0% Fe, 0.5% Mn and 0.2% Mg, by thermal analysis and metallography. The
results show that the high cooling rates, between 10-103 K/s, are able to reduce and nullify the formation
of needle-like β-Al5FeSi phase, and help the formation of the Chinese scripts α-Al15(Fe,Mn)3Si2 phase.
The analysis of the curves reveals that the increase of the cooling rate increases the temperature of
nucleation of the α-Al dendrite and decrease the eutectics Al-Si and Al-Cu phases.
Keywords: Solidiication, Al-Si alloys, iron-compounds, thermal analysis, CA-CCTA
* e-mail: [email protected]
1. Introduction
The casting process is more economical than any other process of metal manufacture, provided that the melting
point is lower than 1800ºC1. Although the manufacturing
path from the liquid to the inished shape is the most direct,
this involves a simultaneous control of the processes parts,
including melting, alloying, molding, pouring, solidiication process and inishing. Therefore, it is not surprising that the
production of castings is a challenging technology1,2.
The main aluminum alloys castings contain silicon due
to its capability to increase luidity, elevated temperature
resistance to cracking, and feeding characteristics1,2. In
addition, silicon is the only alloying element that added to
aluminum does not increase the speciic mass of the alloy.
Copper and magnesium increase strength and toughness
in Al-Si alloys, as well as provide hardening phases that
precipitate during the aging thermal treatment1,2. The major
impurity element in Al-Si alloys that inluences the detrimental
secondary phase formation is iron, usually acquired during the recycling process2,3.
Unfortunately, there is no economically viable way known
to remove the iron of aluminum alloys. Consequently, the
iron compounds continue to increase potentially with every
remelting cycle in foundry activities1,2,5.
The commercial AA 319 (Al-Si5Cu3) cast alloy has
excellent mechanical properties, which makes it suitable for use in many automotive applications. However, using
recycled-grade Al-Si and Al-Cu alloys as the base material for structural components remains a major challenge, especially
when fatigue life is critical2-6,8,11-13.
During a conventional solidiication of the Al-Si5Cu3 alloy, the irst reaction is the nucleation and growth of the α-Al dendrite. Thus, the pro-eutectic Fe-containing phases
take place. The Al-Si eutectic phase, the Mg2Si and the Al2Cu precipitation occur successively6.
The iron-containing compounds that form during
solidiication processes appear in a few shapes and sizes, usually divided into three diferent morphologies: β-Fe5AlSi
needles, α-Al15(Mn,Fe)3Si2 Chinese script (also called αc
-phase) and polyhedral crystals5,6. The β-Fe
5AlSi intermetallic
compound is hard and brittle, having low cohesion with the
aluminum matrix. It acts as crack initiators and plays a role
in forming solidiication defects, such as porosity and hot
tearing, being detrimental to in-service mechanical properties of the cast components cast4-8.
Several researchers2-6,8,11 observed that the damaging
efects of iron can be minimized through some techniques, such as the rapid-solidiication process, iron/manganese ratio
control and the superheat melting before pouring. These
methods basically convert the crystallization of the needle-like β-Fe5AlSi phase into the less damaging αc-Al15(Mn,
Fe)3Si2 phase6-8-10,11,13.
This subject is not yet completely exhausted considering
that solidiication of commercial alloys is complex and behaves
far from the equilibrium conditions1. In the design of cast
components, it is necessary to monitor the solidiication of alloys under diferent cooling conditions corresponding to diferent cross sections of the castings1,2,8-11.
In the present work, we studied the microstructural
behavior of iron containing intermetallic compounds in the 319.2 aluminum alloy as a function of cooling rate, through
aEngineering Faculty, Pontiical Catholic University of Rio Grande do Sul (PUCRS),
Porto Alegre, RS, Brazil
bFoundry Laboratory, Department of Metallurgy, Federal University of Rio Grande do Sul (UFRGS),
computer-aided cooling curve thermal analysis (CA-CCTA) and metallography.
The CA-CCTA is a quantitative and non-destructive
on-line process control method used in diferent processes
in aluminum cast alloys9,12. This thermal analysis method is
based on the cooling curves (temperature x time) obtained
during the solidiication of the alloy from the liquid phase. The cooling curve relects the release of latent heat during the metal cooling in the solidiication. Diferently from other techniques, such as the Diferential Thermal Analysis (DTA) and the Diferential Scanning Calorimetry (DSC), CA-CCTA do not dependent on a sample size, nor on continuum
rates of heating and cooling. CA-CCTA method is simple, inexpensive, provides consistent results and, consequently, the most suitable for foundry applications12.
The cooling rates used in this work are similar to those
found in foundry industrial processes2. Cooling rates in the
semi-solid region of about 10-1 to 103 K / s were acquired
with the use of a tec-tip standard cup and a six-stepped
cylindrical steel mold1,2.
2. Experimental Procedure
In this study, the Al-5Si3Cu alloy was prepared and melted with commercial base Al-9% Si, Al-Cu and aluminum ingots, followed by the addition of iron and manganese in powder form. The chemical compositions of all ingots studied were veriied by optical emission spectrometry using the SPECTROMAXx stationary metal analyzer by SPECTRO®,
as shown in table 1. In the present study, neither grain reiner nor eutectic modiier were added to the melt.
We carried out the casting process with about 500 g of
alloy melt in an electric-resistance furnace, in a commercial graphite crucible, held at a temperature of around 993 K.
Before pouring, the melts were skimmed and held for 20
min at approximately 1123 K. A high temperature of pouring (1073 K, i.e. ~ 200 K above of liquidus point) was used so that the acquisition system was able to record the data above
the liquidus point.
To obtain several solidiication conditions, we used
tec-tip standard cups and a cylindrical metallic stepped-mold
having six sections with diferent diameters (see igure 1). A metallic pouring-cup was adapted to the step-mold to drive the melt to low down.
In the metallic six-stepped mold, temperature x time data
for thermal analysis was conducted by ive thermocouples
type K (Ni-Cr-Ni) high sensitive, with 0.508 mm of diameter,
and protected in a stainless steel sheath. To increase the sensitivity of system response, the tips of the thermocouples
were stripped. The data were acquired by modular National Instruments system (A/D converter) with response time of
104 Hz, through lab view 5.0 software. Parameters such as
cooling rate, initial and inal solidiication time as well as the temperature and time of nucleation of the phases were identiied for each mold.
The microstructural examination and Vickers microhardness
measurements were realized in samples cut transversely
of ingots obtained in the tec-tip standard cup and metallic stepped-mold. In order to correlate the thermal analysis
parameters with the alloy microstructure, the observations of samples were realized in the region near the tips of the thermocouples. The samples were prepared by the conventional
metallographic method and etched by HF solution (1ml of HF for 200ml of H2O)1,2. The microstructure analysis was
carried out through Olympus BH2 optical microscopy, Scanning Electron Microscopy FEG Inspect F50 – FEI®,
and microanalysis by Energy Dispersive Spectroscopy
(EDS) with an OXFORD® AZtecOneXT system detector.
The average size of α-Al grains were measured by the
linear intercept method according to the ASTM-E112-9614.
In order to compare the hardness to the solidiication rate, per ASTM E38415, we carried out Vickers microhardness
measurements using the Shimadzu® HMV-G.
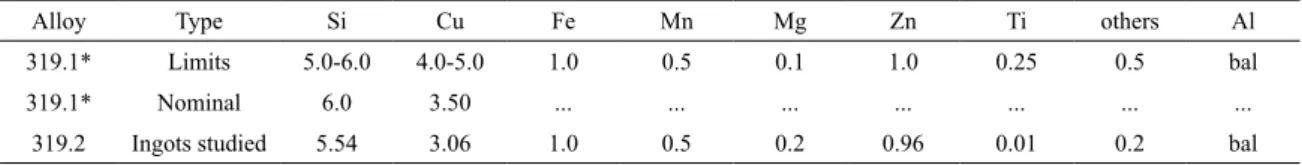
Table 1. Chemical Composition of 319 (Al-5Si3Cu) aluminum alloy (wt %). (*) Ref. 2.
Alloy Type Si Cu Fe Mn Mg Zn Ti others Al
319.1* Limits 5.0-6.0 4.0-5.0 1.0 0.5 0.1 1.0 0.25 0.5 bal
319.1* Nominal 6.0 3.50 ... ... ... ... ... ... ...
319.2 Ingots studied 5.54 3.06 1.0 0.5 0.2 0.96 0.01 0.2 bal
Figure 1. Schematic of six-stepped cylindrical steel mold used in
3. Results and Discussion
3.1. Solidiication in low cooling rate
In igure 2, it is possible to observe the cooling curve (Temperature (K) / time (s)), the irst derivative and second
derivative curves (dT/dt and d2T/dt2 respectively) registered
during the cooling of Al-5Si3Cu alloy from the liquid phases, in tec-tip standard cup.
(tS-tL)equation was 0.24 K/s, where the solidiication range
is deined as the diference in temperatures between the irst
(Tα-AlN) and the last liquid to solidify (Tsolidus), and the total
solidiication time (ts-tL)is the range between the start and
the end of solidiication.
The liquidus and solidus temperatures (point1 and point10
in table 2), as well as in the eutectic reactions temperatures registered in cooling curve (igure 2) are diferent from
Al-Si-Cu ternary phase diagram6, mainly due to the cooling rate
used. In table 2, the silicon eutectic reaction (point 4) is 20
K and the copper eutectic reaction (point 7) is 54 K lower
than the recorded in equilibrium diagrams2. Narayanan et
al.6 and Taylor13 found similar results for the same solidiied
alloy with moderate cooling rate.
Figure 3 shows BSE (backscattered electrons) images of the alloys 319.2 sample solidiied in tec-tip standard cup. It is interesting to observe in igure 3.a the presence of the needles (light gray), diferent silicon structures typical of unmodiied Al–Si foundry alloys (dark gray), as well as,
eutectic strutures Al + Al2Cu (light) present mostly along the needles.
Figure 2. The cooling curve, the irst and second derivative curves
(dT/dt and d2T/dt2 respectively) of Al-5Si3Cu alloy solidiied in
tec-tip standard cup.
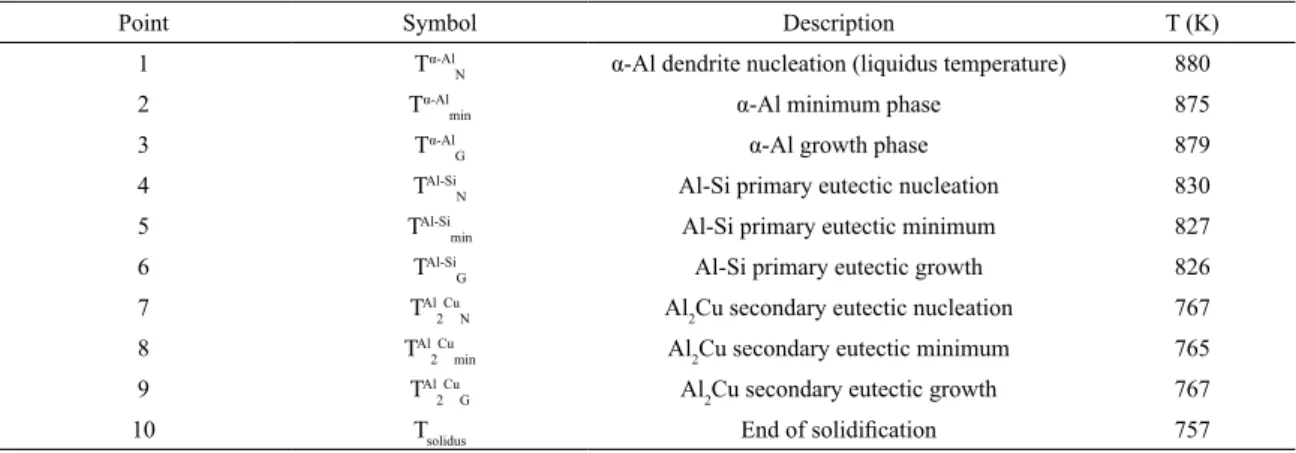
Table 2. The solidiication characteristic parameters of phase evolution for Al-5Si3Cu alloy solidiied in tec-tip standard cup by thermal
analysis.
Point Symbol Description T (K)
1 Tα-AlN α-Al dendrite nucleation (liquidus temperature) 880
2 Tα-Almin α-Al minimum phase 875
3 Tα-AlG α-Al growth phase 879
4 TAl-Si
N Al-Si primary eutectic nucleation 830
5 TAl-Si
min Al-Si primary eutectic minimum 827
6 TAl-Si
G Al-Si primary eutectic growth 826
7 TAl
2 Cu
N Al2Cu secondary eutectic nucleation 767
8 TAl
2 Cu
min Al2Cu secondary eutectic minimum 765
9 TAl
2 Cu
G Al2Cu secondary eutectic growth 767
10 Tsolidus End of solidiication 757
A summary of metallurgical events corresponding to the
solidiication sequence, identiied directly from the cooling curve (igure 2) showed in table 2.
It is evident in igure 2 that the cooling rate widely varies during the solidiication of alloy. In general, the cooling rate
is calculate from the slope of cooling curve before liquidus temperature (Tα-AlN). Otherwise, the cooling rate in the
mushy zone is compute by dividing the total solidiication temperature to the total solidiication time8,9,12.
In the present work, the cooling rate in the liquid phase region computed by ΔTL(K)/ΔtL(s) equation for the alloy
solidiied in tec-tip standard cup was 3.7 K/s. Similarly, the cooling rate in semi-solid phase veriied by (Tα-Al
N -Tsolidus)/
Figure 3. a) the BSE-SEM image as-casting microstructure of
Al-5Si3Cu alloy ingot solidiied in tec-tip standard cup at cooling rates of 0.24 K/s of in mushy zone. Figure b) detail of alloy microstructure.
The inset corresponds to the iron EDS map. The phase related to
the amount of iron over the (c) phase was not identiied.
Figure 3.b shows details the alloy microstructure, i.e., α–Al dendrites (a), needle of the β-Fe5AlSi phase (b),
Cu-rich eutectic structures (c) and, silicon structures (d). Note
matrix relation in BSE images. There is a signiicant fraction of growing coupled to needles β-Al5FeSi and the silicon
structures in the interdendritic regions. The insert in igure 3.b show the iron EDS map of the igure 3.b. The microstructural composition of the sample in igure 3.b. was conirmed by EDS microanalysis, as show in table 3. The phase related
to the amount of iron over the Cu-rich eutectic structures
(c) was not identiied. It is necessary to emphasize that the analyzes by ESD are qualitative because they depend on the chemical composition of the analyzed material.
Dinnis10,11 and Taylor et al.13, under analogous conditions
used in this work, veriied that the iron-containing phases crystallizes only in Chinese scripts morphology, when the cooling rate in semisolid phase equal to 0.2 K/s. However, igure 3 reveals only the existence of needles of the β-Al5FeSi
phase (see igure 3) in the microstructure of the alloy solidiied with a cooling rate of 0.24 K/s in the mushy zone.
Another interesting fact is that the cooling curve in
igure 2 does not register the typical 319.0 alloy plateau, related to the formation of needles of the β-Al5FeSi phase
between 3-4 points as described in the literature6,10,11,13. This
suggests that the formation of needles of the β-Fe5AlSi phase
occurs just before the eutectic Al-Si phase. Narayanan6 and
Timelli8 show that the reaction plateau associated to the
formation of the β-iron phase do not appear in the cooling curve when it merges with the eutectic Al-Si peaks and valleys. The same authors show that the area fraction of the primary β-phase needles greatly depends on the time interval between the β-phase start temperature and the silicon
eutectic temperature6,8.
3.2. Solidiication in high cooling rates
In igure 4, it is possible to observe the cooling curves
(temperature (K) / time (s)), registered during the cooling
of Al-5Si3Cu alloy from the liquid phases, solidiied in the
metallic six-step cylindrical mold. The lines Tα-AlN and Tsolidus
in igure 4 refer to the liquidus and solidus temperatures recorded by the thermal analysis system during the experiments
realized by tec-tip standard cup (see table 2). We used these
Table 3. EDS analysis of igure 3.b and the suggested phase (atomic %).
Point Al Si Cu Fe Mn total Suggested phases
(a) 98.44 1.28 0.24 0.03 0.01 100 α-Al dendrite
(b) 80.42 10.65 0,94 6.32 1.66 100 β-Al5FeSi
(c) 74.24 21.33 - - 1.43 100 Silicon eutectic
(d) 71.98 - 28.02 - - 100 Eutectic Al-Cu
Table 4. Cooling rates in semi-solid region estimated by cooling curve, mean linear length (MLL) of dendritic and Vickers microhardness
(HV) of Al-5Si3Cu solidiied in six-stepped cylindrical steel mold. (*) cooling rates calculate by Chvorinov's rule1.
Step 1 2 3 4 5 6
Cooling rate (K/s) 815* 137* 75* 42 32 24
Dendritic MLL (μm) Standard deviation 10.06 ± 5.60 16.98 ± 3,11 20,01 ± 2,01 26,14 ± 5,30 28,13 ± 1,83 30,91 ± 2,82
Vickers microhardness (HV) 97.4 96.2 91.0 88.1 93.0 94.7
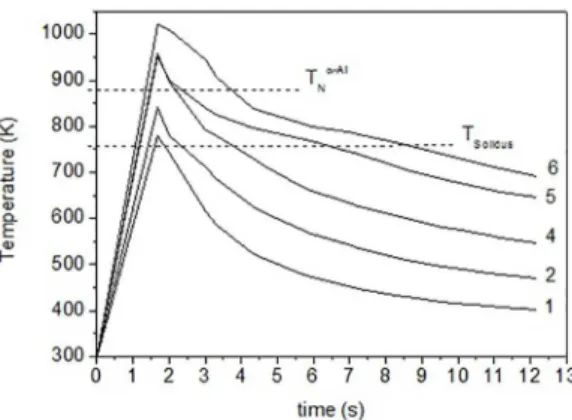
Figure 4. Cooling curves of Al-5Si3Cu alloy solidiied in six-stepped
cylindrical steel mold recorded by the thermocouples 1,2 4, 5 and
6. Where Tα-AlN is equal to 880 K and Tsolidus to 757 K.
and other data from table 2 to compare the evolution of the
cooling curves and the alloy microstructure solidiied in a
six-stepped cylindrical steel mold.
Table 4 shows the cooling rates in the semi-solid phase
estimated by steps in metallic mould. The cooling rate for the steps 4, 5 and 6 are obtained directly from the cooling curves. Due to the high rates of heat extraction involved in steps 1, 2 and 3, the cooling rate are calculated by the Chvorinov’s rule1.
In the data analysis of igure 4, we observed that the total solidiication time decreases for all diameter of the
stepped-metallic mold, as expected. Due to the cooling rates involved in the experiments only is possible to identify the (Tα-AlN) α-Al dendrite nucleation temperature for steps 6, 5
and 4. It was not possible to identify the (Tα-Al
G)α-Al growth
phase temperature, the supercooling and the recalecence in
the curves of the igure 4. However it is possible to identify
the temperatures of the Al-Si primary eutectic nucleation (T Al-Si
N) and the Al2Cu secondary eutectic nucleation (T Al
2 Cu
N) for
all six steps. Note in igure 4 that (Tα-Al
N) the α-Al dendrite
nucleation temperature for steps 6, 5 and 4 increase according
as the cooling rate increases. On the other hand, we ind that
the TAl-Si
N (Al-Si primary eutectic nucleation temperture)
The mean linear length of dendritic showed in table 4
increases according as the cooling rate decreases. According to the literature6-8,11,16, this behavior is due to the increase of the supercooling resulting from the increase of the cooling
rate. The higher the cooling rate the greater the α-Al dendrite
nucleation temperature (Tα-AlN), the supercooling and the
lower the recalescence, so the α-Al growth phase temperature
(Tα-AlG) decreases and thus, the many nucleus formed have
the energy to grow, increasing the number of grain. Solidiied samples in stepped-metal mold showed
higher Vickers microhardness than the 67.2 HV found in the
sample solidiied in tec-tip standard cup. However, table 4 shows that the microhardness decreases from steps 6 to 4
and then increases again from steps 5 to 6. An explanation of this behavior is in the microstructure of the samples
shown in igure 5.
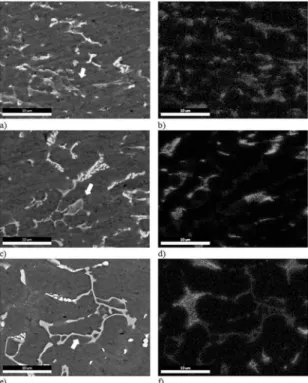
In the step 1 sample in igure 5 (a and b), note polygonal
particles of the eutectic Al-Si (EDS map) together as
not-well-Figure 5. BSE images of the step 1 (a), step 3 (c) and step 6 (e). Silicon ESD map of the the step 1 (b), step 3 (d) and step 6 (f) of
ingots of Al-5Si3Cu solidiied in the six-stepped cylindrical steel mold. The arrows point to the αc-Al15(Fe,Mn)3Si2 phase.
developed αc-Al15(Fe,Mn)3Si2 (arrows point) and small and
elongated plates of Al2Cu (light). In the step 3 sample igure 5
(c and d) we notice a infrequent and better developed Chinese scripts αc-Al15(Fe,Mn)3Si2 phase (arrows point), the Al-Si
eutectic in the grain boundary (EDS map), and the eutectic lamellae Al-Al2Cu . On the other hand, the microstructure of
step 6 sample in igure 5 (e and f) shows the well-developed
Chinese scripts morphology αc-Al15(Fe,Mn)3Si2 phase (arrows
point) and Al-Si eutectic phase in the grain boundary (EDS
map), and formations of the secondary lamellae Al-Al2Cu.
No needles β-phase were found in the samples solidiied in
the metal mold. Therefore, the decrease of the microhardness observed for the samples of steps 1 to 4, and the subsequent increase of hardness to step 6 (see table 3) is attributed to
at least two factors: the gradual increase of the grain size from step 4 and the presence of the well-deined αc-Al5(Fe,
Mn)3Si2 phase4,6,7,13.
4. Conclusion
For the Al-Si5Cu3 alloy the results obtained in this work conirm that cooling rates inluence the nucleation and growth of αc-Al15(Fe,Mn)3Si2 and β- Al5FeSi phases.
The micrography of the Al-Si5Cu3 alloy reveals the
presence of needle-like β-Al5FeSi phase and the absence of
αc-Al15(Fe,Mn)3Si2 in the microstructure of the alloy solidiied
in a low cooling rate (3.7 K/s in the liquid zone and 0.24 K/s in the mushy zone). Absence of the the plateau of the β-Al5FeSi phase in the correspondent cooling curve indicates
that the formation of needles of the β-Fe5AlSi phase take
place just before the eutectic Al-Si phase.
The solidiication experiment in the six-stepped metallic mold, indicated that the α-Al dendrite nucleation temperature
(Tα-AlN) increase according as the cooling rate increases and, the TAl-Si
N and T Al
2 Cu
N decrease according as the cooling rate
increases. Experiments with the stepped mold show that the diference between the TAl-Si
N and T Al
2 Cu
N temperatures
decreases according as the cooling rate increases for the studied alloys.
β-phase needles were not found in the solidiication samples in the metal stepped mold, diferent from what occurred in the tec-tip standard cup. Only when the cooling rate in the mushy zone was less than 75 K/s, it was possible to observe the well-developed script Chinese α-Al15(Fe,Mn)3Si2
phase. This proves that the detrimental β-phase formation
can be eliminated in Al-Si5Cu3 alloys containing 1.0% Fe,
0.5% Mn, with a superheating of 800 K, and cooling rates
higher than 24 K/s.
5. Acknowledgments
The authors would like to thank the BPA program of Pontiical Catholic University of Rio Grande do Sul (PUCRS), the National Council for Scientiic and Technological Development of Brazil (CNPq) and the Foundation for
Research Support of Rio Grande do Sul (FAPERGS) for scholarships and for supporting their research.
1. Campbell J. Complete Casting Handbook. 2nd ed. Oxford: Elsevier;
2015. 1054 p.
2. Kaufman JG, Rooy EL. Aluminum Alloy Castings:Properties, Processes, and Applications. Materials Park: ASM International; 2004.
3. Yi JZ, Gao YX, Lee PD, Lindley TC. Efect of Fe-content on
fatigue crack initiation and propagation in a cast aluminum– silicon alloy (A356–T6). Materials Science and Engineering:
A. 2004;386(1-2):396-407.
4. Seifeddine S, Johansson S, Svensson IL. The inluence of cooling rate and manganese content on the β-Al5FeSi phase formation
and mechanical properties of Al–Si-based alloys. Materials
Science and Engineering: A. 2008;490(1-2):385-390.
5. Puncreobutr C, Lee PD, Kareh KM, Connolley T, Fife TL, Phillion
AB. Inluence of Fe-rich intermetallic on solidiication defects
in Al–Si–Cu alloys. Acta Materialia. 2014;68:42-51.
6. Narayanan LA, Samuel FH, Gruzleski JE. Crystallization
behavior of iron-containing intermetallic compounds in 319 aluminum alloy. Metallurgical and Materials Transactions A.
1994;25(8):1761-1773.
7. Yang W, Gao F, Ji S. Formation and sedimentation of Fe-rich
intermetallics in Al−Si−Cu−Fe alloy. Transactions of Nonferrous Metals Society of China. 2015;25(5):1704-1714.
8. Timelli G, Capuzzi S, Fabrizi A. Precipitation of primary
Fe-rich compounds in secondary AlSi9Cu3(Fe) alloys. Journal
of Thermal Analysis and Calorimetry. 2016;123(1):249-262.
9. Emadi D, Whiting LV, Naisi S, Ghomashchi R. Applications of thermal analysis in quality control of solidiication processes.
Journal of Thermal Analysis and Calorimetry. 2005;81(1):235-242.
10. DinnisCM, Taylor JA, Dahle AK. Iron-related porosity in Al-Si-(Cu) foundry alloys. Materials Science and Engineering:
A. 2006;425(1-2):286-296.
11. Dinnis CM, Taylor JA, Dahle AK. As-cast morphology of iron-intermetallics in Al-Si foundry alloys. Scripta Materialia.
2005;53(8):955-958.
12. Farahany S, Ourdjini A, Idris MH, Shabestari SG. Computer-aided cooling curve thermal analysis of near eutectic Al–Si– Cu–Fe alloy. Journal of Thermal Analysis and Calorimetry. 2013;114(2):705-717.
13. Taylor JA. Iron-Containing Intermetallic Phases in Al-Si Based Casting Alloys. Procedia Materials Science. 2012;1:19-33.
14. ASTM International. ASTM E112-96 (2004) - Standard Test
Methods for Determining Average Grain Size. West Conshohocken: ASTM International; 2004.
15. ASTM International. ASTM E384-16 - Standard Test Method for
Microindentation Hardness of Materials. West Conshohocken: ASTM International; 2016.