*e-mail: [email protected]
1 Introduction
With increasing requirements in reducing vehicle weight and improving fuel economy, Al-Si based casting alloys have been widely used in automobile and in different ields of industry 1,2 . Most of Al-Si based casting alloys used in automobile containing 50–90 vol. pct eutectic and the eutectic reaction is the last major phase transformation during solidiication. It is therefore expected that eutectic solidiication has a signiicant effect on inal microstructure, casting defects, and mechanical properties. In recent years, the understanding of eutectic solidiication in Al-Si based casting alloys has drawn a great attention to many researchers. Makhlof and Guthy 3 reviewed the research works reported in past half century on crystallogphy of eutectic and mechanisms of eutectic reaction in Al-Si alloy. Shankar et al., 4 investigated the solidiication of an unmodiied Al-Si alloy and concluded that eutectic Si phase nucleates on the pre-formed β-(Al, Si, Fe) particles and eutectic Al then nucleates on the eutectic silicon. The eutectic silicon crystallizes into a coarse, plate-like morphology during the formation of eutectic, which is mechanically disadvantageous for the casting, because sharp corners concentrate stress, which can cause fracture during the use of the casting. The most commonly used content elements are Na, Sr or Sb because even a few hundred ppm of content elements can be change alloy morphology, which causes a well-reined ibrous structure of the eutectic Si, thereby improving the structure and mechanical properties of Al–Si based alloys 5-7. Cobalt as a content element to Al-Si eutectic alloy has not been found in the available literature. So, the aim of the present work was to experimentally investigate the dependency of lake spacings (λ) and on growth rate
(V) and investigate the mechanical, electrical and thermal properties of the cobalt added directionally solidiied Al-Si eutectic alloy.
2. Experimental procedure
2.1. Al-12.6 wt.% Si-2 wt.% Co sample
preparation and solidiication
High purity (99.99%) Al, Si and Co metals were melted in vacuum atmosphere in a graphite crucible and cast into 10 graphite crucibles held in a specially constructed hot illing furnace at above the melting point of alloy. The molten metal solidiied from bottom to top to completely full. Then, each sample was positioned in a Bridgman type furnace in a graphite cylinder (300 mm in length 10mm ID and 40 mm OD). The samples were heated about 100 K above the melting temperature, after stabilizing the thermal condition in the furnace under an argon atmosphere, the specimen was grown by pulling it downwards at various solidiication conditions by means of synchronous motors. Specimens were solidiied under steady state conditions with different V (8.35-166.30 µm/s) at a constant G (7.60 K/mm). After 10–12 cm steady-state growth, the samples were quenched by rapidly pulling it down into the water reservoir.
2.2. Solidiication parameters (G,V)
metallographic process and microstructure
The temperatures in samples were measured by three K-type thermocouples with a ceramic protective which were ixed within the sample between spacing of 10 mm to 20 mm. All the thermocouple’s ends were then connected
Determination of Microstructure, Mechanical, Electrical and Thermal Properties of
The Directionally Solidiied Al-Si-Co Ternary Alloy
Aynur Akera, Hasan Kayab*
aDepartment of Computer and Tech. Teaching, Faculty of Education, Siirt University, Siirt, Turkey bDepartment of Science Education, Faculty of Education, Erciyes University, Kayseri, Turkey
Received: September 7, 2015; Accepted: December 16, 2015
In this work, Al-12.6Si-2Co (wt.%) ternary alloy of near eutectic composition was directionally solidiied at a constant temperature gradient (G=7.60 K/mm) in a wide range of growth rates (V=8.35-166.30 µm/s) using by Bridgman type growth apparatus. Flake spacing (λ), microhardness (HV), tensile stress (σ) and electrical resistivity (ρ) were measured from directionally solidiied samples. The dependence of lake spacing, microhardness, tensile stress and electrical resistivity on growth rate (V) was also determined by statistical analysis. According to these results, it has been found that for increasing values of V, the values of HV, σ and ρ increase. Variations of electrical resistivity (ρ) for casting Al-Si-Co alloy were also measured at the temperature in range 300−500 K. The enthalpy of fusion (ΔH) for the Al-Si-Co alloy was determined by differential scanning calorimeter (DSC) from heating trace during the transformation from solid to liquid. The results obtained in this work were compared with the previous similar experimental results obtained for binary and ternary alloys.
the measurement unit consists of data-logger and computer. Three cooling curves were recorded with a data-logger via computer during the solidiication process. The time taken for the solid-liquid interface the thermocouples separated by known distances was read from data-logger record. Thus, the value of growth rate (V= ΔX / Δt) for each sample was determined. The temperature gradient is deined as a ratio of temperature to displacement (G =ΔT/ΔX). The values of G are calculated from three cooling curves in the solid-liquid inter-phase was measured by data-logger and computer. The average value of G is 7.60 K/mm.
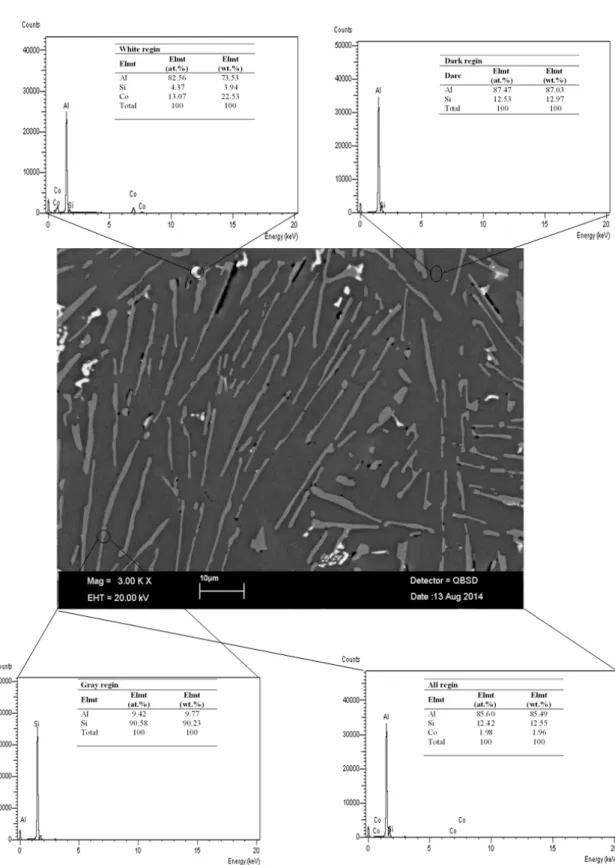
The directional solidiied sample was removed from the graphite crucible and cut into lengths typically 8 mm. The longitudinal and transverse sections were ground lat with SiC paper and the samples were cold mounted with epoxy-resin. After metallographic process, the samples were etched with modiied Murakami’s reagent (100 ml of water, 10 g of sodium hydroxide and 10 g of potassium ferricyanide) for 20 s at room temperature. The microstructures of samples were photographed by LEO model scanning electron microscopy (SEM).
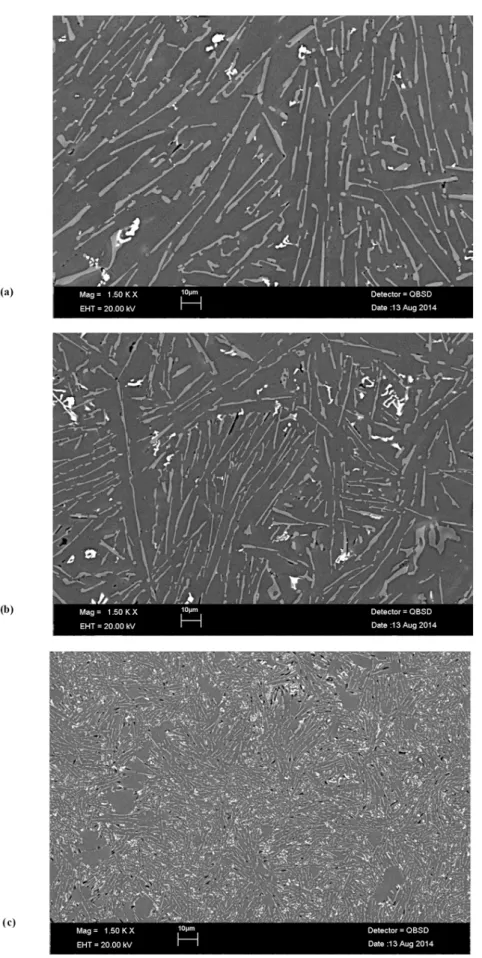
The lake spacings (λ) were measured from the SEM photographs of the microstructure with a linear intersection method 8 on the longitudinal and transverse sections. The lake spacings, λm (minimum lake spacing) and λM (maximum lake spacing) values were measured on the longitudinal section (parallel to the pulling direction) and the transverse section (perpendicular to the pulling direction) of the samples (Figs. 1 and 2). Approximately 30-50 values of λm and λM were measured in, at least, ive different regions for each section and obtained the average λ values for each specimen. The values of lake spacings measured on the transverse section are more reliable than the values of lake spacings measured on the longitudinal section 9. So, lake spacings measured from transverse section in this work (Figs 1-3 and Table 1).
2.3. Measurements of microhardness, ultimate
tensile strength and electrical resistivity
Microhardness measurements in this work were carried out using a DuraScan hardness measuring test device using a 10-50 g load and dwell time of 10 s, giving a typical indentation depth of 40-60 µm, which was signiicantly smaller than the original solidiied samples. The tests of tensile strength were performed at room temperature at a strain rate of 10-3 s-1 with a Shimadzu AG-XD universal testing machine. The data collected from the tensile test can be analysed using the following formula to determine the strength (σ)
=F
A
σ (1)
where σ is the strength in N/mm2 (or MPa), F is the applied force (N), A is the original cross sectional area (mm2) of the sample. The round rod tensile samples with diameter of 4 mm and gauge length of 50 mm were prepared from solidiied rod samples with different growth rates.
The four-point probe method has proven to be a convenient tool for the resistivity measurement. A four–point probe measurement is performed by making four electrical
contacts to cleaned sample surface. Electrical resistivities of the directionally solidiied samples were measured by the d.c. four-point probe method at the room temperature (To). And also, the temperature dependence of the electrical resistivity (ρ) was measured for casting of Al- Si-Co alloy.
2.4. Determination of enthalpy and speciic heat
The enthalpy of fusion (ΔH) and the speciic heat (Cp) were measured using a differential scanning calorimeter DSC from Perkin-Elmer Diamond. The instrument measures the difference between heat lows from the sample and reference (empty crucible) sides of a sensor as a function of temperature or time. The speciic heat capacity (Cp) measurements were performed following the standard ASTM E-1269-05. This method consists of heating a blank (baseline), the sample, and a sapphire disk (reference material for Cp measurements) through the same temperature range at a ixed rate in a controlled atmosphere (nitrogen low as protective gas). The difference in heat low between the blank (reference) and the sample or the sapphire, due to energy changes, is continuously recorded. The size of the signal which was used to calculate the speciic heat was proportional to the heating rate, so it follows that faster heating rates will produce larger signals, which will give more accurate data. However, if the heating rate was too high, the temperature gradients in the sample would be large and this may introduce other errors in the measurement. The difference between the sample curve and the baseline curve was measured in milliwatts and converted to speciic heat as follows,
=
p dQ 1 C
dt MR (2)
where dQ/dt is the heat low; M the mass of the sample in g; and R the heating rate in K/min.
The Al-Si-Co cast alloy was heated with a heating rate of 10 K/min from room temperature to 1200 K. The values of the enthalpy of fusion and the speciic heat were also calculated from the graph of the heat low vs. temperature in this research.
3. Results and discussion
3.1 Effect of growth rate on the eutectic spacing
The microstructure of Al-Si-Co alloy system is similar with the Al-Si eutectic system and mostly consists of irregular lake in Al reach matrix as shown in Fig. 1. The irregular lake structure is the Si-based phase and locally ine irregular lake structure is the Co2Al9 phase. As can be seen from Fig. 2, irregular Si lakes were distributed randomly in Aluminum matrix. In order to determine the relationship between λ and V, measurements of λ were made over a range of V (8.35-166.30) µm/s at a constant G (7.60 K/mm). Experimental measurements show that the λ decrease with the increasing V (see Fig. 2 and Table 1).
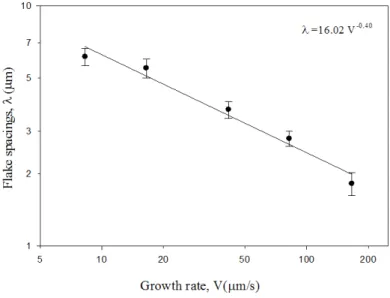
Variations of lake spacings (λ) with the growth rate (V) at a constant G (7.60 K/mm) is given in Fig. 3. The variation of λ versus V can be given the proportionality equation as,
= a 1 k V
where k1 is a constant and a is an exponent value of growth rate. The relationships between the eutectic spacing and growth rates were determined as λ=16 02 V. −0 40. by using linear regression analysis. It is apparent that the exponent value of growth rate (0.40) is close to 0.50 predicted by Jackson-Hunt eutectic theory 10. The values of the exponent relating to the growth rates (0.40) obtained in this work are in good agreement with the range of values 0.42-0.46 obtained by Wilde et al,. 11 for Al-Cu-Ag eutectic alloy, Gündüz et al. 12 for Al-Si eutectic alloy, Böyük et al., 13 for Al-11.1Si-4.2Ni alloy, Steinbach et al., 14 for Al-7Si-0.6Mg.
3.2 The effect of the growth rate on the
microhardness and ultimate tensile strength
As mentioned above, Al-Si-Co bulk samples were directionally solidiied at a constant temperature gradient (G= 7.60 K/mm) with different growth rates (V= 8.35-166.30 µm/s). In this
work, microhardness measurements were made from on transverse section about 30 different randomly selected regions. After measurements, average microhardenss values was obtained for each sample. It can be seen from Fig.4 and Table 1 that an increase in the growth rate leads to an increase in the microhardness. Dependence of the HV on the V were determined by using linear regression analysis and the relationship between them can be expressed by the following equations as,
= b 2 HV K V
(4)
where k2 is constant, b is the exponent values of the growth rate.
As can be seen from Fig.4 and Table 1, the microhardness values increase with the increasing the V values. It is found that increasing growth rate from 8.35 µm/s to 166.30 µm/s,
Fig 3. Variation of lake spacings as a function of growth rate.
microhardness increases from 73.15 kg/mm2 to 94.75 kg/mm2. The average exponent values of V were found to be 0.08. The exponent value of V in this work is generally in a good agreement with the exponent values obtained in previous experimental works 15-18 under similar solidiication conditions.
Tensile strength is an important parameter of engineering materials that are used in structures and mechanical devices. It is speciied for materials such as alloys, composite materials, ceramics etc. Fig. 4 shows the variation of the σ with the V. Dependence of σ on V, can be represented as,
σ = k3V
c (5)
As can be seen from Fig. 4 and Table 1, the values of σ increase with increasing growth rate. It was found that increasing the V values from 8.35 µm/s to 166.30 µm/s,
the UTS values increase from 109.8 MPa to 194.20 MPa. The exponent value of V is found to be 0.18.
Typical stress–strain curves of directional solidiied samples are shown in Fig. 5. Experimental curves indicate that the highest tensile stress and lowest strain (%) values were observed for 8.35 µm/s. Similar behavior was obtained in the literature 19,20 for similar solidiication condition.
3.3 Dependence of the electrical resistivity on the
growth rate and temperature
It can be seen from Table 1, the growth rate leads to an increase in the electrical resistivity. The dependence of the electrical resistivity on the growth rate can be expressed as
ρ=k4V
d (6)
Table 1. Solidiication processing parameters, microstructures, microhardness, tensile stress and electrical resistivity for directional solidiied Al-12.6wt%Si-2wt%Co alloy and the relationships between them.
Solidiication parameters Microstructures, microhardness and electrical resistivity
V
(μm/s) (Κ/mm)G (μm)λ (MPa)σ (kg/mmHV 2)
ρ x10-5
(Ω mm) 8.35
7.60 (constant)
6.142 109.8 73.15 6.50
16.57 5.512 118.03 79.45 6.78
41.63 3.730 139.50 85.37 7.03
82.31 2.830 157.80 88.80 7.32
166.30 1.820 194.20 94.75 7.55
Relationships Constant (k) Correlation coeficients (r) λ=k1V
-0.40 k
1=16.02(μm
1.40s-0.40) r
1 =0.985
HV=k2V
0.08 k
2=110.06 (kg mm
-2.08 s 0.08) r
2= 0.993
HV=k3λ
-0.18 k
3=30.22(kg mm
-1.82) r
3= 0.982
σ=k4 V
0.18 k
4=139.79 (MPa mm
-0.18 s0.18) r
4=0.987
σ=k5 λ
-0.37 k
5=17.46 (MPa mm
0.37) r
5=0.994
ρ= k6V
0.04 k
6= 8.48 (Ω.mm
0.96s 0.04) r
6= 0.997
ρ= k7 λ
-0.13 k
7= 2.96 (Ω.mm
1.13) r
7= 0.985
ρ=k8Τ
0.2 k
8=1.66x10
-5(Ω.mmC-0.02) r
8=0.982
where k4 is constants which can be experimentally determined and given in Table 1 and Fig. 4. The value of the growth rate were obtained to be 0.04.
Such a tendency is quite natural result. Because the changes of resistivity of pure metals and alloys depending on microstructure evolution. Change of resistivity can be interpreted as indicating that some other mechanism, such as decreased grain size, grain boundary/impurity scattering electron–electron interaction, etc., is involved in the electrical conduction process 21. The similar trend is supported by different experimental work. 18,22
The variation of electrical resistivity with the temperature in the range of 300–500 K was measured (see Fig. 6) for Al-Si-Co cast alloy. It is observed that an increase in the temperature (300–500 K) values lead to increase in the electrical resistivity values (3.8–6.58)×10-5 Ω.mm. The ranges electrical resistivity of Al, Si and Co as a function of temperature are (2.42-25.5)×10-5 Ω.mm, (1.47-6.10)×10-5 Ω.mm and (5.6-48)×10-5 Ω.mm, respectively 23 . This is because when the alloy is heated, thermal vibration increases. Hence, more
vacancies are created leading to disorder in the periodicity, which diffracts and scatters the conduction electrons, thus reducing the conductivity.
3.4 The thermal properties of Al-Si-Co alloy
In pure metals, enthalpy variation occurs suddenly at the melting temperature. However, in alloys, the transition from liquid to solid occurs in a temperature interval called the “mushy zone.” Therefore, the enthalpy varies from the liquidus temperature to the solidus temperature 24.
As can be seen from Fig. 7, the melting temperature of Al-Si-Co alloy was found to be 867.25 K. The values of the enthalpy of fusion and the speciic heat were also calculated to be 235.61 J/g and 0.271 J/(g.K) respectively from the graph of the heat low vs. temperature. The recommended values of the enthalpy of fusion for pure Al, Si, Co and Al-Si eutectic are 396.96, 235, 421 and 468.2 J/g respectively, and also, the speciic heat values for pure Al, Si, Co and Al-Si eutectic are 0.879, 0.711, 0.435 and 0.563 J/gK, respectively 25 at the melting temperature.
Fig. 6 Variation of electrical resistivity vs. temperature
4. Conclusions
In this work, microstructure, mechanical, electrical and thermal properties of the directionally solidiied Al-Si-Co ternary alloy were investigated. The experimental results are summarized as follows:
a) The values of lake spacings decrease as the values of V increase, the relationships between lake spacings (λ) and growth rate have been obtained to be λ=16 02 V. −0 40. .
b) The HV values directionally solidified Al-Si-Co alloy increase (73.15-94.75 kg/mm2) with increasing values of V (8.35-166.30 µm/s). The establishment of the relationships between HV and V can be given as HV=62.17 V0.08.
c) The values of ultimate tensile strength increase (109.8-194.20 MPa) with increasing values of V. The relationships between σ and V can be written as σ=71.19 V0.18.
d) The electrical resistivity of Al-Si-Cu ternary alloy increases (6.50–7.55)×10-5 Ωmm with increasing growth rate. The relationships between ρ and V have been obtained to be ρ=5.67x10⁻⁸ V0.04. And also, electrical resistivity of the alloy increases (3.8–6.58)×10-5 Ωmm with increasing temperature (300–500 K).
e) From the plot of heat low vs. temperature, the melting temperature, enthalpy of fusion, and speciic heat are found to be 867.25 K, 235.61 J/g and 0.271 J/(g.K), respectively.
Acknowledgement
This project was supported by Erciyes University Scientiic Research Project Unit under Contract No: FDK 13–4562. The authors are grateful for Erciyes University Scientiic Research Project Unit for their inancial support.
References
1. Morita A. Alluminium alloys for automobile applications. In: Proceeding ICAA-6 on Aluminum Alloys, July 5-10. Toyohashi, Japan: 1998. p.25-32.
2. Miller WS, Zhuang L, Bottema J, Wittebrood AJ, De Smet P, Haszler A, Vieregge A. Recent development in aluminium alloys for the automotive industry. Materials Science and Engineering: A. 2000;280 (1):37 – 49.
3. Makhlof M. Guthy H. The aluminum-silicon eutectic reaction: mechanisms and crystallography. Journal of Light Metals. 2001;1:199-218.
4. Shankar S, Riddle Y, Makhlouf M. Nucleation mechanism of the eutectic phases in Al-Si hypoeutectic alloys. Acta Materials. 2004;52:4447-4460.
5. Kósa A, Gácsi Z, Dúl J. Effects of stronium on the microstructure of al-si casting alloys. Journal Material Science and Engineering. 2012;37(2):43–50.
6. Chen X, Geng H, Li Y. Study on the eutectic modification level of Al–7Si Alloy by computer aided recognition of thermal analysis cooling curves. Materials Science and Engineering A. 2006;419(1-2):283-289. doi:10.1016/j.msea.2005.12.036 7. Sun Y, Pang SP, Liu XR, Yang ZR, Sun GX. Nucleation and
growth of eutectic cell in hypoeutectic Al-Si alloys. Transactions of Nonferrous Metals Society of China. 2011;21(10):2186-2191. 8. Ourdjini A, Liu J, Elliott R. Eutectic spacing selection in Al-Cu system. Materials Science and Technology. 1994;10(4):312-318.
9. Kaya H, Çadirli E, Gündüz M and Ülgen A. Effect of the temperature gradient, growth rate, and the interflake spacing on the microhardness in the directionally solidified Al-Si eutectic alloy. Journal of Materials Engineering and Performance. 2003; 12(5):544-551. DOI: 10.1361/105994903100277201.
10. Jackson KA, Hunt JD. Lamellar and rod eutectic growth. Transation Metallurgical Society A.I.M.E. 1966;236:1129-1142. 11. De Wilde J, Froyen L, Rex S. Coupled two-phase
[alpha(Al)+theta(Al2Cu)] planar growth and destabilisation
along the univariant eutectic reaction in Al-Cu-Ag Alloys. Scripta Materialia. 2004;51:533-538.
12. Gündüz M, Kaya H, Çadırlı E, Özmen A. Interflake spacings and undercoolins in al-si ırregular eutectiz alloy. Materials Science and Engineering A. 2004;369:215-229.
13. Buyük U, Engin S, Maraşlı N. Microstructural characterization of unidirectional solidified eutectic al-si-ni alloy. Materials Characterization. 2011;62(9):844-851. DOI: 10.1016/j. matchar.2011.05.010
14. Steinbach S, Ratke L. The influence of fluid flow on the microstructure of directionally solidified AlSi-base alloys. Metallurgical Materials Transactions A. 2007;38(7):1388-1394. DOI: 10.1007/s11661-007-9162-1
15. Kaya H, Çadırlı E, Böyük U, Marasli N. Variation of microindentation hardness with solidification and microstructure parameters in the al based alloys. Journal of Applied Surface Science. 2008;255(5):3071-3078.
16. Khan S, Ourdjini A, Named QS, Najafabadi MA, Elliot R. Hardness and mechanical property relationships in directionally solidified aluminium-silicon eutectic alloys with different silicon morphologies. Journal Material Science. 1998;28(21);5957-5962.
17. Kaya H, Böyük U, Engin S, Çadirli E. Measurements of the microhardness and thermal and electrical properties of the binary Zn-0.7wt.%Cu hypoperitectic alloy. Journal of Electronic Materials. 2010;39(3):303-311. DOI: 10.1007/s11664-009-1061-3
18. Kaya H, Böyük U, Çadırlı E, Marasli N. Measurements of the microhardness, electrical and thermal properties of the al–ni eutectic alloy. Materials & Design. 2012;34: 707-712. 19. Çadırlı E, Böyük U, Kaya H, Maraşlı N. Determination of
mechanical, electrical and thermal properties of the Sn— Bi—Zn ternary alloy. Journal Non-Crystalline Solids. 2011; 357(15):2876–2881.
Minerals,Metallurgy and Materials, 2011;18(5):582-588. DOI: 10.1007/s12613-011-0481-2
21. Sergeev A, Mitin V. Electron-phonon interaction in disordered conductors: static and vibrating scattering potentials. Physical Review B. 2000;61:6041-6047. DOI:http://dx.doi.org/10.1103/ PhysRevB.61.6041
22. Boekelheide Z, Cooke DW, Helgren E, Hellman F. Resonant impurity scattering and electron-phonon scattering in the electrical resistivity of Cr thin films. Physical Review B. 2009;80:134426.
23. Rudnev V, Loveless D, Cook R, Black M. Handbook of Induction Heating. New York: Markel Dekker; 2003.
24. Wannaparhun S. Roles of supercooling and cooling rates in the microstructural evolution of copper-cobalt alloys [Thesis]. Gainesville: University of Florida; 2005.