Article
J. Braz. Chem. Soc., Vol. 23, No. 11, 2003-2010, 2012. Printed in Brazil - ©2012 Sociedade Brasileira de Química 0103 - 5053 $6.00+0.00
A
*e-mail: [email protected]
Chemoface: a Novel Free User-Friendly Interface for Chemometrics
Cleiton A. Nunes,*,a Matheus P. Freitas,b Ana Carla M. Pinheiroa and Sabrina C. Bastosa
aDepartment of Food Science and bDepartment of Chemistry, Federal University of Lavras,
CP 3037, 37200-000 Lavras-MG, Brazil
Um software para análise multivariada foi desenvolvido com o objetivo de oferecer uma ferramenta computacional livre com interface gráfica amigável para pesquisadores, professores e estudantes com interesse em quimiometria. O Chemoface possui módulos capazes de resolver problemas relacionados com planejamento experimental, reconhecimento de padrões, classificação e calibração multivariada. É possível obter uma variedade de gráficos e tabelas para explorar os resultados. Neste trabalho, as principais funcionalidades do Chemoface são exploradas usando estudos de caso reportados na literatura, tais como otimização de adsorção de corante índigo em quitosana usando planejamento fatorial completo, análise exploratória de amostras de própolis caracterizadas por ESI-MS (espectrometria de massas com ionização electrospray) usando PCA (análise de componentes
principais) e HCA (análise hierárquica de agrupamentos), modelagem MIA-QSAR (análise multivariada de imagem aplicada à relações quantitativas estrutura-atividade) para predição de parâmetro cinético relacionado à atividade de peptídeos contra dengue usando PLS (método de quadrados mínimos parciais), e classificação de amostras de vinho de diferentes variedades usando PLS-DA (PLS para análise discriminante). Todos os exemplos são ilustrados com gráficos e tabelas obtidos no Chemoface.
A software for multivariate analysis was developed in order to provide a free computational tool with user-friendly graphical interface for researchers, professors and students with interest in chemometrics. Chemoface comprises modules that can solve problems related to experimental design, pattern recognition, classification and multivariate calibration. It allows obtaining a variety of high quality graphics and tables to explore results. In this work, the main features of Chemoface are explored using case studies reported in the literature, such as optimization of adsorption of indigo dye on chitosan using full factorial design, exploratory analysis of propolis samples characterized by ESI-MS (electrospray ionization-mass spectrometry) using PCA (principal component analysis) and HCA (hierarchical cluster analysis), MIA-QSAR (multivariate image analysis applied to quantitative structure activity relationship) modeling for the prediction of kinetic parameter related to activities of peptides against dengue using PLS (partial least squares), and classification of wine samples from different varieties using PLS-DA (PLS discriminant analysis). All examples are illustrated with graphs and tables obtained by means of Chemoface.
Keywords: software, experimental design, pattern recognition, classification, multivariate calibration
Introduction
A new scientific concept was introduced in the 1970s; chemometrics, a science related to performing calculations on measurements taken in a chemical process or system, was presented with the purpose of obtaining information about the state of this system by means of either mathematical or statistical methods. Due to the complex origin of the data involved in chemometric works and the need to perform extensive calculations, the
low processing capabilities of computers were limiting for researches at the time.1,2
Important advances in computation have been achieved since then, and chemometrics spread into many research fields related to chemistry, such as food science,3 soil science,4 clinical analysis5 and pharmaceutical sciences,6 among others.7 Thus, many methods, and especially the implementation of computational tools for chemometric calculations, have been developed.
commercial versions,8-10 which can impose limitations to classrooms with many computers and for students. On the other hand, those free licensed ones11,12 are still emerging about user-friendly graphical interfaces and usually require some command line programming, which generates a series of difficulties for less experienced users. Although there are some toolboxes with graphical interfaces that can facilitate the use of these programs,13,14 they are specific to a particular chemometric method.
Therefore, a new software for chemometrics, namely Chemoface, was developed in order to provide a free computational tool with user-friendly graphical interface for researchers, professors and students with interest on this science. Chemoface includes several modules that can solve problems related to design of experiments, pattern recognition, classification and multivariate calibration. Files of different formats can be imported. It also allows the obtainment of a variety of high quality graphics and tables to explore results. In this work, the main features of Chemoface are presented using case studies reported in the literature.
Discussion
Requirements
Chemoface was developed on the MATLAB15 environment. It is a stand-alone application and does not require a MATLAB license installation to run. Indeed, only MATLAB Compiler Runtime (MCR) is required to be installed, which is freely available along with Chemoface.
MCR is a set of shared libraries that provides complete support for all the features of MATLAB.
Computational performance depends on the size of the data sets and the hardware capability. The examples presented in this work were carried out in a laptop with Core i3 processor and 4 GB RAM. Large data sets (about 100 × 10000) were also properly tested on Pattern
Recognition, Multivariate Calibration, Data Plot and Data Organization modules.
Modules and applications
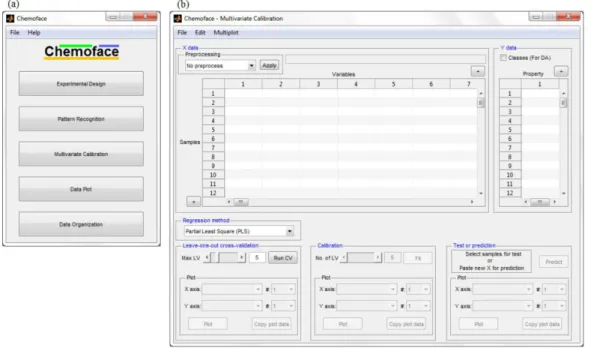
Chemoface consists of five modules which can be accessed from the software home screen; these modules are Experimental Design, Pattern Recognition, Multivariate Calibration, Data Plot and Data Organization. In all modules, Chemoface identifies samples in rows and variables in columns. Figure 1 shows the home screen and the Multivariate Calibration module of Chemoface.
Experimental Design module
This module is able to solve problems related to design of experiments using full factorial design, fractional factorial design, central composite design, Plackett-Burman design and mixture design.16,17 The results can be explored using effect tables and Pareto charts. The user can adjust various parameters related to design and analysis of experiments, such as number of factors, number of repetitions in the assays, number of central points, fraction size in fractional designs, simplex type and constraints on the component proportions in mixture designs, and
confidence level for significance tests. Surface and contour graphs are also available, with settings for linear, linear-interactions, quadratic and pure quadratic models. Options to plot the experimental data and to account only for the significant regression coefficients are also available either for surface or contour plots. Statistics for models obtained only with significant regression coefficients are also computed.
Some features of this module are illustrated by analyzing an experiment for evaluation of the removal of indigo carmine dye from aqueous solutions using cross-linked chitosan, originally reported by Cestari et al.18 The effects of the amount of chitosan (100-300 mg), concentration of dye (2.0-5.0 × 10⁻⁵ mol L−1) and temperature (25-35 °C) over dye adsorption on chitosan were evaluated by a 23 full factorial design. The responses were obtained in duplicate. In the original work, the authors evaluated the design using only a table of the effects and the respective errors. Here, this experimental design has also used other tools available in Chemoface.
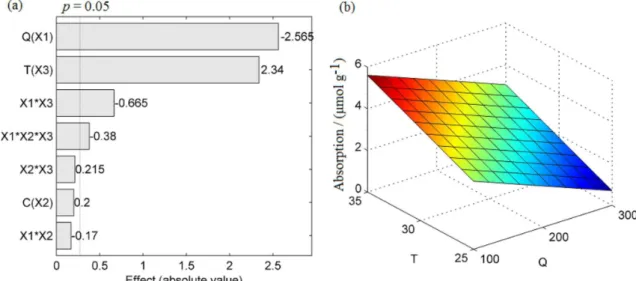
The Pareto chart of the effects is presented in Figure 2a. The graph provides a clear visualization of factor effects, and indicates that the amount of chitosan exhibited an antagonistic effect, while the temperature presented a synergistic effect. A significant interaction effect between the amount of chitosan and temperature was also verified. The third order interaction effect was significant, but the main contribution was found to be the amount of chitosan and temperature since the main effect or second order interaction of dye concentration was not significant. A surface plot (Figure 2b) for the amount of chitosan and temperature against dye adsorption shows that the increase of chitosan mass from 100 to 300 mg decreases the dye
adsorption, whereas increasing temperature from 25 to 35 oC increases such an adsorption. The statistical results for the model (Figure 3) indicates a significant linear fit (R² > 0.9; p-value of F-test < 0.05), and confirms chitosan
mass and temperature as significant effects based on the regression coefficients.
Pattern Recognition module
The Pattern Recognition module performs principal component analysis (PCA)19 and hierarchical cluster analysis (HCA).20 Several pre-processing methods can be easily applied to the data set, such as mean center, autoscaling, smoothing/derivative, normalization, multiplicative scatter correction, as well as spectral conversions (absorbance/transmittance). Graphs for 2D and 3D PCA can be generated individually for scores and loadings, in addition to biplots. Sample classes can be inserted and graphs colored according to such classes can be obtained. HCA can be performed using Euclidean or Mahalanobis distance with linkage by nearest neighbor,
Figure 2. Pareto chart (a) and surface plot (b) for the 23 full factorial design for evaluation of the effects of the amount of chitosan (Q, mg), dye concentration
(C, 10−5 mol L−1) and temperature (T, °C) over dye adsorption on chitosan.
Figure 3. Chemoface output for statistical parameters of the linear model
furthest neighbor and average. A color can be assigned to each group of nodes in dendrograms based on a threshold. PCA can also be applied to input data for HCA.
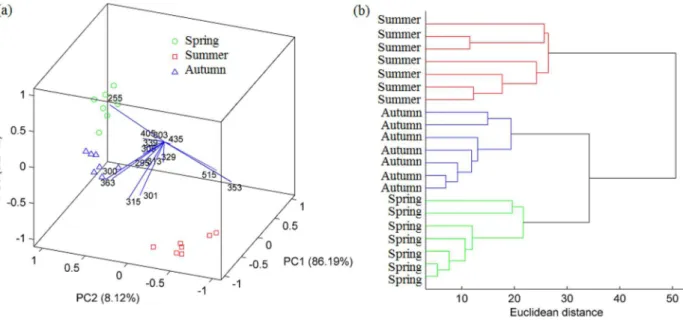
Functionalities of this module are illustrated through an exploratory analysis of a data set from characterization of propolis harvested in different seasons reported in literature.21 Alcoholic extracts of propolis samples harvested in Spring, Summer and Autumn were analyzed by electrospray ionization-mass spectrometry (ESI-MS). The mass spectra were expressed as the intensities of the individual [M – H]− ions of the most intense ions in the fingerprint of each sample. Some ions were identified as polyphenolic compounds. In the original work, the results were autoscaled and explored by PCA using a PC1 × PC4 plot. Here, the non-preprocessed data set were analyzed by PCA and HCA. A 3D biplot for scores and loadings (Figure 4a) reveals the distinction of samples from three seasons. The main propolis feature from Spring was the high intensity of ion m/z 255. The ions of m/z 301, 315, 353 and
515 highlighted in Summer propolis. A high intensity of ions with m/z 300 and 363 were typical of Autumn
propolis. Similar characteristics were also observed in the original work. The HCA dendrogram (Figure 4b) obtained using Euclidean distance and average linkage confirms the insights from the PCA analysis: the distinction of samples from three seasons, in which the Summer samples were better distinguished from the remaining ones.
Multivariate Calibration module
This module performs multivariate calibration using multiple linear regression (MLR), principal component regression (PCR) and partial least squares regression (PLS),
as well as modeling for classification by discriminant analysis (PLS-DA, PCR-DA and MLR-DA).22,23 Leave-one-out cross validation (LOO-CV) can also be performed. Performance parameters for the models, such as the widely used root mean square error (RMSE) and correlation coefficient (R²) are calculated for the cross-validation, calibration and test sets. Additional statistical parameters proposed by Roy and co-workers,24-27 namely r²
m and r²p, are also calculated for validation purposes. A r²m above 0.5 guarantees that not only a good correlation between the experimental and predicted values was obtained for the test set, but also that the absolute experimental and predicted values are congruent. The r²p parameter gives insight about the statistical difference between R² for calibration and R² for y-randomization (values above 0.5 are acceptable).
New data sets can be inserted for external validations or new predictions by using the current calibration model. A variety of options for data pre-processing are available. Models for multiple independent variables can be built simultaneously. The data set can be easily divided into samples for calibration and test sets, either manually or automatically using the Kennard-Stone algorithm.28 A number of charts and tables can be obtained to assist the exploration of results.
Some features of this module for PLS regression is illustrated by a study on the modeling of a kinetic parameter related to activities of modified peptides against dengue type 2 using MIA-QSAR (multivariate image analysis applied to quantitative structure-activity relationship).29 In MIA-QSAR, two-dimensional images of chemical structures are correlated with bioactivities and are supposed to codify chemical properties.30 In this study, a total of 54
figures of molecular structures were calibrated against the logarithm of their cleavage rates (kcat). In the original
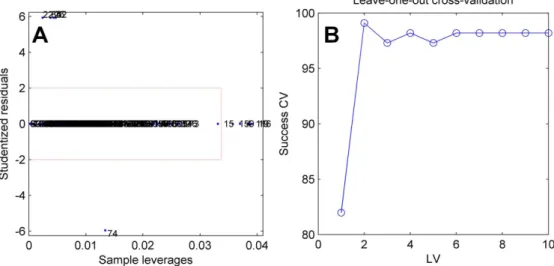
work, the data set was randomly split into a training set of 43 compounds and an external validation (test) set of 11 compounds. Here, the data set was split into training set (43 compounds) and test set (11 compounds) using the Kennard-Stone function available in Chemoface. This algorithm selects the samples based on the Euclidean distance. The first two samples selected are the furthest ones from each other. The next sample is selected by its distance from the previously selected samples.28 The molecular figures were imported using the Data Organization module of Chemoface as described further. An outlier detection test was applied by leverages × studentized residuals plot (Figure 5a). This test was not applied in the original work, and the absence of outliers in the data set was confirmed here. RMSE and R2 for cross-validation corroborate 6 LV (latent variables) as the appropriate number of PLS components (Figure 6). The model performance
(Table 1) corroborates the results of Silla et al.29 and support
the correct random selection of test samples by the authors. The r2
p and r2m above 0.5 attested the model robustness.24-27
Figure 5. Leverages × studentized residuals for outlier test (a), and measured × predicted multiplot (b) for the PLS-based MIA-QSAR model.
Figure 6. RMSE (a) and R² (b) in the cross-validation of the MIA-QSAR model.
Table 1. PLS performance to prediction of kcat of modified peptides against
dengue type 2 using MIA-QSAR model
Reference 29 This work
RMSEc 0.08 0.06
R2
cal 0.97 0.98
RMSEcv 0.31 0.31
R2
cv 0.58 0.56
RMSEp 0.30 0.28
R2
test 0.64 0.65
RMSEy-rand – 0.83
R2
y-rand – 0.70
r2
p – 0.52
r2
Figure 7. Leverages × studentized residuals for outlier diagnostic (a), and percentage of successful classification for cross-validation (b) of the PLS-DA model.
Finally, the measured × predicted property plot for training, cross-validation and test sets suggest a good predictive ability for the PLS model (Figure 5b).
A classical data set31 was used to illustrate the classification analysis by PLS-DA. The data set refers to wine samples from three varieties (Barbera, Grignolino and Barolo), which were characterized by measurements of alcohol, total phenol, flavonoid, color intensity, hue color parameter, optical density at 280 nm/optical density at 315 nm and proline. In the original work, the data set was evaluated in order to build classification models. Classification ability was 97.7% using methods like PCA, KNN (K-nearest neighbor) and SIMCA (soft independent modeling of class analogies). Using the Chemoface, the data set was autoscaled. An outlier test was applied using leverages × studentized residuals plot (Figure 7a), and 12 samples were excluded from a total of
Figure 8. Predicted classes for test samples of wines (a) and PLS-DA scores multiplot for calibration and test samples (b).
178. From 166 samples, 55 were selected for test set using the Kennard-Stone algorithm, and 111 were used in the calibration step. A percentage of successful classification plot for cross-validation indicates 2 LV as appropriated (Figure 7b). The 2 LV model presented a good performance according success of classifications about 100% (Table 2, Figure 8a). The score plot for training and test sets showed excellent sample discrimination (Figure 8b).
Table 2. Success of classification of PLS-DA and SIMCA models for
classification of wine samples
SIMCA31 PLS-DA (this work)
SuccessC / % 97.7 100.0
SuccessCV / % – 99.1
Data Plot and Data Organization modules
Scatter plots for data sets can be obtained using the Data Plot module. This is especially useful to plot spectral data. Graphs can be plotted on both original and preprocessed data.
The Data Organization module allows importing numerical data from .txt, .dat, .csv files, and images in .bmp. Multiple files, such as spectra files, can be imported simultaneously. The process of importing images (.bmp) is based on converting them in a three-way array containing the RGB values for each pixel. Then the values of R, G and B are summed to each pixel, resulting in a two-way array (matrix). Finally, this matrix is unfolded to generate a vector. This is particularly useful to import molecular figures to be used as descriptors in MIA-QSAR models.30
Inserting and exporting data
Numerical data can be inserted into Chemoface by two ways: they can be typed directly into the tables; or by copying from any numerical data spreadsheet or from a text file (separated by spaces or tabs) and pasting them directly in the module tables.
Commands to transpose dataset and to delete specific rows and columns are available.
After entering the data, they can be saved to a text file (.txt) properly structured by Chemoface; only this type of text file can be opened by the software. Data from other types of text (unstructured and not saved by Chemoface) may be inserted by copying and pasting as explained earlier. Models obtained by MLR, PCR or PLS can also be saved for further use in the software.
All procedures to insert or save data as described above are carried out through the main menu “File” of Chemoface modules.
The figures obtained can be exported to various image formats with high resolution. The numerical data from graphs can be copied and used in different graphical software. The data tables can also be copied.
Conclusion
The goal of the Chemoface project is to offer a computational tool, which is comprehensive, free and with user-friendly graphical interface for researchers, professors and students dealing with common practices in Chemometrics.
A number of other functions, graphs and tables, in addition to those presented in this work, are available in Chemoface. This version has the main methods used in Chemometrics, but new features and other chemometric methods, such as multivariate curve resolution and three-way approaches can be implemented hereafter.
The development of the program is not fully limited, and contributions from other researchers are welcomed.
The software can be freely downloaded from the Department of Food Science of the Federal University of Lavras, Minas Gerais State, Brazil (Download’s link).32
References
1. Kiralj, R.; Ferreira, M. M. C.; J. Chemom.2006, 20, 247. 2. Neto, B. B.; Scarminio, I. S.; Bruns, R. E.; Quim. Nova2006,
29, 1401.
3. Munck, L.; Nørgaard, L.; Engelsen, S. B.; Bro, R.; Andersson, C. A.; Chemom. Intell. Lab. Syst. 1998, 44, 31.
4. Mostert, M. M. R.; Ayoko, G. A.; Kokot, S.; TrAC, Trends Anal. Chem.2010, 29, 430.
5. Wang, X.; Zhuang, Z.; Zhu, E.; Yang, C.; Wan, T.; Yu, L.;
Microchem. J.1995, 51, 5.
6. Roggo, Y.; Chalus, P.; Maurer, L.; Martinez, C. L.; Edmond, A.; Jent, N.; J. Pharm. Biomed. Anal.2007, 44, 683.
7. Meier, D.; Fortmann, I.; Odermatt, J.; Faix, O.; J. Anal. Appl. Pyrolysis2005, 74, 129.
8. Statistica Software; Statsoft, Inc.: Tucksa, AZ, USA.
9. Pirouette; Infometrix, Inc.: Bothell, WA, USA.
10. Unscrambler; CAMO Software, Inc.: Woodbridge, NJ, USA.
11. Scilab; INRIA: Le Chesnay, France.
12. R; R Development Core Team: Vienna, Austria.
13. Olivieri, A. C.; Goicoechea, H. C.; Inon, F. A.; Chemom. Intell. Lab. Syst. 2004, 73, 189.
14. Clerc, F.; Farrusseng, D.; Mirodatos, C.; Chemom. Intell. Lab. Syst.2008, 93, 167.
15. Matlab; The MathWorks, Inc.: Natick, MA, USA.
16. Lundstedt, A.; Seifert, E.; Abramo, L.; Thelin, B.; Nyström, A.; Pettersen, J.; Bergman, R.; Chemom. Intell. Lab. Sys., 1998,
42, 3.
17. Plackett, R. L.; Burman, J. P.; Biometrika1946, 33, 305. 18. Cestari, A. R.; Vieira, E. F. S.; Tavares, A. M. G.; Bruns, R. E.;
J. Hazard. Mater.2008, 153, 566.
19. Wold, S.; Esbensen, K.; Geladi, P.; Chemom. Intell. Lab. Sys.,
1987, 2, 37.
20. Bratchell, N.; Chemom. Intell. Lab. Sys., 1989, 6, 105.
21. Nunes, C. A.; Guerreiro, M. C.; J. Sci. Food Agric.2012, 92, 433.
22. Vandeginste, B. G. M.; Massart, D. L.; Buydens, L. M. C.; De Jong, S.; Lewi, P. J.; Smeyers-Verbeke, J.; Handbook of Chemometrics and Qualimetrics: Part B, 1st ed; Elsevier
Science: Amsterdam, The Netherlands, 1997.
23. Wold, S.; Sjöströma, M; Eriksson, L.; Chemom. Intell. Lab. Sys., 2001, 58, 109.
24. Roy, P. P.; Paul, S.; Mitra, I.; Roy, K.; Molecules2009, 14, 1660. 25. Roy, K.; Mitra, I.; Kar, S.; Ojha, P. K.; Das, R. N.; Kabir, H.;
26. Ojha, P. K.; Mitra, I.; Das, R. N.; Roy, K.; Chemom. Intell. Lab. Sys., 2011, 107, 194.
27. Mitra, I.; Saha, A.; Roy, K.; Mol. Simul. 2010, 36, 1067. 28. Kennard, R. W.; Stone, L. A.; Technometrics1969, 11, 137.
29. Silla, J. M.; Nunes, C. A.; Cormanich, R. A.; Guerreiro, M. C.; Ramalho, T. C.; Freitas, M. P.; Chemom. Intell. Lab. Syst. 2011,
108, 146.
30. Freitas, M. P.; Brown, S. D.; Martins, J. A.; J. Mol. Struct.2005,
738, 149.
31. Forina, M.; Armanino C.; Castino M.; Ubigli M.; Vitis1986,
25, 189.
32. www.dca.ufla.br accessed in October 2012.