Article
J. Braz. Chem. Soc., Vol. 22, No. 4, 677-683, 2011. Printed in Brazil - ©2011 Sociedade Brasileira de Química
0103 - 5053 $6.00+0.00
A
*e-mail: [email protected]
Pre-concentration of Lithium Prior to Its Determination in Honey by Flame Optical
Emission Spectrometry
Helena Stecka and Pawel Pohl*
Department of Analytical Chemistry, Faculty of Chemistry, Wroclaw University of Technology, Wybrzeze Stanislawa Wyspianskiego 27, 50-370 Wroclaw, Poland
Foi proposto um procedimento para a pré-concentração e determinação de traços de lítio em diferentes méis lorais, empregando para a extração contínua em fase sólida uma resina de troca catiônica fortemente ácida, a Dowex 50W×8-200. Ao se eluir as soluções de méis a 10% em massa, na coluna empacotada com a resina de troca catiônica, os íons Li+, K+ e Na+ foram retidos na resina enquanto que os açúcares simples não foram retidos e se encontraram integralmente nos eluatos. Os cátions Li+, Na+ e K+ foram eluídos com uma solução de HCl 1,0 mol L−1 após a lavagem das colunas com água; os analitos presentes nesse eluato foram determinados por espectrometria de emissão ótica com chama (FOES). O limite de detecção instrumental (LOD) apresentado pelo método foi de 0,05 ng g−1 de lítio e o método foi empregado para a quantiicação de Li em diversos méis naturais e comerciais. A faixa de concentração ótima para a determinação de Li foi de 0,4 a 5,3 ng g−1 com precisão de 8-11%. A exatidão do método proposto foi avaliada por estudos de recuperação do analito e está no intervalo de 98 a 106%, demonstrando a coniabilidade dos resultados obtidos.
A procedure based on solid phase extraction with a strongly acidic cation-exchanger Dowex 50W×8-200 was proposed to pre-concentrate and determine ultra-traces of Li in different loral honeys. When loading 10% (m/v) honey solutions onto columns packed with the cation-exchanger, Li+ ions were retained on the resin along with K+ and Na+, while simple sugars were passed through columns and were entirely found in efluents. In turn, columns were washed with water and eluted with a 1.0 mol L−1 HCl solution to strip Li+ that was subsequently determined in respective eluates by lame optical emission spectrometry (FOES). The proposed method was characterized by a limit of detection (LOD) of 0.05 ng g−1 of Li and later used for analysis of several raw and commercial mono- and multi-lower honeys. It enabled to determine from 0.4 to 5.3 ng g−1 of Li with precision being within 8-11%. Accuracy of this sample pre-treatment procedure and analysis method was assessed applying spike recovery tests. Recoveries of added Li were found to be within 98 to 106%, demonstrating trustworthiness of results achieved.
Keywords: lithium, honey, pre-concentration, determination, flame optical emission spectrometry
Introduction
Lithium in honey is present in trace concentrations and can primarily reach it from soil through nectar and pollen of blossom plants or secretions of living parts of plants. The content of this metal is highly variable and greatly depends on honey provenance as demonstrates data found in literature and related to concentration ranges of Li in honeys of different loral origin and from different countries, e.g., from not detected (ND) to 0.24 µg g−1 in
French honeys,1 from 0.30 to 1.5 µg g−1 in Turkish honeys2
or from ND to 110 µg g−1 in Spanish honeys.3-9 Because Li,
like other alkaline or alkaline earth metals present in honey, is associated with soil characteristics and speciicity, and agricultural practices, it certainly well relects geographical origin and different locality conditions.4-6 Accordingly,
It appears however that Li is occasionally determined in honeys what proves a limited number of works reported so far and devoted to this metal. Inductively coupled plasma optical emission spectrometry (ICP OES) is commonly used for measuring concentrations of Li in honeys, typically along with other metals.1-6 Flame optical
emission spectrometry (FOES), although more inexpensive than ICP OES is curiously rarely used.7-10 In case of both
mentioned techniques, samples of honey are usually calcined, followed by dissolving resulted ash in solutions of mineral acids3-6 or digested in concentrated oxidizing
reagents1,2 before measuring Li concentrations.
Flame OES with C2H2-air lame seems to be quite
expedient technique for measurements of Li with low limit of detection (LOD).11 In contrast to K and Na, Li is
hardly ionized in lame due to relatively high ionization potential (5.39 eV), hence, it could be expected that high concentrations of primarily K and Na as well as Ca and Mg would have a reduced effect on Li determinations. By contrast, high organic matter contents could deteriorate the analytical response for Li and result in high background emission levels.12
For that reason, a solid phase extraction (SPE) procedure was developed in the present work to overcome interferences coming from simple sugars and pre-concentrate traces of Li before its determination in honeys by means of FOES. In addition, it was expected that this procedure would be a good alternative to commonly used acid decomposition or calcinations of honey.1-6 In advance, the effect of various
concentrations of K, Na, glucose and fructose, being the most important constituents of honeys, on the Li response was studied. The sorption behavior of Li and mentioned constituents toward different sorption materials, including an adsorbing resin Amberlite XAD-7HP, a strongly basic anion-exchange resin Dowex 1×4-200, a strongly acidic cation-exchange resin Dowex 50W×8-200 and a mixed bed ion-exchange resin Dowex Retardion 11A8, was examined as well. For selected strong cation-exchanger, retention and recovery conditions for Li were optimized. Validity of a Dowex 50W×8-200 column SPE-based procedure was veriied using spike recovery tests. Finally, this procedure was applied to determine Li in several raw and commercially marked mono- and multi-lower honeys.
Experimental
Reagents and materials
All reagents used in this work were of analytical grade. Chemicals were supplied by POCh (Gliwice, Poland). Ultra-pure water, obtained from a WIGO PRO-11G reverse
osmosis water puriication system (Wroclaw, Poland) was used throughout. Single element stock standard solutions of 1000 mg L−1 of K, Li and Na were obtained from Merck
KGaA (Darmstadt, Germany) and used to prepare mixed standard solutions of these metals for calibration. 100 mL working standard solutions, containing K (10.0 mg L−1), Li
(0.1 mg L−1) and Na (1.0 mg L−1) in addition to glucose and
fructose, both at 10 g L−1, were prepared to study sorption
properties of polymeric resins used. These solutions were acidiied using a 0.010 mol L−1 HCl solution to pH 3.5, 4.0,
4.5 and 5.0 which are close to the acidity of honey solutions. Polymer-based resins were purchased from Sigma-Aldrich (Saint Louis, MO, USA) and included a weakly polar macro-reticular adsorbent Amberlite XAD-7HP (polyacrylic ester matrix, 20-60 mesh size, 450 m2 g−1
surface area), a strongly basic anion-exchanger Dowex 1×4-200 (styrene-divinylbenzene co-polymer matrix, 100-200 mesh size, 1.0 mequiv. g−1 total exchange capacity
for -N(CH3)3+ functional group), a strongly acidic
cation-exchanger Dowex 50W×8-200 (styrene-divinylbenzene co-polymer matrix, 100-200 mesh size, 1.7 meq mL−1
total exchange capacity for -SO3− functional group) and
an amphoteric exchanger Dowex Retardion 11A8 (styrene-divinylbenzene co-polymer matrix, 50-100 mesh size, 1.2 and 1.1 mequiv. g−1, respectively, for -COO− and -N(CH
3)3+
functional groups). Resins were packed into Sigma-Aldrich glass columns (10 mm i.d.) with glass coarse frits and polytetraluoroethylene (PTFE) stopcocks. A Cole-Parmer 4-channel MasterFlex L/S peristaltic pump (Vernon Hill, IL, USA) was employed to control low rates of solutions passed through SPE columns.
Instrumentation and measurements
Measurements of K, Li and Na concentrations in efluents and eluates collected, and honey sample solutions were made with a Perkin Elmer (Norwalk, CT, USA) lame atomic absorption spectrometer, model 1100B. It was equipped with a 10 cm single slot burner head for a C2H2-air combustion lame. A sampling unit integrated
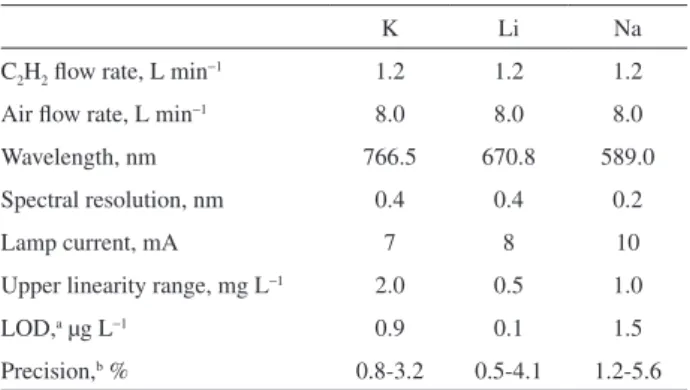
with the burner comprised a plastic coated mixing chamber with a low spoiler and an end cap with a drain interlock assembly. Solutions were continuously aspirated through a mounted stainless steel nebulizer. Working conditions for instrument operation (Table 1) were selected according to recommendations of the spectrometer manufacturer given for K, Li and Na measurements in an oxidizing C2H2-air
and averaged in each read cycle. Sample solutions were directly analyzed against aqueous standard solutions. Three replicate measurements were made and averaged.
Concentrations of glucose and fructose in column effluents collected were measured using the Somogyi-Nelson spectrophotometric method. In a two-step procedure, a sample portion containing glucose and fructose with added an alkaline solution of Cu(II) ions was heated in a boiling water bath to reduce Cu(II) to Cu(I) ions. In turn, an arsenomolybdate reagent, prepared by reacting ammonium molybdate [(NH4)6Mo7O24] with sodium
arsenate (Na2HAsO4) in H2SO4, was added to produce a
polymolybdate complex of intensive blue color due to a redox reaction with resulting Cu(I) ions.13 The absorbance
of molybdenum blue produced was measured at 520 nm using a Thermo Scientific Spectronic 20D+ digital spectrophotometer (Bremen, Germany). The concentration of simple sugars was determined against suitable standard solutions containing glucose at concentrations ranging from 1 to 50 mg L−1. Alkaline Cu(II) and arsenomolybdate reagent
solutions used were prepared according to reference 13.
Resin conditioning and column operation
Amberlite XAD-7HP resin was initially dried in an oven at 110 °C for 2 h. Portions containing 1.5 g of this resin were soaked with methanol and then with water, and inally poured into SPE columns as water slurries. Resin beds were conditioned by washing with 10 mL of methanol, followed by 20 mL of water. After that, they were rinsed with 10 mL of a 4.0 mol L−1 HCl
solution, and again with 40 mL of water to remove excessive HCl. In case of ion-exchangers, 1.5 g portions were soaked with water and poured into SPE columns. Resin beds were washed with 10 mL of a
4.0 mol L−1 HCl solution, followed by 40 mL of water.
Thus, counter ions of functional groups of ion-exchangers were H+ and/or Cl− ions. Water and conditioning solutions
were passed through SPE columns at 2.0 mL min−1.
To investigate sorption behavior of resins toward Li ions and simple sugars under pH changed from 3.5 to 5.0, working standard solutions described above were passed through SPE columns at 1.0 mL min−1. After passing
about 80% of solutions, column efluents (10 mL) were collected and analyzed for K, Li, Na and glucose with fructose concentrations (Cefluent). Recovery eficiencies of
K, Li, Na and simple sugars (%) were evaluated relating concentrations of these constituents determined in efluents (Cefluent) to their original concentrations present in loaded
solutions (C) according to equation 100×Cefluent/C. The
effect of HCl concentrations (0.5, 1.0, and 2.0 mol L−1) in
eluting solutions on recoveries of K, Li and Na ions from Dowex 50W×8-200 cation-exchanger was examined as well. Accordingly, 100 mL working solutions (pH 4.0) were passed through SPE columns at 6.0 mL min−1. In
turn, metal ions retained were recovered using 5 or 10 mL portions of HCl solutions that were passed through SPE columns at 1.0 mL min−1. Volumes of 5 and 10 mL eluate
portions were collected and analyzed for the contents of K, Li and Na (Celuate) against adequate matrix matching
standard solutions. Recovery eficiencies (%) were assessed considering concentrations of K, Li and Na found in eluates (Celuate) and those in loaded solutions (C) according to
equations 100 × Celuate / 20 × C or 100 × Celuate / 10 × C.
Retention and recovery eficiencies were average values of three independent replicates. Respective column blanks were run and considered in calculations.
Honey samples and pre-concentration procedure
Four raw honeys, i.e., acacia lower, linden lower, rape lower and multi-lower, directly taken from holding tanks just a few days after their extraction from combs, were from an apiary located in Kostrzyn by the Oder (western Poland, Lubusz Voivodeship, Gorzow County). Additionally, four commercially available (Apis Apiculture Cooperative, Lublin, Poland) honeys of the same type were analyzed. Honeys were stored in plastic containers (raw honeys) or original glass jars in which they were dispatched (commercial honeys).
Before sampling, honeys were homogenized by vigorously stirring with glass rods. Prior to analysis, different amounts of honeys (1.0, 1.5 and 2.5 g) were dissolved in water and diluted to 100 mL. A volume of 100 mL 10% (m/v) honey solutions were loaded onto SPE columns and driven through 0.7 g Dowex 50W×8-200 resin
Table 1. Operating conditions and analytical performance for determining K, Li and Na by FOES
K Li Na
C2H2 low rate, L min−1 1.2 1.2 1.2
Air low rate, L min−1 8.0 8.0 8.0
Wavelength, nm 766.5 670.8 589.0
Spectral resolution, nm 0.4 0.4 0.2
Lamp current, mA 7 8 10
Upper linearity range, mg L−1 2.0 0.5 1.0
LOD,a µg L−1 0.9 0.1 1.5
Precision,b % 0.8-3.2 0.5-4.1 1.2-5.6
a(3×SD of average intensity signal for a water blank without Li, n = 5). bExpressed as RSD of average intensity signals (n = 3) for 0.05, 0.10, 0.20
beds at 6.0 mL min−1 to retain Li. Then, SPE columns were
washed with water (10 mL) and submitted to elution with 5.0 mL of a 1.0 mol L−1 HCl solution at 1.0 mL min−1.
Respective 5.0 mL eluate portions, after discarding column dead volumes, were collected and analyzed. Finally, concentrations of Li in eluates were determined using FOES versus matrix matching (containing 1.0 mol L−1 HCl)
standard solutions. Procedural blanks were considered in the inal calculations.
Results and Discussion
Effect of K, Na, glucose and fructose on Li response
Potassium and Na have the highest share in different Polish loral honeys,14i.e., to over 3200 µg g−1 (K) and up
to 100 µg g−1 (Na), these metals are also easily ionized in
C2H2-air lames. For that reason, the effect of K and Na
concentrations on the analytical performance of FOES for Li was studied in detail. Concentrations of K and Na in standard working solutions were changed from 0.50 to 200 mg L−1 and from 0.05 to 10.0 mg L−1, respectively.
This corresponded to 5.0% (m/v) solutions of honey in which K is present at 10 to 4000 µg g−1 while Na at 1 to
200 µg g−1. The concentration of Li in all these solutions
was 0.10 mg L−1.
Determining Li concentrations using calibration with aqueous standard solutions it was found that K and Na present at studied concentration intervals practically had no effect on intensity signals obtained for the Li emission line. The average Li concentration measured in these conditions was 0.10 mg L−1 with the relative standard deviation (RSD)
of 0.5% for K and 1.0% for Na.
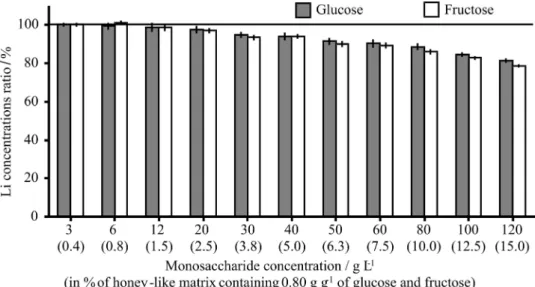
In the same way, the separate effect of glucose and fructose as the most abundant constituents of the organic honey matrix was examined. Concentrations of glucose or fructose in standard working solutions were in the range of 3 to 120 g L−1 corresponding to 0.4 and 15.0% (m/v)
solutions of honey, respectively, in which these simple sugars account for 0.80 g g−1.15 Both monosaccharides
were found to have a detrimental effect on the analytical performance of FOES for Li when using calibration with aqueous standard solutions (Figure 1). Physical and chemical interferences related to increasing contents of glucose or fructose in solutions likely affected Li intensity signals since they were gradually suppressed. As a result, concentration of Li in solutions containing glucose or fructose at 30 g L−1 were found to be lower by about
6-7% than its initial concentration of 0.10 mg L−1 in these
solutions. In case of solutions containing 120 g L−1 of one
of simple sugars, concentrations of Li determined under these conditions were lower by 19-22% as compared to its initial concentration.
However, when allowable 1.0, 1.5 or 2.5% (m/v) solutions of honey were analyzed, it was impossible to determine Li because its concentration was lower than the respective instrumental LOD assessed for FOES (Table 1). Quite opposite, concentrations of K and Na in analyzed honeys, evaluated to be within 190-470 µg g−1 (K) and
5-170 µg g−1 (Na), were so high that prepared honey
solutions required to be subsequently diluted before FOES measurements.
For that reason, it was decided to prepare concentrated honey solutions and separate Li from simple sugars matrix and/or pre-concentrate it before measurements by FOES using SPE.
Figure 1. Ratios of Li concentrations (average values, n = 3 ± SD) determined by FOES in working standard solutions of Li (0.10 mg L−1) containing
Sorption properties of different polymeric resins toward K, Li, Na, glucose and fructose
The sorption behavior of four different sorbents, i.e., non-ionic Amberlite XAD-7HP, and ionic Dowex 1×4-200, Dowex 50W×8-200 and Dowex Retardion 11A8, toward K, Li and Na ions, and glucose and fructose was tested as describe above.
On the basis of these measurements (Table 2) it was possible to conclude that only strongly acidic cation-exchanger Dowex 50W×8-200 led to a quantitative separation of glucose and fructose from Li ions at pH 3.5-5.0. In these conditions, Li ions were completely retained by the resin along with K and Na ions. Considering that much more concentrated solutions of honey would have to be passed through SPE columns to pre-concentrate traces of Li, the effect of glucose and fructose concentrations on retention efficiency of Li by Dowex 50W×8-200 cation-exchanger was studied. Working standard solutions (pH 4.0) containing glucose and fructose at concentrations of 40, 60, 80, 100 and 120 g L−1 were used for that purpose.
After analysis of respective column efluents against calibration with matrix matching standard solutions containing the same concentrations of simple sugars, it was found that glucose and fructose did not affect the sorption of alkaline metals by Dowex 50W×8-200. Accordingly, K, Li and Na were not detected in collected efluents, while glucose and fructose were determined in these efluents at
the same levels as in original solutions loaded onto SPE columns. In the similar way, it was ascertained that retention of Li ions as well as of K and Na ions was quantitative when working standard solutions (pH 4.0) were driven through SPE columns with Dowex 50W×8-200 at much higher low rates, i.e., 2.0, 4.0, 6.0, 8.0 and 10 mL min−1. Additionally,
it was assessed that such ions as Ca (1.0 mg L−1), Fe
(0.2 mg L−1), Mg (2.0 mg L−1), Mn (0.1 mg L−1) and Zn
(0.1 mg L−1), added to working standard solutions of K, Li
and Na (pH 4.0), were also retained by Dowex 50W×8-200 with eficiencies ranged from 92 to 103% at different low rates studied, i.e., 1, 2, 4, 6, 8 and 10 mL min−1.
A corresponding behavior of Dowex 50W×8-200 toward K, Li and Na ions, glucose and fructose at different low rates was also established in case of 0.7 g resin beds. This could result from certain advantages of this gel-type resin, including a high loading capacity and a fast reactivity due to lack of discrete pores.16 Consequently, solute
ions easily diffuse through particles to interact with ion exchange sites.
Finally, 0.5, 1.0 and 2.0 mol L−1 HCl solutions were
tested for recoveries of Li from 0.7 and 1.5 g resin beds of Dowex 50W×8-200 applying 5.0 and 10 mL portions of these solutions. In case of 1.5 g resin beds it was found that 10 mL of a 2.0 mol L−1 HCl solution produce total
desorption of Li ions from SPE columns (Figure 2). Potassium and Na ions were also quantitatively recovered from the resin under these conditions. For 0.7 g resin beds,
Table 2. Recoveries (%) of K, Li, Na and simple sugars from efluents resulted from passing working standard solutions through SPE columns packed with Amberlite XAD-7HP, Dowex 1×4-200 resins, Dowex 50W×8-200 and Dowex Retardion 118A resins
pH Constituent Amberlite XAD-7HP Dowex 1×4-200 Dowex 50W×8-200 Dowex Retardion 118A
3.5 K 99.1 ± 1.8 99.2 ± 1.1 < 0.01 100 ± 1
Li 100 ± 1 100 ± 1 < 0.1 100 ± 1 Na 104 ± 1 100 ± 1 < 0.2 100 ± 1
Sugars 97.1 ±1.2 102 ± 3 101 ± 1 99.2 ± 1.2
4.0 K 101 ± 1 98.1 ± 2.2 < 0.01 99.0 ± 0.9
Li 99.2 ± 1.2 100 ± 1 < 0.1 99.4 ± 0.7
Na 100 ± 1 98.4 ± 1.0 < 0.2 98.3 ± 2.5
Sugars 95.5 ± 3.2 104 ± 4 104 ± 4 104 ± 5
4.5 K 98.4 ± 0.9 99.3 ± 2.5 < 0.01 101 ± 2
Li 99.6 ± 1.1 98.6 ± 2.3 < 0.1 99.1 ± 1.3
Na 99.3 ± 1.4 98.3 ± 0.8 < 0.2 98.5 ± 1.0
Sugars 103 ± 1 104 ± 3 108 ± 6 100 ± 4
5.0 K 96.7 ± 3.0 98.4 ± 1.7 < 0.01 98.8 ± 1.1
Li 97.3 ± 2.2 97.8 ± 1.3 < 0.1 100 ± 1
Na 98.1 ± 2.1 96.5 ± 1.9 < 0.2 98.2 ± 2.1
Sugars 92.6 ± 9.1 92.9 ± 4.5 103 ± 3 102 ± 6
already 5.0 mL portions of 1.0 or 2.0 mol L−1 HCl solutions
resulted in total recovery of Li.
Analytical application, pre-concentration and determination of Li in honeys
To apply the devised Li separation/pre-concentration SPE procedure, 10% (m/v) solutions of analyzed honeys were driven at 6.0 mL min−1 through 0.7 g resin beds of
Dowex 50W×8-200. After loading of honey solutions, SPE columns were washed with 10 mL of water and then, they were eluted using 5.0 mL of a 1.0 mol L−1 HCl solution.
Respective eluates were collected for determination of the concentration of Li by FOES.
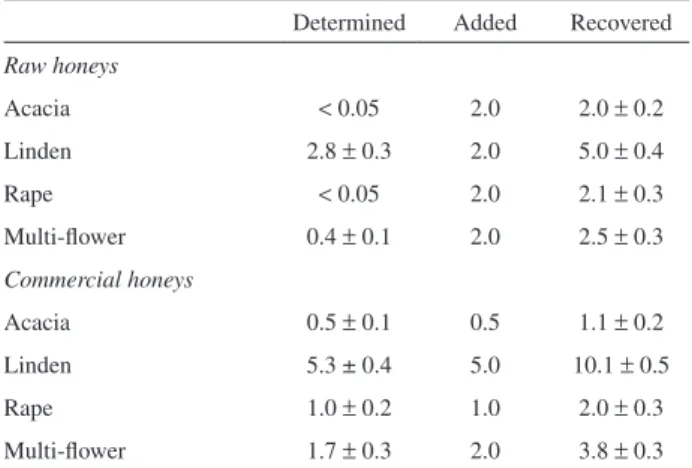
Results of Li determinations are given in Table 3 and they demonstrate that precision (as RSD) of analysis with this method is satisfactory; with typical variations from 8 to 12%, while in case of very low concentrations of Li it is within 20-25%. To evaluate the accuracy of this method of Li pre-concentration and determination in honey, 10% (m/v) solutions of honeys were spiked with Li so as to double its original content. Next, these sample solutions were treated with Dowex 50W×8-200 SPE columns. It was found that recoveries of added Li were within 98.0-106%. Additionally, eluates achieved were analyzed by lame atomic absorption spectrometry (FAAS) using the same instrument and against calibration with matrix matching solutions. It was found that comparable concentrations of Li were determined; differences in results were lower than 20%. This proves the reliability of the proposed sample preparation SPE-based procedure and FOES analysis method. The established method LOD for Li (3×SD of average intensity signal for a SPE procedural blank resulted from passing 100 mL of water (pH 4.0) through a
Dowex 50W×8 column and eluting the resin bed with 5 mL of a 1.0 mol L−1 HCl solution, n = 3) was 0.05 ng g−1. This
LOD also considered the honey concentration in an analyzed 10% (m/v) solution and the enrichment factor. Considering analysis of a 2.5% (m/v) honey solution, the enrichment factor was 80, i.e., (100 mL / 5 mL) × (10.0 g / 2.5 g).
Conclusions
Providing a fast SPE procedure based on use of a gel-type strongly acidic cation-exchanger Dowex 50W×8-200, it was possible to precisely and accurately determine Li in honeys at a ng g−1 level by using FOES after its
pre-concentration and separation from simple sugars. Considering the retention behavior of the exchanger used, the method proposed could be even simpliied when
Table 3. Concentrations (in ng g-1) of Li in raw and commercial loral
honeys determined by FOES after Li pre-concentration using SPE with Dowex 50W×8-200 resin
Determined Added Recovered
Raw honeys
Acacia < 0.05 2.0 2.0 ± 0.2
Linden 2.8 ± 0.3 2.0 5.0 ± 0.4
Rape < 0.05 2.0 2.1 ± 0.3 Multi-lower 0.4 ± 0.1 2.0 2.5 ± 0.3
Commercial honeys
Acacia 0.5 ± 0.1 0.5 1.1 ± 0.2
Linden 5.3 ± 0.4 5.0 10.1 ± 0.5
Rape 1.0 ± 0.2 1.0 2.0 ± 0.3
Multi-lower 1.7 ± 0.3 2.0 3.8 ± 0.3 Average values (n = 3) ± SD.
applying syringe cartridges or implementing the procedure into a low-injection analysis mode.
References
1. Devillers, J.; Dore, J. C.; Marenco, M.; Poirier Duchene, F.; Galand, N.; Viel, C.; J. Agric. Food Chem.2002, 50, 5998. 2. Bagci, Y.; Arslan, D.; Ozcan, M. M.; Dursun, N.; Int. J. Food
Sci. Nutr.2007, 58, 567.
3. Terrab, A.; Recamales, A. F.; Gonzalez Miret, M. L.; Heredia, F. J.; Food Chem.2005, 92, 305.
4. Terrab, A.; Hernanz, D.; Heredia, F. J.; J. Agric. Food Chem.
2004, 52, 3441.
5. Gonzalez Miret, M. L.; Terrab, A.; Hernanz, D.; Fernandez Recamales, M. A.; Heredia, F. J.; J. Agric. Food Chem.2005,
53, 2574.
6. Rodriguez Garcia, J. C.; Rodriguez Iglesias, R.; Pena Crecente, R. M.; Garcia, J. B.; Garcia Martin, S.; Herrero Latorre, C.;
J. Agric. Food Chem.2006, 54, 7206.
7. Latorre, M. J.; Pena, R.; Pita, C.; Botana, A.; Garcia, S.; Herrero, C.; Food Chem.1999, 66, 263.
8. Latorre, M. J.; Pena, R.; Garcia, S.; Herrero, C.; Analyst2000,
125, 307.
9. Hernnandez, O. M.; Fraga, J. M. G.; Jimenez, A. I.; Jimenez, F.; Arias, J. J.; Food Chem.2005, 93, 449.
10. Nasiruddin Khan, M.; Qaiser, M.; Mubashir Raza, S.; Rehman, M.; Int. J. Food Sci. Technol.2006, 41, 775.
11. Welz B.; Sperling, M.; Atomic Absorption Spectrometry, 3rd ed., Wiley-VCH Verlag GmbH.: Weinheim, 1999.
12. Price, W. J.; Spectrochemical Analysis by Atomic Absorption, Heyden & Son Ltd.: London, 1979.
13. BeMiller, J. N.; Low, N. H. In Food Analysis; Nielsen, S. S., ed.; Aspen Publishers: Gaithersburg, 1998, pp. 167-188. 14. Chudzinska M.; Baralkiewicz, D.; Food Chem. Toxicol.2010,
48, 284.
15. Fournier, E. In Handbook of Food Analytical Chemistry; Wrolstad, R. E.; Acree, T. E.; Decker, E. A.; Penner, M. H.; Reid, D. S.; Schwartz, S. J.; Shoemaker, C. F.; Smith, D.; Sporns P., eds.; John Wiley & Sons: New York, 2005, pp. 651-660. 16. Zagorodni, A. A.; Ion Exchange-Materials, Properties and
Applications, Elsevier: Amsterdam, 2007.