Article
J. Braz. Chem. Soc., Vol. 22, No. 4, 669-676, 2011. Printed in Brazil - ©2011 Sociedade Brasileira de Química
0103 - 5053 $6.00+0.00
A
*e-mail: [email protected]
EPR and Magnetic Studies of a Carboxylate-Bridged Dinuclear Copper(II)
Compound: [Cu
2(lu)
4(dmf)
2]
Otaciro R. Nascimento,*,a Lia M. B. Napolitano,a María H. Torre,b
Octavio Peñac and Rafael Calvod
aGrupo de Biofísica Molecular Sergio Mascarenhas, Departamento de Física e Informática, Instituto de
Física de São Carlos, Universidade de São Paulo, CP 369, 13560-970 São Carlos-SP, Brazil
bQuímica Inorgánica, Universidad de la República (UDELAR), Gral. Flores 2124, CC 1157,
Montevideo, Uruguay
cUMR 6226 CNRS, Sciences Chimiques de Rennes, Université de Rennes 1, 35042 Rennes, France
dFacultad de Bioquímica y Ciencias Biológicas, Universidad Nacional del Litoral and
INTEC (CONICET-UNL), Güemes 3450, 3000 Santa Fe, Argentina
Reportamos neste trabalho os estudos magnéticos e de RPE do composto [Cu2(lu)4(dmf)2] (lu = lufenamato e dmf = dimetilformamida), tendo os ions CuII como unidades dinucleares em
forma de tetracarboxilato “paddle wheel”. Medidas de susceptibilidade magnética na faixa de temperatura 10 ≤ T ≤ 275 K permitiram a determinação da energia de interação antiferromagnética J0 = –294 ± 5 cm-1 entre os íons CuII (H
ex = −J0S1·S2). Medidas de RPE (espectroscopia de ressonância paramagnética eletrônica) em temperatura ambiente com a amostra em pó e monocristal em bandas X e Q resultaram nos valores g// = 2.373, g⊥ = 2.073 e parâmetros de campo zero D = (–0.334 ± 0.001) cm−1 e E ca. 0. Medidas com a intensidade integrada do sinal de RPE do
monocristal na faixa de temperatura 40 ≤ T ≤ 295 K indicaram o valor de J0 = −283 ± 5 cm−1. Um
limite superior de |J´| < 5×10⁻³ cm-1 para o acoplamento de intercâmbio entre unidades dinucleares
vizinhas a distâncias de ca. 14.24 Å foi estimado com base na variação angular do espectro ao redor do ângulo mágico. Os resultados são discutidos com base na estrutura da unidade dinuclear e das ligações que conectam os íons de CuII, comparando-os com compostos similares descritos
na literatura.
We report magnetic and EPR (electron paramagnetic resonance) spectroscopy studies of [Cu2(lu)4(dmf)2] (lu = lufenamate and dmf = dimethylformamide), which has CuII ions in
tetracarboxylate “paddle wheel” dinuclear units. Susceptibility measurements at 10 ≤ T ≤ 275 K allowed the evaluation of an antiferromagnetic intradinuclear exchange coupling J0 = –294 ± 5 cm-1
between CuII ions (H
ex = −J0S1·S2). EPR experiments at 300 K in powder and single-crystals at 9.5 and 34.4 GHz indicated g// = 2.373, g⊥ = 2.073 and zero ield splitting parameters D = (–0.334 ± 0.001) cm−1 and E ca. 0. EPR signal intensity measurements at X-band in the
range 4 ≤ T ≤ 295 K indicated that J0 = −283 ± 5 cm−1. A higher limit |J´| < 5×10⁻³ cm-1 for the
interdinuclear exchange coupling between neighbor units at ca.14.24 Å was estimated from the angular variation of the single crystal spectra around the magic angles. The results are discussed in terms of the structure of the dinuclear unit and the bridges connecting CuII ions and compared
with values reported for similar compounds.
Keywords: copper(II), dinuclear complex, magnetic properties, EPR spectroscopy
Introduction
Studies of copper dinuclear compounds,1 the simplest
coupled magnetic systems, allow evaluating the exchange
couplings between CuII ions and correlating them with
structural information for a better understanding of these couplings. These investigations provided the starting point of molecular magnetism,2 a ield that strongly motivated
to combine in chains or rings.5,6 The great structural diversity
of the “paddle wheel” units reported over ca. 60 years7
maintained the interest in their magnetic properties. Interesting quantum phase transitions produced by randomly distributed interactions between one unit and the “bath” of other units in the lattice have been recently observed by EPR.6,8
We report here magnetic measurements and single-crystal and powder EPR spectra of tetrakis(μ2-N
-3-triluoro-methylphenylanthranilato-O,O’
)-bis(dimethylformamide)-di-copper(II), a CuII dinuclear compound (C
62H50Cu2F12N6O10)
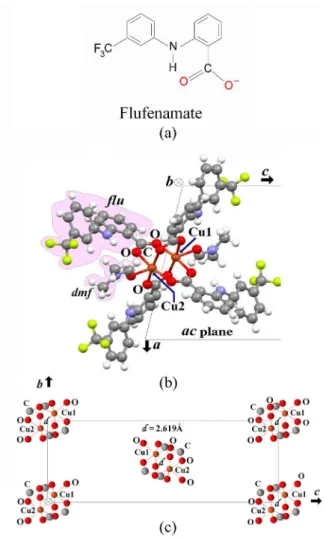
herein called [Cu2(lu)4(dmf)2] (lu = deprotonated N
-3-triluromethylphenylanthranilic acid, called lufenamate, and dmf = dimethylformamide, see Figure 1a). [Cu2(lu)4(dmf)2]
crystallizes9 in the monoclinic space group P2
1/c with lattice
parameters a = 12.727 Å, b = 9.263 Å, c = 26.940 Å, α = γ = 90°, β = 102.830° and Z = 2 molecules per unit cell
(Figure 1b).The copper atoms are in an elongated octahedral environment, equatorially coordinated to four carboxylate oxygen atoms from the lu ligands with Cu···O bond distances between 1.961 and 1.968 Å, and axially connected to dmf oxygen atoms at 2.129 Å. The four symmetry related CuII
ions in the unit cell have fractional coordinates [x, y, z] ≡ [0.4656, 0.0918, 0.0298] and atoms at sites (1) ≡ [x, y, z], (2) ≡ [–x,–y,–z], (3) ≡ [–x, ½+y, ½–z] and (4) ≡ [x, ½–y, ½+z], with sites (1) and (3) related by inversion operations to (2) and (4), and sites (1) and (2) related by C2 rotations around b to (3) and (4), respectively. Pairs (1+2) and (3+4) of CuII ions at 2.619 Å are bridged by four carboxylate groups from lufenamate ions giving rise to two centrosymmetrical “paddle wheel” dinuclear units A and B per unit cell, related by a C2 operation around the b axis (Figure 1c).
We discuss the magnetic parameters evaluated for [Cu2(lu)4(dmf)2] in terms of results reported for other
dinuclear CuII compounds showing tetracarboxylate
“paddle wheel” structures with lufenamate ligands.10 An
upper limit for the magnitude of the exchange coupling between neighbor types A and B units at ca.14.24 Å was
obtained and compared with couplings between spins at long distances in other compounds.
holder, with the b direction parallel to a side of the cube
(see, e.g., Figure 3 of reference 11). This holder provides
a laboratory frame of axes with the crystal directions
b, c and a* = b×c along the y, z and x directions of the
cube, respectively. It was mounted on top of a pedestal inside the cavity, so the spectra could be measured as a function of the orientation of the magnetic ield B0 = µ0
H = B0 h, where µ0 is the permeability of the vacuum
and h = (sinθ cosφ, sinθ sinφ, cosθ), at ca. 5o intervals
in the three crystal planes. The EPR samples included a spectrum of MgO:CrIII (g = 1.9797) as a paramagnetic
signal intensity marker.
Magnetic measurements
The magnetic susceptibility was measured with a Quantum Design MPMS XL5 Squid magnetometer. A sample containing 66.0 mg of powdered material was packed in Telon ilm having a small diamagnetic contribution, and measured in the temperature range 10 ≤ T ≤ 275 K, with B0 = 200 mT.
EPR measurements
Spectra at ca. 9.50 GHz (X-band) and ca. 34.4 GHz
(Q-band) were collected with Bruker ELEXSYS E-580 and Varian E-110 EPR spectrometers, respectively. The powder measurements were performed at Q- and X- bands at T = 300 K. The spectra of a single crystal were measured at Q-band and T = 300 K as a function of magnetic ield orientation. The temperature variation of a single crystal signal was measured for a ixed ield orientation in the temperature range 40 ≤ T ≤ 295 K at X-band, using a liquid helium cryostat.
Computational tools
package working under MATLAB.13 The Cambridge
Crystallographic Database4 and the crystal structure
visualization program Mercury14 were used along this work.
Results and Discussion
Magnetic results and analysis
The molar magnetic susceptibility data χ(T) are displayed in Figure 2, after subtracting the diamagnetic contribution calculated by standard methods.2
Above ca. 80 K χ(T) is characteristic of an antiferromagnetically coupled dinuclear unit, with χ(T) showing a maximum at Tmaxca. 250 K and decreasing
above and below Tmax. Below ca. 70 K χ(T) increases
again with decreasing T, due to traces of paramagnetic mononuclear CuII spins that become important at low T.2
When the exchange coupling between CuII ions with spins
S1 and S2 in a dinuclear unit is deined as Hex = –J0S1.S2,
the magnetic susceptibility for a mol of units is given by:1,2
(1)
where NAv, kB and µB are the Avogadro’s number,
Boltzmann’s constant and Bohr magneton, respectively, and
g is the angular averaged g-factor of CuII ions in dinuclear
units. Since there are traces of paramagnetic mononuclear CuII (ρ = [number of CuII ions in mononuclear sites]/
[number of CuII ions in dinuclear sites]), their contribution
to equation 1 is important and should be considered to evaluate χ(Τ):2
(2)
where we approximate the g-factor of the mononuclear component as equal to that of copper(II) in dinuclear units. Fitting equation 2 to the data in Figure 2 we obtained:
g = 2.09 ± 0.03, J0 = (–294 ± 5) cm-1 and ρ = 0.012
The values of χ(Τ) calculated with these parameters and equation 2 agree well with the data (see solid line in Figure 2). The contribution of the mononuclear impurities introduces an uncertainty in the g-value of the units, but this is less relevant in evaluating J0.
EPR results
Figures 3a and 3b display as solid lines the EPR spectra of powder samples of [Cu2(lu)4(dmf)2] observed at Q- and
X-bands at room temperature. The magnetic ields at the
Figure 1. (a) The lufenamate (lu) anion. (b) View of the [Cu2(lu)4(dmf)2]
molecule along the b axis (igure generated with data from reference 9). The lu anion and the dmf molecule in the left hand side are emphasized. (c) Arrangement of the dinuclear units in the crystal. The shortest distance between neighbor rotated dinuclear units is 14.24 Å.
Figure 2. Temperature dependence of the molar magnetic susceptibility χ(T). Circles are experimental results. Solid lines are
Around 500 mT, the weak one-quantum forbidden transition MS = ±1 ↔∓1 displays a resolved hyperine
pattern (Figure 3a). The room temperature X-band powder spectrum (Figure 3b) displays the strong B⊥2 peak and the weaker Bz2peak above 200 mT, as well as a peak around 310 mT (g ca. 2.1-2.3) that corresponds to the superposition
of the DQ signal and that of traces of mononuclear species in the sample (M). At X-band the B⊥1 peak is not observed and the Bz1 peak could not be unambiguously assigned because it overlaps the one-quantum forbidden transition ∆MS = ±2. Both spectra exhibit the resonance
corresponding to the MgO:CrIII marker (Figures 3a and 3b).
In single-crystal samples, each unit gives rise to the two allowed transitions, MS = ±1 ↔ 0, and one forbidden transition
MS = ±1 ↔∓1 at low ield. So, six resonances arise from the
two rotated units for most magnetic ield orientations. Selected dχ”/dB0 vs. B0 spectra observed at Q-band at different
orientations of B0 in the bc plane at 300 K (solid lines in
Figures 4a-e) relect these characteristics. In the bcplane
Positions and widths of each resonance were calculated by itting the observed peaks to gaussian line shapes. The
Figure 3. Room temperature EPR spectra (dχ”/dB0) of powder samples
of [Cu2(lu)4(dmf)2] at (a) Q and (b) X bands. Solid and dotted lines are experimental results and simulations respectively (see text).
angular variations of these positions observed in the planes
a*c, bc and a*b are displayed in Figure 5 where empty and
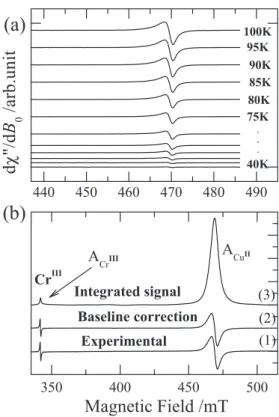
illed symbols correspond to units A and B, respectively. Selected single crystal spectra collected at X-band and 40 < T < 295 K for the ield orientation in the a*c
plane, where the single allowed resonance appears at the highest ield (B0ca. 470 mT) and does not overlap with the
resonances of the CrIII marker and the mononuclear species,
are displayed in Figure 6a. At 40 K no signals arising from the dinuclear units appear. In Figure 6b the spectrum (1) displays dχ”/dB0 observed at 180 K; its baseline is corrected
in the spectrum (2) and its integral is displayed in (3). The areas of the peaks corresponding to the dinuclear species (ACuII) and to the CrIII marker (ACrIII) were calculated at each
T from Figure 6b-3 and the ratio R = ACuII/ ACrIII of these
areas is plotted in Figure 7 as a function of temperature.
Analysis of the EPR results
The EPR spectra of isolated dinuclear units have been discussed in textbooks,17-20 and we analyzed our
Figure 5. Field positions of the resonances corresponding to dinuclear units A (empty symbols) and B (illed symbols) observed at 34.5 GHz and T = 298 K as a function of the orientation of B0 in the planes:
(a) a*c, (b) bc, and (c) a*b of a single crystal sample. Triangles indicate
the MS = ± 1 → 0 transitions, circles represent the “forbidden” resonance with |∆MS| = 2. The solid lines were drawn from the parameters obtained
using EasySpin12 given in the text.
Figure 6. (a) Selected X-band single crystal EPR spectra observed in the range 40 ≤ T ≤ 295 K for a special orientation in the a*c plane (see text).
(b) Wider ield sweep showing together the peak of the dinuclear unit and that of the CrIII marker at 180 K. (1) Observed spectrum (dχ”/dB
0).
(2) Observed spectrum with a baseline correction. (3) Integral of the spectrum (2), allowing calculating the areas of the two peaks, ACuII and ACrIII, and the normalized intensity ratio R = ACuII/ ACrIII as a function of T.
Figure 7. Normalized intensity ratio R between the areas of the
integrated single crystal peak of the dinuclear unit and that of the peak corresponding to the MgO:Cr3+ marker (see Figure 6), as a function
of temperature. Symbols are experimental results; the solid line represents the best it of equation 8 to the data.
data in powder and single crystals as described in recent publications.6,8,21 When the couplingsbetween CuII ions in
The hyperine coupling Hhiper between electronic and
nuclear spins (I1 and I2) is described by an A matrix as:
Hhiper = S1.A.I1 + S2.A.I2 (6)
With the transformations SA = S1 + S2, (SA = 1, 0), and
IA= I1 + I2, (IA = 3, 2, 1, 0), of the electronic and nuclear
spin operators for the unit A, one arrives to:17-19
H0(A) = µB B0.gA.SA – ½ J0SA(SA+1) + SA.DA.SA + SA.AA.IA (7)
where the SA=1 triplet state giving rise to the EPR signal
has a g-matrix gA and zero ield splitting and hyperine
interaction matrices DA = D /4 and AA = A/2. The spectra and
the matrices22 g
B, DB and AB for units type B are obtained
by a C2 rotation around b of the spectra and matrices for
units type A. Assuming units having axial symmetry, the powder and single-crystal spectra predicted by equation 7 can be simulated in terms of ive spin Hamiltonian parameters: two principal values of gA, g// and g⊥,the axial principal value D of the DA matrix, plus two principal values of the
A-matrix, A// = Azz and A⊥ (along and perpendicular to the Cu-O bonds, respectively). This approximation assumes the same principal axes for the matrices g, D and A (see later). Ozarowski proved that D is negative for tetracarboxylate CuII “paddle wheel” dinuclear units.23
Simultaneous least squares optimization of powder spectra simulations at Q and X bands, shown in dotted lines in Figures 3a and 3b, allowed obtaining the spin Hamiltonian parameters
g// = 2.373 ± 0.004, g⊥= 2.073 ± 0.004 , D = (–0.334 ± 0.001) cm-1 and E ca. 0
The variation of the position of the resonances observed with the orientation of B0 in single crystal
samples (Figure 5) allows obtaining the parameters involved in the matrices gA, DA and AA using EasySpin.
The hyperine coupling parameters A// and A⊥ obtained
parameters
A// = (70 ± 10)×10-4 cm-1 and A⊥ = (2 ± 1)×10-4 cm-1
were calculated from simulations of the structure resolved around 800 mT along some ield directions in the bc plane
(Figures 4b-e), and used to simulate the hyperine splitting in the powder spectra (see Figures 3a and 3b), in good agreement with the data.
The exchange parameter J0 was obtained from the
variation with T of the EPR signal intensity of the dinuclear unit (Figures 6a and 6b).24 The ratio R between
the areas of the peak of the single crystal spectra and the peak corresponding to the marker (Figure 6) is displayed in Figure 7 as a function of T. For antiferromagnetically coupled units, R(T) follows:24
(8)
and we obtained J0 = (−283 ± 5) cm−1 from a least-squares
it of equation 8 to the data included as a solid line in Figure 7. Measuring the variation with T of a single crystal EPR signal (instead of a peak of the powder spectra) avoids errors arising from contribution of the mononuclear impurities whose resonance may partially overlap the dinuclear peak. Our method also corrects changes in the intensity of the signal arising from changes of the microwave cavity with temperature.
The results in Figures 5a-c do not display collapses of the MS = ±1 ↔ 0 resonances corresponding to dinuclear
units A and B for magnetic ield orientations near the magic angles, as observed by Napolitano et al.8 in the dinuclear
compound [Cu2(TzTs)4] having copper(II) ions in dinuclear
units. Since our experimental setup allows accurate measurements at angular intervals of 1°, the angular variation of the spectra in Figure 5 allows estimating a higher limit |J´| < 5×10⁻³ cm-1 for these interdinuclear
Discussion
The difference between the values of J0 obtained from the
temperature variation of the susceptibility (J0 = (–294 ± 5) cm-1)
and of the EPR line intensities (J0 = (–283 ± 5) cm-1) may
arise from the presence of traces of mononuclear centers contributing to the magnetic properties measuredby these two techniques at low T.2 However, these contributions
from the temperature variation of the EPR line intensities are much less important because the single crystal peaks corresponding to dinuclear units do not overlap the peaks due to mononuclear impurities at the studied ield orientations.6
This is clearly evidenced comparing Figures 3 and 7 below 70 K. Thus, even if the difference between the values is small, we attribute a better quality to the EPR result.
The main factors determining J0 are the crystal geometry
and the electronic structures of the Cu–O–C–O–Cu bridges. The unpaired electrons of the CuII ions interact through
the bridging ligands and the super exchange interaction is usually described by natural magnetic orbitals,2 that for the
Cu atoms in the cage structure are constructed from dx2-y2
copper orbitals with tails extending through the bridges. Changes of the geometry of the Cu–O–C–O–Cu bridges vary the overlap between Cu dx2-y2and O 2pxorbitals, which
in turn produce variations of J0.2 So, for “paddle wheel”
units described by [Cu2(µ-OOCR)4L2], the R groups are
most important in changing the electronic structure of the bridges, but the L groups may vary structural constraints, changing local symmetry and bond geometry at the dinuclear unit, producing geometrical differences between the structures of the four O–C–O bridges. Therefore, even if a value |J0| ca. 280-300 cm-1 is a good guess for all
tetracarboxylate “paddle wheel” copper(II) dinuclear units,2
explaining the small differences that may occur for different cases requires a detailed analysis of the symmetry and dimensions of the units, that may change from case to case. The zero field splitting of the excited triplet state of the dinuclear unit, characterized by the parameter D = (–0.334 ± 0.001) cm−1 = (–10.01 ± 0.03) GHz for
[Cu2(lu)4(dmf)2] arises from dipole-dipole interactions
between the two CuII spins at 2.619 Å and from anisotropic
components of the exchange coupling. A straightforward calculation in the point dipolar approximation25,26 gives
|Dpoint-dip| = –0.19 cm−1. However, considering the spatial
distribution of the unpaired electron (instead of the point charge approximation), this point charge value should be taken as a lower limit. This allows inferring a higher limit for the anisotropic exchange contribution,
|Danis. exch|. < 0.14 cm-1, (where Danis. exch should be negative).
Among the large quantity of CuII compounds involving
tetracarboxylate “paddle wheel” units reviewed by
Melník et al.,7 some of them involve dinuclear units
bridged by lu ligands.10 The parameter D evaluated for
[Cu2(lu)4(H2O)2]10 is nearly identical to that obtained
here for [Cu2(lu)4(dmf)2]. EPR studies of other copper
lufenamates10 of the [Cu
2(lu)4(L)2] type with several
L ligands display similar behavior. This is different for compounds of the [Cu2(lu)4(L1)(L2)] type, which display
distinct EPR spectra, and magnetic studies are needed for a complete characterization.
The hyperine coupling parameters of the CuII ions in
[Cu2(lu)4(dmf)2] given above (equation 7) are about half
the values observed for mononuclear CuII ions,11,27,28 as
expected for dinuclear units.
Considering the results in reference 8 we estimated an upper limit |J’| ≤ 5×10⁻³ cm-1 for the magnitude of the
exchange coupling between neighbor rotated dinuclear units types A and B in [Cu2(lu)4(dmf)2], considering the single
crystal spectra measured in the a*b and bc planes. They
correspond to interactions between CuII ions at ca. 14.24 Å,
transmitted through a long and complicate exchange path (Figure 1c) that involves 12 atoms in sigma bonds plus a weak electrostatic contact between a methyl group of a dmf molecule and the triluoromethylphenyl ring of a lu ligand in a neighbor rotated molecule separated by ca. 4.3 Å. This
value may be compared with 6×10⁻³ cm-1 between CuII ions
at ca. 15.7 Å connected by a path containing 9 σ-bonds plus 2 H-bonds,29 and with ca. 3×10⁻³ cm-1 between two
quinone radicals at 17.2 Å connected by a path containing 7 σ-bonds plus 2 H-bonds.30,31 Evaluating weak couplings
between well separated spins or polynuclear units is interesting from the point of view of molecular magnetism because they determine the magnetic isolation. They are also interesting because of being related to the matrix elements of electron transfer between unpaired electrons.30
Unfortunately, only an upper limit of this coupling can be obtained for [Cu2(lu)4(dmf)2].
Conclusions
We report detailed EPR and magnetic investigations of the compound [Cu2(lu)4(dmf)2] having CuII ions in
centrosymmetric dinuclear units with “paddle wheel” geometry. The exchange coupling J0 = (–283±4) cm-1
between copper ions in the dinuclear units, obtained from the temperature variation of the EPR intensities in an oriented single crystal, is more accurate than that obtained from the most common measurements of the T variation
of the susceptibility, where uncertainties introduced by mononuclear copper impurities cannot be avoided.
properties of spin clusters. They allow evaluating extremely weak exchange interactions, even in the presence of much stronger magnetic couplings.32
Acknowledgments
This work was supported by PRONEX/FAPESP/CNPq (grant 2003/09859-2) in Brazil and by CAI+D (UNL) in Argentina. L. M. B. N. was a PhD fellow from CAPES in Brazil. R. C. is a CONICET researcher.
References
1. Bleaney, B.; Bowers, K. D.; Proc. Roy. Soc. (London) A1952,
214, 451.
2. Kahn, O.; Molecular Magnetism, VCH: New York, 1993.
3. Guha, B. C.; Proc. Roy. Soc. (London) A 1951, 206, 353. 4. Allen, F. H.; Acta Crystallogr., Sect. B: Struct. Sci. 2002, 58,
380.
5. Clérac, R.; Cotton, F. A.; Dunbar, K. R.; Hillard, E. A.; Petruchina, M. A.; Smucker, B. W.; C. R. Acad. Sci. Paris, Chimie 2001, 4, 315.
6. Perec, M.; Baggio, R.; Sartoris, R. P.; Santana, R. C.; Peña, O.; Calvo, R.; Inorg. Chem. 2010, 49, 695.
7. Melník, M.; Kabešová, M.; Koman, M.; Macášková, L.; Garaj, J.; Holloway, C. E;. Valent, A.; J. Coord. Chem. 1998, 45, 147.
8. Napolitano, L. M. B.; Nascimento, O. R.; Cabaleiro, S.; Castro, J.; Calvo, R.; Phys. Rev. B: Condens. Matter Mater. Phys. 2008,
77, 214423.
9. Facchin, G.; Torre, M. H.; Kremer, E.; Piro, O. E.; Baran, E. J.;
Z. Anorg. Allg. Chem. 1998, 624, 2025.
10. Melník, M.; Macášková, L.; Mroziński, J.; Polyhedron 1988,
7, 1745; Melník, M.; Potočňak, I.; Macášková, L.; Holloway, C. E.; Mikloš, D., Polyhedron 1996, 15, 2159; Melník, M.;
Kohútová, M.; Acta Facult. Pharm. Univ. Comenianae 2009,
56, 10.
17. Atherton, N. M.; Principles of Electron Spin Resonance, Ellis Horwood and PTR Prentice Hall, Physical Chemistry Series: New York, 1993.
18. Weil, J. A.; Bolton, J. R.; Wertz, J. E.; Electron Paramagnetic Resonance:Elementary Theory and Practical Applications, Wiley: New York, 1994.
19. Bencini, A.; Gatteschi, D., Electron Paramagnetic Resonance of Exchange Coupled Systems, Springer-Verlag: Berlin, 1990.
20. Pilbrow, J. R.; Transition Ion Electron Paramagnetic Resonance, Clarendon Press: Oxford, England, 1990.
21. Calvo, R.; Rapp, R. E.; Chagas, E.; Sartoris, R. P.; Baggio, R.; Garland, M. T.; Perec, M.; Inorg. Chem. 2008,47, 10389.
22. Weil, J. A.; EPR Newsletter 2007, 17, 13. 23. Ozarowski, A.; Inorg. Chem. 2008, 47,9760.
24. Wasson, J. R.; Shyr, C.-I.; Trapp, C.; Inorg. Chem. 1968,7, 469. 25. Ozarowski, A.; Reinen, D.; Inorg. Chem. 1986, 25, 1704.
26. Schlam, R. F.; Perec, M.; Calvo, R.; Lezama, L.; Insausti, M.; Rojo, T.; Foxman, B. M.; Inorg. Chim. Acta 2000, 310,81.
27. Vieira, E. D.; Facchin, G.; Torre, M. H.; Costa-Filho, A. J.;
J. Braz. Chem. Soc.2008, 19, 1614.
28. Dalosto, S. D.; Ferreyra, M. G.; Calvo, R.; Piro, O. E.; Castellano, E. E.; J. Inorg. Biochem. 1999, 73, 151.
29. Santana, R. C.; Cunha, R. O.; Carvalho, J. F.; Vencato, I.; Calvo, R.; J. Inorg. Biochem. 2005,99, 415.
30. Calvo, R.; Abresch, E. C.; Bittl, R.; Feher, G.; Hofbauer, W.; Isaacson, R. A.; Lubitz, W.; Okamura, M. Y.; Paddock, M. L.;
J. Am. Chem. Soc. 2000, 122, 7327.
31. Calvo, R.; Isaacson, R. A.; Paddock, M. L.; Abresch, E. C.; Okamura, M. Y.; Maniero, A. L.; Brunel, L. C.; Feher, G.;
J. Phys. Chem. B 2001,105, 4053.
32. Calvo, R.; Appl. Magn. Reson.2007, 31, 271.
Submitted: June 8, 2010 Published online: December 9, 2010
![Figure 4. Experimental (solid lines) and simulated (dotted lines) spectra (dχ”/dB 0 ) of single-crystal samples of [Cu 2 (lu) 4 (dmf) 2 ] at Q-band and 300 K](https://thumb-eu.123doks.com/thumbv2/123dok_br/18995491.462068/4.892.70.410.599.890/figure-experimental-simulated-dotted-spectra-single-crystal-samples.webp)