Article
J. Braz. Chem. Soc., Vol. 22, No. 4, 648-651, 2011. Printed in Brazil - ©2011 Sociedade Brasileira de Química 0103 - 5053 $6.00+0.00
A
*e-mail: [email protected]
Determination of
p
-Phenylenediamine by Perturbation of a Non-Equilibrium
Stationary State in the B-Z Reaction
Jinzhang Gao,* Xiaodong Chen, Jie Ren and Wu Yang
College of Chemistry & Chemical Engineering, Northwest Normal University, Lanzhou 730070, P.R.China
Foi proposto um procedimento para a determinação de para-fenilenodiamina (PPD) em águas residuais, baseada na perturbação de uma reação oscilante em uma situação fora do equilíbrio, próximo a uma bifurcação pela reação Belousov-Zhabotinskii (B-Z), uma vez que este ponto encontra-se muito sensível à perturbação pela mudança de vizinhança. Os resultados indicam que a variação de potencial (∆E) é linearmente proporcional ao antilogarítmo da concentração de PPD, (−logC), no intervalo de concentração correspondente a 4,68 × 10⁻⁷ - 1,95
× 10−5 mol L−1 (r = 0,9981) e com limite de determinação (LOD) de 9,50 × 10⁻⁸ mol L−1. Uma boa recuperação do analito foi obtida, em um intervalo de aproximadamente 95,1 a 102,3%.
A convenient method for determination of p-phenylenediamine (PPD) in wastewater has proposed, based on the perturbation of a non-equilibrium stationary state near a bifurcation for the Belousov-Zhabotinskii (B-Z) reaction, due to this point being very sensitive to the surrounding change. Results indicate that the change of the potential (∆E) is linearly proportional to the negative logarithm concentration of PPD (−logC) in the range of 4.68 × 10⁻⁷ - 1.95
× 10−5 mol L−1 (r = 0.9981) with a limit of detection (LOD) of 9.50 × 10⁻⁸ mol L−1. A good recovery was obtained at ca. 95.1 to 102.3%.
Keywords: non-equilibrium stationary state, Belousov-Zhabotinskii reaction,
p-phenylenediamine determination
Introduction
Chemical reaction systems, which were far-from-equilibrium, could exhibit various dynamic regimes such
as regular and irregular oscillations, chaos and so on.1 Some
of them have been widely used in analytical chemistry,2,3
commonly based on the perturbation of a stationary oscillating system by analyte. The change of amplitude and/or period in regular oscillating system is proportional to the amounts
of analyte added, in the range from 10−7 to 10−4 mol L−1
with a lower detection limit (ca. 10−6 - 10−8 mol L−1).In
general, it maysatisfy the need of common determinations.
To improve the sensitivity of B-Z oscillating reaction,
Perez-Bendito’s group4,5 and Strizhak’s group6,7 investigated
theoretically the largest Lyapunov exponent in the transient chaotic regime with the B-Z oscillating system and developed a new analytical method with very high sensitivity (limit of detection, LOD ≤ 10−12 mol L−1). Gao et al.8 reported that
a modiied B-Z oscillating chemical system with sulide is
very sensitive to trace amounts of some metal ions. All of these facts demonstrated again that the oscillating chemical reaction as a novel analytical technique has been made a long progress, and applied successfully to the determination of trace amounts of organic and inorganic substances.
Recently, Pejićet al.9,10 studied the characteristics of a
non-equilibrium stationary state close to the bifurcation point and proposed successfully a novel kinetic method for the determination of organic compounds and inorganic ions. In fact, the vicinity of a bifurcation point of non-equilibrium system gestates a luctuation, which is very sensitive to the surrounding change. For this reason, it can be used in analytical chemistry. To assess the validity in the present
paper we consider p-phenylenediamine (PPD) as analyte
and compare with other analytical techniques such as
capillary zone electrophoresis,11 spectrophotometric,12 and
heat-gradient analytical technique.13
p-Phenylenediamine is one of main components in the
Gao et al. 649 Vol. 22, No. 4, 2011
chemistry. The sequel of large amounts of its use will be pollution of the surrounding such as water and soil. Thus, we proposed a more convenient and rapid method
to determine p-phenylenediamine. Results showed that
the proposed method could meet the need of many ields. Moreover, in contrast to other instrumental analysis, the proposed method has many beneits, such as simple set-up with ease of operation and low cost, broader linear range and lower limit of detection and so on.
Experimental
Reagents
All chemicals used were of analytical-reagent grade and doubly distilled water was used throughout. Stock solutions were prepared with doubly distilled water and standardized prior to use. Solutions with lower concentration of PPD were prepared and stored in the black polyethylene bottle.
Apparatus
The set-up used to implement the determination of PPD consisted of a glass vessel with 50 mL capacity wrapped in a water recirculation jacket. A Model 501 thermostat (Shanghai Experimental Instrumental Factory, China) with
an accuracy ± 0.1°C and a Model ML-902 magnetic stirrer
(Shanghai Pujiang Analytical Instrumental Factory, China) were used to maintain the temperature of the reaction solution. Reactants were added to the CSTR and products were lead away from it by using a Model DDB-600 six-channel peristaltic pump (Zhejiang Xiaoshang Haitian Instrumental Factory, China). A CHI-832 electrochemical analytical instrument (Shanghai Chenhua Instrument Company, China) was used to record the changes in potential, which were monitored by using two Pt-electrodes (Rex, 213, China) as the working electrode and auxiliary electrode separately, and an Ag/AgCl/KCl electrode (Rex, 217, China) as the reference electrode. A microinjector was used for introducing sample solution.
Procedure
The experiments were performed in a 50 mL CSTR
thermostatted at 303 ± 0.1 K. The reactants were supplied
to the reactor by using the following concentrations:
[KBrO3]o = 0.14 mol L−1, [MA]
o = 0.30 mol L−
1,
[H2SO4]o = 0.20 mol L−1, [Fe(phen) 3]o
2+= 1.25 mmol L−1,
keeping the total volume of 25.20 mL. Then the electrodes were immersed in the solution and the mixture was
homogenized by continuous magnetic stirring with a rate of 800 rpm, and the time-potential curve was recorded immediately. Perturbations were performed by adding a volume of 0.2 mL of the sample solution with a microinjector.
Results and Discussion
Procedure of inding the bifurcation
Theoretically, changing any dynamic parameters, such
as temperature, speciic low rate (jo), the concentration
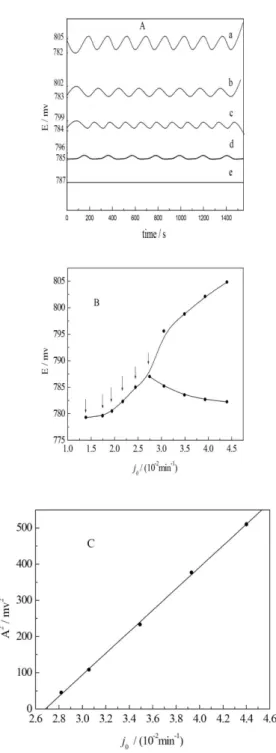
of reactants, could make the oscillating proile both in amplitude and period from oscillatory to non-oscillatory phase. In this paper, we considered the speciic low rate as a control parameter to ind the bifurcation in the range
of 0.0125 - 0.0450 min−1. The speciic low rate j
o is a
parameter in the CSTR being equal to the overall volume low rate divided by the volume of the reaction mixture
with a unit of (time)−1. By introducing this parameter, the
low rates of all species can be described as irst order
reactions.14 By decreasing the value of j
o, the amplitude
of system decreased gradually and eventually disappeared
at jo = 0.0275 min−1 (see Figure 1A). In other words, the
system approaches to a critical value of a dynamic regime and over this point a bifurcation phenomenon would be observed. Based on the data shown in Figure 1A, a plot
of potentials (both maximum and minimum) versus the jo
was made as shown in Figure 2B. It is easy to understand that for a regular oscillating proile there are two potential
points (i.e.,the highest and the lowest values); for a
non-oscillating straight-line only one point can be acquired, meaning that the bifurcation point should be limited the
range from 0.0125 to 0.0450 min−1. In fact, a theoretical
bifurcation point (jo = 0.0268 min−1) was obtained only by
linear extrapolation rather than experimental observation
(jo= 0.0275 min−1). Figure 1C shows an example, i.e., how
to ind the value of jo = 0.0268 min−1 by linear extrapolation.
That is, a plot of the square of amplitude of the limit cycle
oscillations versus jo.This is why the bifurcation point
must be determined experimentally several times (see the arrows in Figure 1B).
Determination of PPD
As the matrix reaction system was suitable for the quantitative determination of PPD, the B-Z oscillatory
system catalyzed by [Fe(phen)3]2+ was chosen. That is,
Determination of p-Phenylenediamine by Perturbation of a Non-Equilibrium Stationary State J. Braz. Chem. Soc. 650
of analytes may perturb extremely fragile balance and induce detectable changes in the dynamic pattern. When the PPD was injected into the system, the potential of system was impacted (see Figure 2). The change in the
potential difference (∆E) was linearly proportional to the
negative logarithm concentration of PPD (−logC) over
the range 4.68 ×10⁻⁷-1.95
× 10−5 mol L−1, with a LOD
9.50 × 10⁻⁸ mol L−1, as shown in Figure 3. The linear
relationship can be expressed by the following regression equation 1:
∆Em(mV) = 311.85 − 47.92 (−log C)
( r = 0.9981, RSD = ± 2.35%) (1)
Interferences
As we know that the non-equilibrium stationary state is highly vulnerable to the foreign species. For determining PPD, some of common inorganic ions and organic compounds were investigated. The tolerance level was deined as the maximum amount of foreign
species causing an error, being limited less than ±5%
Figure 1. A: Time series showing stable dynamic structures observed in the B-Z reaction at different jo,a: 0.0440 min−1, b: 0.0393 min−1,
c: 0.0349 min−1, d: 0.0306 min−1, e: 0.0275 min−1. Common condition:
[KBrO3]o = 0.14 mol L−1, [MA]
o = 0.30 mol L
−1, [H
2SO4]o = 0.20 mol L
−1,
[Fe(phen)3]o2+= 1.25 mmol L−1, T = 303 ± 0.1 K; B: Bifurcation diagram
for jo as control parameter. The points, jo= 0.0139, 0.0175, 0.0194, 0.0217, 0.0245 and 0.0275 min−1are indicated by arrows; C: Plot of the square
of oscillation amplitudes as a function of jo. The bifurcation point was determined from the intercept on the abscissa.
Figure 2. Typical potentiometric responses of the B-Z matrix, obtained after perturbing by PPD. a: [PPD] = 2.57 ×10⁻⁶ mol L−1;
b: [PPD] = 9.77 × 10⁻⁶ mol L−1; c: [PPD] = 4.79 × 10⁻⁵ mol L−1. Arrows
indicate the moments at which stationary states were perturbed.
Figure 3. Calibration curve for the ∆E vs.the negative logarithm concentration of PPD (−logC) over the range of 4.68 × 10⁻⁷ - 1.95 × 10⁻⁵ mol L−1
Gao et al. 651 Vol. 22, No. 4, 2011
(RSD) for determining the PPD of 2.90 × 10⁻⁵ mol L−1,
as listed in Table 1.
Generally, commonly inorganic ions and organic compounds with small molecular weight have little inluence on the determination. Tolerated ratio (foreign/ PPD) for anilin (its structure similar to PPD), as well as phenol and formaldehyde were found to be less than 10.
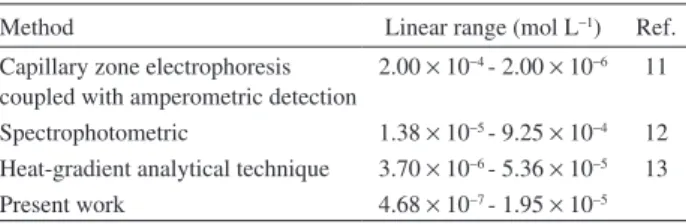
Comparison with other methods
In order to ensure the sensitivity response of the proposed method, PPD determination was compared with other techniques and results were listed in Table 2.
Sample analysis
Six artificial wastewater samples containing PPD were determined for testing the proposed method, and satisfactory results were obtained (Table 3).
Table 3. Results and recovery for determining PPD in water samples, (n = 6)
Sample No. Original (mg L−1)
Added (mg L−1)
Found (mg L−1)
Recovery (%)
1 0.566 0.500 1.09 102.3
2 0.562 0.500 1.01 95.1
3 0.557 0.500 1.05 99.3
4 1.035 1.00 2.04 100.2
5 1.029 1.00 2.02 99.6
6 1.026 1.00 2.06 101.7
Table 2. Compared the proposed method with others used for determining PPD
Method Linear range (mol L−1) Ref.
Capillary zone electrophoresis coupled with amperometric detection
2.00 × 10⁻⁴ - 2.00 × 10⁻⁶ 11
Spectrophotometric 1.38 × 10⁻⁵ - 9.25 × 10⁻⁴ 12
Heat-gradient analytical technique 3.70 × 10⁻⁶ - 5.36 × 10⁻⁵ 13
Present work 4.68 × 10⁻⁷ - 1.95 × 10⁻⁵
Table 1. Effect of foreign species on the determination of [PPD] = 2.90 × 10⁻⁵ mol L−1
Foreign species Tolerated ratio
(foreign/PPD)
K+, Na+, Ca2+, Mg2+, Ba2+, Al3+, Cl− 1000 CO32−, SO
4 2−, NO
3
−, PO
4
3− 500
Co2+, Ni2+, methanol, toluene 100
Pb2+, Cd2+ 20
Anilin, phenol, formaldehyde 10
Conclusion
Although some methods for determining PPD have been used widely, the proposed technique has its advantages, such a broader linear range and lower LOD, convenient operation and low cost set-up. Relative to other instrumental analysis, the proposed technique could be adopted easily in the routine analysis.
Acknowledgements
This work was supported in part by the National Natural Science Foundation (20873101), the Project of International Cooperation between China and Ukraine (043-05), and the Project of KJCXGC-01 of Northwest Normal University, China.
References
1. Taylor, A. F.; Prog. React. Kinet. Mech. 2002, 27, 247. 2. Jimenez-Prieto, R.; Silva, M.; Perez-Bendito, D.; Analyst1998,
123, 1R.
3. Gao, J. Z.; Pak. J. Biol. Sci. 2005, 8, 512.
4. Jimenez-Prieto, R.; Silva, M.; Perez-Bendito, D.; Analyst 1996, 121, 563.
5. Jimenez-Prieto, R.; Silva, M.; Perez-Bendito, D.; Analyst1997, 122, 287.
6. Didenko, O. Z.; Strizhak, P. E.; Chem. Phys. Lett.2001, 340, 5. 7. Strizhak, P. E.; Didenko, O. Z.; Ivashchenko, T. S.; Anal. Chim.
Acta 2001, 428, 15.
8. Gao, J. Z.; Chen, H.; Dai, H. X.; Lv, D. Y.; Ren, J.; Wang, L.; Yang, W.; Anal. Chim. Acta2006, 571,150.
9. Pejić, N. D.; Kolar-Anić, L. Z.; Anić, S. R.; Stanisavljev, D. R.; J. Pharma. Biomed. Anal.2006, 41, 610.
10. Pejić, N. D.; Blagojević, S. M.; Anić, S. R.; Vukojević, V. B.; Mijatović, M. D.; Ćirić, J. S.; Marković, Z. S.; Marković, S. D.; Kolar-Anić, L. Z.; Anal. Chim. Acta2007, 582, 367. 11. Dong, S. Q.; Chi, L. Z.; Zhang, S.; He, P. G.; Wang, Q. J.; Fang,
Y. Z.; Anal. Bioanal. Chem. 2008,391, 653.
12. Isaev, R. N.; Ishkov, A. V.; Anal. Chem.2002, 57, 794. 13. Janghel, E. K.; Rai, J. K.; Rai, M. K.; Gupta, V. K.; J. Anal.
Chem.2008, 63, 157.
14. Vukojević, V. B.; Pejić, N. D.; Stanisavljev, D. R.; Analyst1999, 124, 147.
Submitted: June 9, 2010