Article
J. Braz. Chem. Soc., Vol. 22, No. 4, 637-642, 2011. Printed in Brazil - ©2011 Sociedade Brasileira de Química
0103 - 5053 $6.00+0.00
A
*e-mail: [email protected]
2D Chemical Drawings Correlate to Bioactivities: MIA-QSAR Modelling of
Antimalarial Activities of 2,5-Diaminobenzophenone Derivatives
Rodrigo A. Cormanich,a Matheus P. Freitas*,b and Roberto Rittnera
aChemistry Institute, University of Campinas, PO Box 6154, 13083-970 Campinas-SP, Brazil
bChemistry Department, Federal University of Lavras, PO Box 3037, 37200-000 Lavras-MG, Brazil
Estruturas químicas bidimensionais de uma série de derivados da 2,5-diaminobenzofenona, alguns inibidores de farnesiltransferase, correlacionam-se com as respectivas atividades antimaláricas. Os descritores nessa análise QSAR são pixels das estruturas químicas (imagens bidimensionais) transformados em binários e, portanto, a variação dos dados que explica a variância no bloco das bioatividades corresponde às coordenadas de cada pixel do desenho das moléculas. Este método, chamado análise multivariada de imagens aplicada ao estudo da relação quantitativa entre estrutura e atividade (MIA-QSAR), foi aplicado para modelar as atividades antimaláricas dos compostos acima e os resultados foram comparados com técnicas de QSAR 3D bastante conhecidas. Além da simplicidade e alto poder de predição do modelo MIA-QSAR, este método baseado em imagens 2D tem potencial para funcionar bem quando análises clássicas igualmente simples falham. Enim, a presente análise QSAR baseada em desenhos de estruturas químicas bidimensionais dispensa uma varredura conformacional e alinhamento tridimensional das moléculas para fornecer um modelo QSAR robusto; a descrição físico-química de efeitos estéricos e centros estereogênicos, por exemplo, está toda incorporada na maneira com que substituintes são representados, e o método serve como uma ferramenta para aqueles que interessem em trabalhar com modelagem de fármacos.
Two-dimensional chemical structures of a series of 2,5-diaminobenzophenone derivatives, some farnesyltransferase inhibitors, have shown to correlate with the corresponding antimalarial activities. The descriptors in this QSAR analysis are pixels of the chemical structures (two dimensional images) transformed into binaries and, therefore, the data variance explaining the variance in the activities block corresponds to the coordinates of each pixel in each molecule. This method, named multivariate image analysis applied to quantitative structure-activity relationship (MIA-QSAR), was applied to model the antimalarial activities of the titled compounds and the results were compared to well known three-dimensional QSAR techniques for the same class of compounds. In addition to the simplicity and high predictive performance of the MIA-QSAR modelling, this 2D image-based method has the potential of working well when equally simple, classical analysis fails. Overall, the present QSAR analysis based on 2D chemical drawings (constrained structures) dispensed conformational screening and 3D alignment to provide a reliable QSAR model; the physicochemical description about e.g. steric effects and chiral centers is all contained in the way in which substituents in a congeneric series are drawn, and the method can serve as a tool to introduce those who are planning to deal with drug design.
Keywords: QSAR, image analysis, bidimensional chemical structures, 2,5-diaminobenzophenones, antimalarial compounds
Introduction
Malaria is a leading cause of morbidity and mortality worldwide, affecting primarily poor populations,
2D Chemical Drawings Correlate to Bioactivities: MIA-QSAR Modelling of Antimalarial Activities J. Braz. Chem. Soc. 638
every year.1-5 Among the protozoan parasites that cause malaria, Plasmodium falciparum causes the most severe form, being the most virulent and lethal one, killing more than 1 million children in Africa each year.5,6 As a way of prophylaxis of this protozoa genus, a novel class of antimalarial compounds, derived from farnesyltransferase inhibitors, based on a 2,5-diaminobenzophenone scafold, was recently developed, showing to be active against the multi-drug resistant Plasmodium falciparum strain Dd2.7-13 Accordingly, the bioactivities of a series of 2,5-diaminobenzophenone, have been modelled through 3D-QSAR analyses, which displayed a considerable correlation between structural information and the inhibitory activity.14
Highly predictive 3D-QSAR models have been developed, with the CoMFA15 (comparative molecular ield analysis) and CoMSIA16 (comparative molecular similarity indices) being the most widespread and recognized ones.17 However, the exhaustive alignment and the necessity to know the main conformation of the 3D ligands required by these models, incite the research to ind alternative QSAR methods that can generate reliable descriptors. On this way, simpler approaches, such as topological sub-structural molecular design (TOPS-MODE),18 molecular electronegativity-interaction vector (MEIV)19 and atom-pair hologram (APH),20 which have comparable prediction power to 3D-QSAR methods, have been developed. Among these recently implemented methods, multivariate image analysis applied to quantitative structure-activity relationships (MIA-QSAR) has provided reliable and rapid analysis, without the need for conformational screening and 3D alignment, being a promising approximation to discover new drugs.21-28
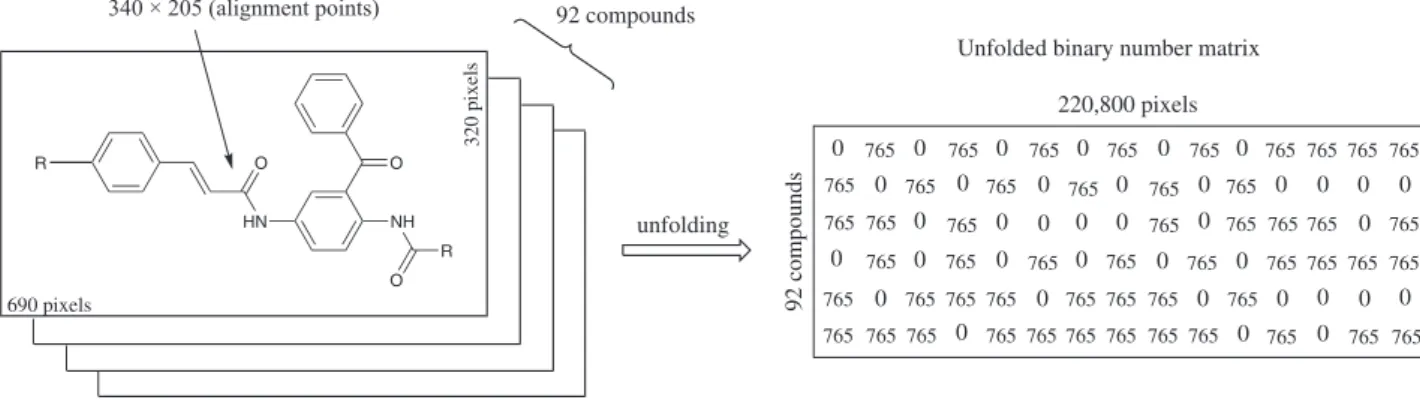
MIA-QSAR method is based on the treatment of images (2D chemical structures), where the representative variables - the descriptors - are pixels (binaries) loaded from such images. The simple alignment of these structures, resulting in a three-way array by superposition of congruent substructures of the 2D images, makes MIA-QSAR easy to operate and requires low investment. In a second step, the three-way array can be unfolded to give a two-way array (matrix), where rows represent the compounds and columns the variables, suitable to apply a convenient regression method, usually partial last squares (PLS) regression,29 to correlate the descriptors with the Y-block (the dependent variables column vector).
Thus, the MIA-QSAR method was applied to a series of 2,5-diaminobenzophenone derivatives in this work, using PLS as the regression method, to search for its predictive ability when compared to CoMFA and CoMSIA results obtained from the literature.14
Computational Method
MIA structures are 2D images that can be drawn with the help of some chemical structure drawing software. Accordingly, the 92 molecules that constitute the data set were modelled using the ChemSketch program,30 which showed to be the most promising software to model structures to MIA-QSAR method in a previous work.31 Afterwards, each structure was transformed into bitmaps in a 690 × 320 pixels workspace using the Paint applicative of Windows (resolution of 87 × 87 dots per inch) and aligned by a point (pixel) in common to all structures, in order to make the substituents the only portion that has variance (since the congruent moiety to all structures has no data variance in a congeneric series), and hence, explains the differences observed in the predicted pIC50. The images built in this way were read using the Matlab 7.5 software,32 and then loaded using this program as binary matrices. Matlab program automatically represents each white pixel in these matrices as a 765 digit and each black pixel as a 0 digit (according to the RGB composition), and so the images (2D plots) were grouped and unfolded to a two-way array matrix of 92 × 220,800 dimension (Figure 1). In order to minimize the memory and computational cost, the dimension of the X-matrix was reduced to 92 × 6,879 by deletion of the variables with zero variance and the compounds were split into a training set (74 × 6,879) and a prediction set (18 × 6,879) in accordance with reference 14, that were inally submitted to PLS analysis, which was carried out using the PLS-Toolbox;33 a latent variable-based model is indispensible in this case to reduce the data dimensionality. Several statistical parameters were used to measure the conidence degree of the model; the itting ability was evaluated by inspection of r2 from the calibration, and the corresponding regression parameters were used to predict the activities of an external validation set, as suggested elsewhere.34 In addition, q2 from the leave-one-out cross-validation (LOO CV), the root-mean-square-error of cross-validation (RMSECV) and prediction (RMSEP), and a Y-randomization test were determined to reinforce the prediction capability of the model.
Results and Discussion
Cormanich et al. 639 Vol. 22, No. 4, 2011
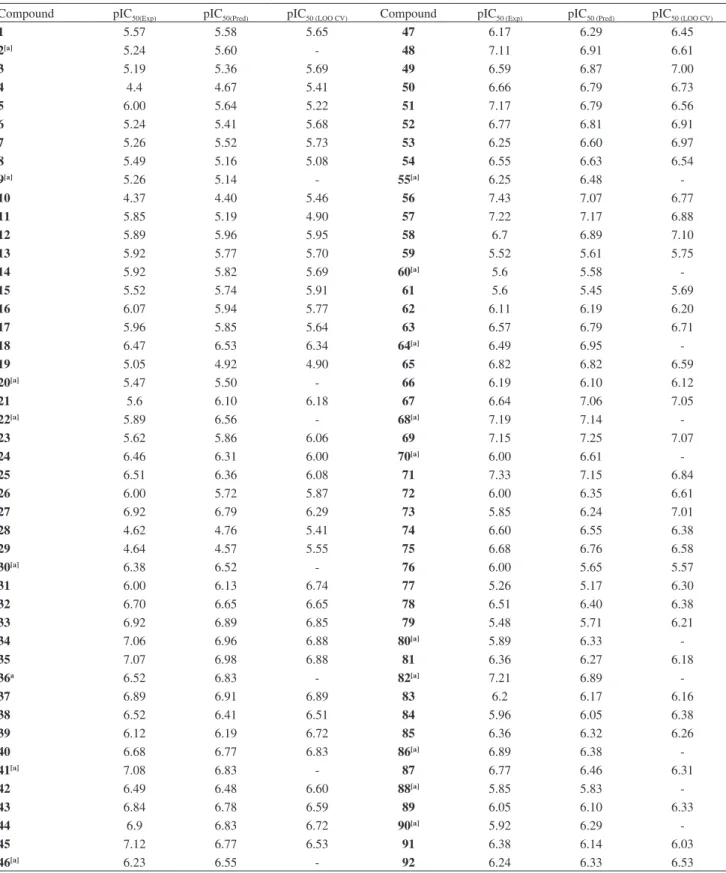
set, in order to obtain the number of latent variables that will be used in the PLS regression. The minor value of RMSECV (0.445) was achieved at 7 latent variables (Figure 2), which gave an excellent correlation in calibration between the experimental and the itted pIC50 values by bilinear PLS regression method (r2 = 0.91), Table 1, and hence, low residuals between them. Also, the model was validated through LOO CV, i.e. 74 models were built using the training set, where one random compound was omitted at a time and its pIC50 value predicted using the model developed with the 73 remaining compounds; the q2 obtained of 0.56 was comparable to those available in the literature using CoMFA and CoMSIA analysis.14
Golbraikh and Tropsha34 state that the only way to achieve a reliable QSAR model is by means of an external validation. Therefore, the calibration parameters were used to predict the bioactivities of 18 prediction set compounds, giving a high correlation (r2
test = 0.73) and attesting the satisfactory predictive power of the MIA-QSAR model (Figure 3). Additionally, a Y-randomization test, in which the Y-block was shufled while the X-matrix was kept unaltered, was performed to guarantee that the good calibration result was not due to chance correlation; also,
the Y-randomization test can provide an estimative of the signiicance of the q2 value obtained in the LOO CV, once this robustness test consists in building several models which randomly permute the pIC50 values among the compounds in study. One hundred models were built in this way, giving a very low mean r2
Y-randomization of 0.02 ± 0.04, conirming that the real calibration was not fortuitous. Additionally, q2
Y-randomization was calculated according to procedure described in the literature,35 and a negative value (mean of 100 repetitions) of −0.66 ± 0.61 was obtained, reinforcing the model′s reliability and that there was no chance correlation.
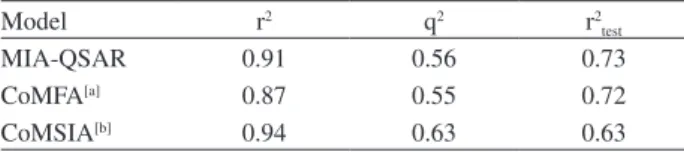
The results were summarized and compared to the best CoMFA and CoMSIA models obtained by Xie et al.14 in Table 2. These results suggest the MIA-QSAR method as a useful tool, as promising as the most reined widely applied 3D methodologies, to correlate real pIC50 with pIC50 provided by descriptors from modelled structures for this series of antimalarial compounds. Also, Figure 1. Representative example of the procedure to obtain the X-matrix used in MIA-QSAR.
Figure 2. Plot of RMSEC and RMSECV vs. number of latent variables.
2D Chemical Drawings Correlate to Bioactivities: MIA-QSAR Modelling of Antimalarial Activities J. Braz. Chem. Soc. 640
this comparative table makes clear that MIA is at least as predictive as these 3D reined methodologies, being, therefore, a much less expensive alternative to propose new
2,5-diaminobenzophenone derivatives, since MIA-QSAR showed a r2
test – the most important suggested evaluator parameter to measure the prediction ability of a model34 – Table 1. Experimental, predicted and cross-validated (LOO) pIC50 values for the series of 2,5-diaminobenzophenone derivatives composing the data set
Compound pIC50(Exp) pIC50(Pred) pIC50 (LOO CV) Compound pIC50 (Exp) pIC50 (Pred) pIC50 (LOO CV)
1 5.57 5.58 5.65 47 6.17 6.29 6.45
2[a] 5.24 5.60 - 48 7.11 6.91 6.61
3 5.19 5.36 5.69 49 6.59 6.87 7.00
4 4.4 4.67 5.41 50 6.66 6.79 6.73
5 6.00 5.64 5.22 51 7.17 6.79 6.56
6 5.24 5.41 5.68 52 6.77 6.81 6.91
7 5.26 5.52 5.73 53 6.25 6.60 6.97
8 5.49 5.16 5.08 54 6.55 6.63 6.54
9[a] 5.26 5.14 - 55[a] 6.25 6.48
-10 4.37 4.40 5.46 56 7.43 7.07 6.77
11 5.85 5.19 4.90 57 7.22 7.17 6.88
12 5.89 5.96 5.95 58 6.7 6.89 7.10
13 5.92 5.77 5.70 59 5.52 5.61 5.75
14 5.92 5.82 5.69 60[a] 5.6 5.58
-15 5.52 5.74 5.91 61 5.6 5.45 5.69
16 6.07 5.94 5.77 62 6.11 6.19 6.20
17 5.96 5.85 5.64 63 6.57 6.79 6.71
18 6.47 6.53 6.34 64[a] 6.49 6.95
-19 5.05 4.92 4.90 65 6.82 6.82 6.59
20[a] 5.47 5.50 - 66 6.19 6.10 6.12
21 5.6 6.10 6.18 67 6.64 7.06 7.05
22[a] 5.89 6.56 - 68[a] 7.19 7.14
-23 5.62 5.86 6.06 69 7.15 7.25 7.07
24 6.46 6.31 6.00 70[a] 6.00 6.61
-25 6.51 6.36 6.08 71 7.33 7.15 6.84
26 6.00 5.72 5.87 72 6.00 6.35 6.61
27 6.92 6.79 6.29 73 5.85 6.24 7.01
28 4.62 4.76 5.41 74 6.60 6.55 6.38
29 4.64 4.57 5.55 75 6.68 6.76 6.58
30[a] 6.38 6.52 - 76 6.00 5.65 5.57
31 6.00 6.13 6.74 77 5.26 5.17 6.30
32 6.70 6.65 6.65 78 6.51 6.40 6.38
33 6.92 6.89 6.85 79 5.48 5.71 6.21
34 7.06 6.96 6.88 80[a] 5.89 6.33
-35 7.07 6.98 6.88 81 6.36 6.27 6.18
36a 6.52 6.83 - 82[a] 7.21 6.89
-37 6.89 6.91 6.89 83 6.2 6.17 6.16
38 6.52 6.41 6.51 84 5.96 6.05 6.38
39 6.12 6.19 6.72 85 6.36 6.32 6.26
40 6.68 6.77 6.83 86[a] 6.89 6.38
-41[a] 7.08 6.83 - 87 6.77 6.46 6.31
42 6.49 6.48 6.60 88[a] 5.85 5.83
-43 6.84 6.78 6.59 89 6.05 6.10 6.33
44 6.9 6.83 6.72 90[a] 5.92 6.29
-45 7.12 6.77 6.53 91 6.38 6.14 6.03
46[a] 6.23 6.55 - 92 6.24 6.33 6.53
Cormanich et al. 641 Vol. 22, No. 4, 2011
superior to all models available in the literature for this series of compounds,14 constructed by means of CoMFA and CoMSIA.
Conclusions
MIA-QSAR modelling, a simple 2D image-based method, has shown to be a useful tool to predict activities of new congeneric 2,5-diaminobenzophenone derivatives, providing rapid and reliable analysis, whose results compare well to widespread used 3D-QSAR methods. Its limitation lies on the fact that MIA-QSAR is not able to give information about which chemical property (hydrophobicity, polarity, etc.) is responsible for positive or negative effect on the bioactivity in a 3D space; obviously, this is not possible because MIA-QSAR is not a 3D-based method. Nevertheless, MIA-QSAR methodology can serve as a tool to introduce those who are planning to deal with drug design, e.g. by predicting the bioactivities of new drug candidates, which are combinations of substructures of the most active compounds of a training set. Furthermore, this work is a relection about the necessity of considering tridimensional structures to obtain predictive, reliable QSAR models; for example, a remaining question is: would the use of non-optimized, planar chemical structures bring worse modelling results than the ones usually obtained by means of e.g. CoMFA? The fact is that MIA-QSAR has proved that 2D chemical structures allow good correlation with bioactivities or other physicochemical parameters. Moreover, the MIA-QSAR method provides chemical information, since depending on the way in which substituent groups are drawn, they can encode steric effects (groups containing pixels occupying a large area in the workspace), stereogenic centers (hashed or wedged lines representing back or front bond relative to a chiral carbon), etc.
Supplementary Information
Supplementary data are available free of charge at http://jbcs.sbq.org.br, as PDF ile.
Acknowledgments
The authors are grateful to FAPESP and FAPEMIG for the inancial support of this work and to CNPq and FAPESP for the fellowship (to M.P.F. and R.R.) and studentship (to R.A.C.).
References
1. World Health Organization, World Malaria Report, 2009. 2. LaCount, D. J.; Vignali, M.; Chettier, R.; Phansalkar, A.; Bell,
R.; Hesselberth, J. R.; Schoenfeld, L. W.; Ota, I.; Sahasrabudhe, S.; Kurschner, C.; Fields, S.; Hughes, R. E.; Nature 2005, 438, 103.
3. Snow, R. W.; Guerra, C. A.; Noor, A. M.; Myint, H. Y.; Hay, S. I.; Nature2005, 434, 214.
4. Bell, D. R.; Jorgensen, P.; Christophel, E. M.; Palmer, K. L.; Nature2005, 437, E3.
5. Kwiatkowski, D. P.; Am. J. Hum. Genet.2005, 77, 171. 6. Wiesner, J.; Ortmann, R.; Jomaa, H.; Schlitzer, M.; Ang. Chem.,
Int. Ed.2003, 42, 5274.
7. Wiesner, J.; Wissner, P.; Dahse, H.-M.; Jomaa, H.; Schlitzer, M.; Bioorg. Med. Chem. 2001, 9, 785.
8. Wiesner, J.; Mitsch, A.; Wissner, P.; Jomaa, H.; Schlitzer, M.; Bioorg. Med. Chem. Lett.2001, 11, 423.
9. Wiesner, J.; Kettler, K.; Jomaa, H.; Schlitzer, M.; Bioorg. Med. Chem. Lett.2002, 12, 543.
10. Wiesner, J.; Mitsch, A.; Wisner, P.; Kramer, O.; Jomaa, H.; Schlitzer, M.; Bioorg. Med. Chem. Lett.2002, 12, 2681. 11. Wiesner, J.; Kettler, K.; Sakowski, J.; Ortmann, R.; Jomaa, H.;
Schlitzer, M.; Bioorg. Med. Chem. Lett.2003, 13, 361. 12. Wiesner, J.; Fucik, K.; Kettler, K.; Sakowski, J.; Ortmann, R.;
Jomaa, H.; Schlitzer, M.; Bioorg. Med. Chem. Lett.2003, 13, 1539.
13. Wiesner, J.; Mitsch, A.; Jomaa, H.; Schlitzer, M.; Bioorg. Med. Chem. Lett.2003, 13, 2159.
14. Xie, A.; Sivaprakasam, P.; Doerksen, R. J.; Bioorg. Med. Chem. 2006, 14, 7311.
15. Cramer, R. D.; Patterson, D. E.; Bunce, J. D. J.; J. Am. Chem. Soc.1988, 110, 5959.
16. Klebe, G.; Abraham, U.; Mietzner, T.; J.Med. Chem.1994, 37, 4130.
17. Bohm, M.; Sturzebecher, J.; Klebe, G.; J. Med. Chem.1999, 42, 458.
18. González, M. P.; Terán, C.; Bioorg. Med. Chem. Lett.2004, 14, 3077.
19. Kier, L. B.; Hall, L. H.; Pharm. Res.1990, 7, 801. 20. Tian, F.; Zhou, P.; Li, Z.; J. Mol. Struct.2007, 871, 140. 21. Freitas, M. P.; Brown, S. D.; Martins, J. A.; J. Mol. Struct.2005,
738, 151.
22. Freitas, M. P.; Med. Chem. Res.2007, 16, 461.
Table 2. Comparative statistical parameters obtained by MIA-QSAR, CoMFA and CoMSIA models
Model r2 q2 r2
test
MIA-QSAR 0.91 0.56 0.73
CoMFA[a] 0.87 0.55 0.72
CoMSIA[b] 0.94 0.63 0.63
2D Chemical Drawings Correlate to Bioactivities: MIA-QSAR Modelling of Antimalarial Activities J. Braz. Chem. Soc. 642
23. Freitas, M. P.; Chemom. Intell. Lab. Syst.2008, 91, 173. 24. Cormanich, R. A.; Goodarzi, M.; Freitas, M. P.; Chem. Biol.
Drug. Des.2009, 73, 244.
25. Antunes, J. E.; Freitas, M. P.; da Cunha, E. F. F.; Ramalho, T. C.; Rittner, R.; Bioorg. Med. Chem.2008, 16, 7599.
26. Goodarzi, M.; Freitas, M. P.; Ghasemi, N.; Eur. J. Med. Chem. 2010, 45, 3911.
27. Goodarzi, M.; Freitas, M. P.; Eur. J. Med. Chem.2010, 45, 1352. 28. Pinheiro, J. R.; Bitencourt, M.; da Cunha, E. F. F., Ramalho, T.
C.; Freitas, M. P.; Bioorg. Med. Chem.2008, 16, 1683. 29. Bro, R.; J. Chemom.1996, 10, 47.
30. ACD/ChemSketch Version 8.17, Advanced Chemistry Development, Inc., Toronto, Canada, 2005.
31. Freitas, M. P.; Org. Biomol. Chem.2006, 4, 1154. 32. MatLab, Version 7.5, MathWorks, Inc.,Natick, MA, 2005. 33. Wise, B. M.; Gallagher, N. B., PLS Toolbox for use with Matlab,
Version 1.5.1, Eigenvector Technologies, Manson, 1995. 34. Golbraikh, A.; Tropsha, A.; J. Mol. Graph. Modell.2002, 20,
269.
35. Kiralj, R.; Ferreira, M. M. C.; J. Braz. Chem. Soc. 2009, 20, 770.
Submitted: August 3, 2010
Published online: November 25, 2010
Supplementary Information
J. Braz. Chem. Soc., Vol. 22, No. 4, S1-S7, 2011. Printed in Brazil - ©2011 Sociedade Brasileira de Química
0103 - 5053 $6.00+0.00
S
I
*e-mail: [email protected]
2D Chemical Drawings Correlate to Bioactivities: MIA-QSAR Modelling of
Antimalarial Activities of 2,5-Diaminobenzophenone Derivatives
Rodrigo A. Cormanich,a Matheus P. Freitas*,b and Roberto Rittnera
aChemistry Institute, University of Campinas, PO Box 6154, 13083-970 Campinas-SP, Brazil
bChemistry Department, Federal University of Lavras, PO Box 3037, 37200-000 Lavras-MG, Brazil
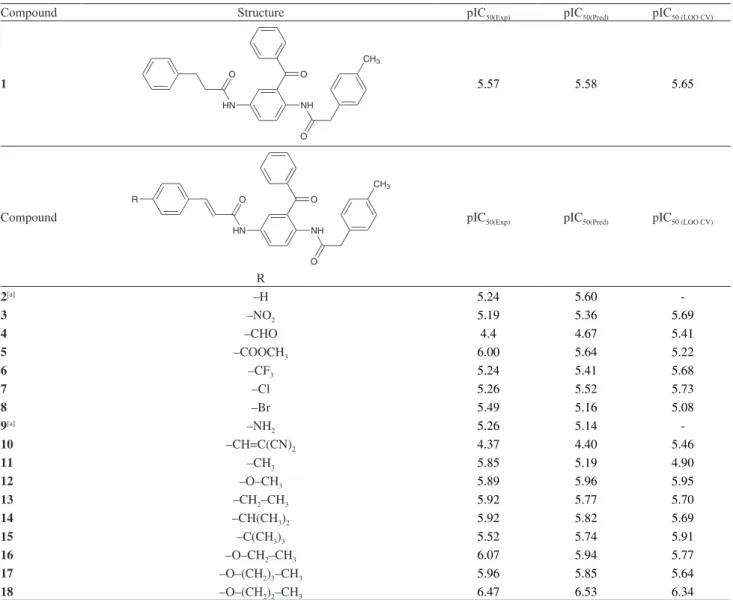
Table S1. Structures of data set, and experimental, predicted and cross-validated (LOO) pIC50 for the series of 2,5-diaminobenzophenone derivatives
Compound Structure pIC50(Exp) pIC50(Pred) pIC50 (LOO CV)
1
HN O
NH
O
CH3
O
5.57 5.58 5.65
Compound
HN O
NH
O
CH3
O R
R
pIC50(Exp) pIC50(Pred) pIC50 (LOO CV)
2[a] –H 5.24 5.60
-3 –NO2 5.19 5.36 5.69
4 –CHO 4.4 4.67 5.41
5 –COOCH3 6.00 5.64 5.22
6 –CF3 5.24 5.41 5.68
7 –Cl 5.26 5.52 5.73
8 –Br 5.49 5.16 5.08
9[a] –NH
2 5.26 5.14
-10 –CH=C(CN)2 4.37 4.40 5.46
11 –CH3 5.85 5.19 4.90
12 –O–CH3 5.89 5.96 5.95
13 –CH2–CH3 5.92 5.77 5.70
14 –CH(CH3)2 5.92 5.82 5.69
15 –C(CH3)3 5.52 5.74 5.91
16 –O–CH2–CH3 6.07 5.94 5.77
17 –O–(CH2)3–CH3 5.96 5.85 5.64
2D Chemical Drawings Correlate to Bioactivities J. Braz. Chem. Soc. S2
Compound
Structure
HN O
NH
O O O
H3C
R
R
pIC50(Exp) pIC50(Pred) pIC50 (LOO CV)
19 5.05 4.92 4.90
20[a] 5.47 5.50
-21 5.6 6.10 6.18
22[a]
O
5.89 6.56
-23 5.62 5.86 6.06
24
Cl
6.46 6.31 6.00
25
Br
6.51 6.36 6.08
26
Br
6.00 5.72 5.87
27
CF3
6.92 6.79 6.29
28 4.62 4.76 5.41
29
O
Cormanich et al. S3 Vol. 22, No. 4, 2011
Compound
Structure
HN O
NH
O O
CH3
O R
R
pIC50(Exp) pIC50(Pred) pIC50 (LOO CV)
30[a] 6.38 6.52
-31 6.00 6.13 6.74
32 6.70 6.65 6.65
33 6.92 6.89 6.85
34 7.06 6.96 6.88
35 7.07 6.98 6.88
36[a]
6.52 6.83
-37
O
6.89 6.91 6.89
38
O
6.52 6.41 6.51
39
O
6.12 6.19 6.72
40
O CF3
6.68 6.77 6.83
41[a]
S
7.08 6.83
-42
F
6.49 6.48 6.60
43
Cl
2D Chemical Drawings Correlate to Bioactivities J. Braz. Chem. Soc. S4
44
Br
6.9 6.83 6.72
45
NO2
7.12 6.77 6.53
46[a]
NO2
6.23 6.55
-47
NO2
6.17 6.29 6.45
48
CF3
7.11 6.91 6.61
49
NH2
6.59 6.87 7.00
50
CN
6.66 6.79 6.73
51
O
7.17 6.79 6.56
52
O
O 6.77 6.81 6.91
53
O
NH2 6.25 6.60 6.97
54
H
N H
O
6.55 6.63 6.54
55[a]
H N
O
6.25 6.48
-56
S O
O 7.43 7.07 6.77
57
S O
O 7.22 7.17 6.88
58 S NH2
O
Cormanich et al. S5 Vol. 22, No. 4, 2011
Compound
Structures
HN O
NH
O O O
O2N
R
R
pIC50(Exp) pIC50(Pred) pIC50 (LOO CV)
59 5.52 5.61 5.75
60[a]
Cl
5.6 5.58
-61 5.6 5.45 5.69
62 6.11 6.19 6.20
63 6.57 6.79 6.71
64[a]
O
6.49 6.95
-65 6.82 6.82 6.59
66 6.19 6.10 6.12
67
F
6.64 7.06 7.05
68[a]
Cl
7.19 7.14
-69
Br
7.15 7.25 7.07
70[a]
Br
6.00 6.61
-71
CF3
2D Chemical Drawings Correlate to Bioactivities J. Braz. Chem. Soc. S6
72
CF3
6.00 6.35 6.61
73
NO2
5.85 6.24 7.01
74 6.60 6.55 6.38
75 6.68 6.76 6.58
76 6.00 5.65 5.57
77 5.26 5.17 6.30
78 6.51 6.40 6.38
79
OH
5.48 5.71 6.21
80[a]
O
5.89 6.33
-81 6.36 6.27 6.18
82[a]
CF3
7.21 6.89
-83
CF3
6.2 6.17 6.16
84
F3C
5.96 6.05 6.38
85
F
6.36 6.32 6.26
86[a]
Cl
-Cormanich et al. S7 Vol. 22, No. 4, 2011
87
Br
6.77 6.46 6.31
88[a]
NO2
5.85 5.83
-89
NH O
O
6.05 6.10 6.33
90[a]
NH2
5.92 6.29
-91
NH O
O
6.38 6.14 6.03
92
NH2
6.24 6.33 6.53