Artigo
*e-mail: [email protected]
REMOVAL OF PHENOL AND CONVENTIONAL POLLUTANTS FROM AQUEOUS EFFLUENT BY CHITOSAN AND CHITIN
Maria Aparecida L. Milhome
Departamento de Engenharia Hidráulica e Ambiental, Centro de Tecnologia, Universidade Federal do Ceará, Campus do Pici, 60451-970 Fortaleza – CE, Brasil
Denis de Keukeleire
Ghent University, Faculty of Pharmaceutical Sciences, Harelbekestraat 72, B-9000 Ghent, Belgium Jefferson P. Ribeiro e Ronaldo F. Nascimento*
Departamento de Química Analítica e Físico-Química, Centro de Ciências, Universidade Federal do Ceará, Campus do Pici, 60451-970 Fortaleza – CE, Brasil
Tecia Vieira Carvalho
Parque de Desenvolvimento Tecnológico do Ceará, Universidade Federal do Ceará, Campus do Pici, Fortaleza – CE, Brasil Danilo Caldas Queiroz
Departamento de Química Orgânica e Inorgânica, Universidade Federal do Ceará, Campus do Pici, Fortaleza – CE, Brasil
Recebido em 7/1/09; aceito em 27/4/09; publicado na web em 7/10/09
The present study deals with phenol adsorption on chitin and chitosan and removal of contaminants from wastewater of a petroleum reinery. The adsorption kinetic data were best itted to irst- and second-order models for chitosan and chitin, respectively. The results of adsorption isotherms showed Langmuir model more appropriately described than a Freundlich model for both adsorbents. The adsorption capacity was 1.96 and 1.26 mg/g for chitin and chitosan, respectively. Maximum removal of phenol was about 70-80% (low rate: 1.5 mL/min, bed height: 18.5 cm, and 30 mg/L of phenol. Wastewater treatment with chitin in a ixed-bed system showed reductions of about 52 and 92% for COD and oil and greases, and for chitosan 65 and 67%, respectively. The results show improvement of the efluent quality after treatment with chitin and chitosan.
Keywords: adsorption; chitosan; phenol.
INTRODUCTION
One of the major problems of the petrochemical industry is the great amount of wastewater produced and the high investment needed for the treatment of this efluent before it is released in the environ-ment. In particular, phenol is present in signiicant concentrations, while it is highly toxic and accumulates in the environment.1
Phenol can be removed from polluted water by chemical oxida-tion2,3 or solvent extraction,4,5 by using membranes6,7 and by biological treatments.8 However, these processes are not really eficient. An alternative is the use of adsorption methods and, in fact, this has been mostly applied for phenol removal and others organic compounds from polluted wastewaters.9-11 A high eficiency is combined with recovery of solvents and removal of unwanted properties including color and odor. Activated carbon has been widely used for phenol removal,12,13 but other adsorbents have been applied as well inclu-ding peat, bentonite,14 amberlite resin,15,16 biomass,8 silica gel and activated alumina,10 activated carbon zeolite,17 coir pith carbon,18 ly ash,19 chitin20 and chitosan.21
Special attention has been paid to chitin, a natural polymer extracted from crab and shrimp shells, and chitosan, a derivative of chitin. These adsorbents have attracted much interest, because of their biodegradability, biocompatibility and hydrophilicity. Their use in the treatment of water and efluents has shown to be useful for removal of metals, 22-24 phenols,25 dyes,26 quinones27 and others.28-30
Chitin is obtained by treatment with dilute sodium hydroxide for deproteinization, followed by treatment with dilute hydrogen chloride for demineralization. Chitosan is produced by alkaline deacetylation
of chitin. Alternatively, enzymatic treatment31 has been developed to reduce the environmental impact and to reduce the cost of processing.
The present study focused on phenol adsorption by chitin and chitosan using batch and column systems for possible use in the treat-ment of wastewater from petrochemical industries. The improvetreat-ment of the quality of the efluent was evaluated by removal of phenol and the changes of physicochemical parameters such as pH, conductivity, chemical oxygen demand (COD), total oil and greases (TOG) and dissolved solids (DS).
EXPERIMENTAL
Materials
The wastewater investigated was obtained from the petroleum reinery LUBNOR (Lubriicantes e Derivados de Petróleo do Nordeste, Fortaleza, CE, Brazil). Chitin (light white; ashes 0.30%; 60-200 mesh; molecular weight: 400,000 g/mol; pH 4.28) and chitosan (light yellow; 60-200 mesh; molecular weight: 174,205 g/mol, degree of deacetylation 90%, pH 7.93) were supplied by Delta - Natural and Dietary Products (Parnaíba, PI, Brazil). All reagents and solvents (Merck) were of analytical grade. A stock solution (1000 mg/L) of phenol was prepared and the standard solutions were obtained by diluting to the desired concentrations (10-50 mg/L). Chitosan and chitin were puriied by soxhlet extraction and sonication as described by Rhee et al..32 Methods
Batch adsorption studies
spiked with known amounts of phenol ranging from 10 to 50 mg/L and adsorption studies were carried out batchwise in order to obtain kinetic rates and equilibrium data. Closed lasks containing a known amount of adsorbent were agitated by shaking (150 rpm) for a period of 24 h at a particular pH and all experiments were conducted at room temperature (28±2 oC). pH changes during the course of the measurements were not observed.
The effects of the dosage of adsorbent (2.5 x 10⁻³ to 2.5 x 10⁻² g/ mL) and of pH (2 to 10) were studied. Kinetics and isotherms were determined using 0.2 g adsorbent and 20 mL phenol solution (10 to 50 mg/L) at equilibrium. After iltration (0.45 µm membrane porosity), the residual phenol concentration was determined by HPLC. The adsorption capacity was obtained using Equation 1:
(1)
where: qe is the adsorption capacity (mg/g), Co and Ce are the initial and equilibrium concentrations (mg/L), respectively, of phenol in solution, V is the volume (L), and W is the weight (g) of the adsorbent. Column adsorption studies
A glass column (30 cm x 11 mm i.d.) illed with known mass of adsorbent corresponding to bed heights of 3.5, 8.5 and 18.5 cm, respectively, was percolated with 30 mL phenol solution (30 mg/L, at pH 6) at low rates of 1.5, 3.0 and 6.0 mL/min, respectively. The characteristics of the bed are given in Table 1.
Breakthrough curves of model and wastewater samples (spiked with 30 mg phenol/L) were determined in order to investigate the column capacity at complete exhaustion. The breakthrough curves were obtained by plotting C/Co versus eluent volume. Aliquots of 10 mL were collected at the exit of the column for measuring the phenol concentration.
Regeneration of the adsorbent was effected by using ethanol-water (1:1 v/v) as eluent (ive times). For each cycle, 20 mL ethanol-water was percolated irst, followed by 10 mL efluent and 10 mL of eluent. The percentages of removal were calculated for each cycle.
All column experiments were performed in duplicate at room temperature (28 ± 2 oC) and pH 6.0.
Chromatographic analysis of phenol
The phenol concentrations were determined by high-performance liquid chromatography (HPLC) using a Shimadzu SPD-10 A chro-matograph equipped with a LiChrospher 60 RP-select B column (12 cm, 5 mm i.d.) and an UV detector. The isocratic mobile phase was water-methanol 30:70 v/v, the low-rate was 1 mL/min, and detec-tion was done at 270 nm. Before analysis, supernatant samples were iltered (0.45 µm membrane porosity).
Column adsorption in wastewater treatment
Treatment of the wastewater from a local petroleum reinery was carried out using a column illed with adsorbent (chitosan and chitin) for determination of various parameters including ‘Chemical Oxygen Demand’ (COD), ‘Total Oils and Greases’ (TOG), and ‘Dissolved Solids’ (DS) following procedures by ‘Standard Methods for the Examination of Water and Wastewater’.
RESULTS AND DISCUSSION
Batch adsorption studies
Effect of adsorbent mass
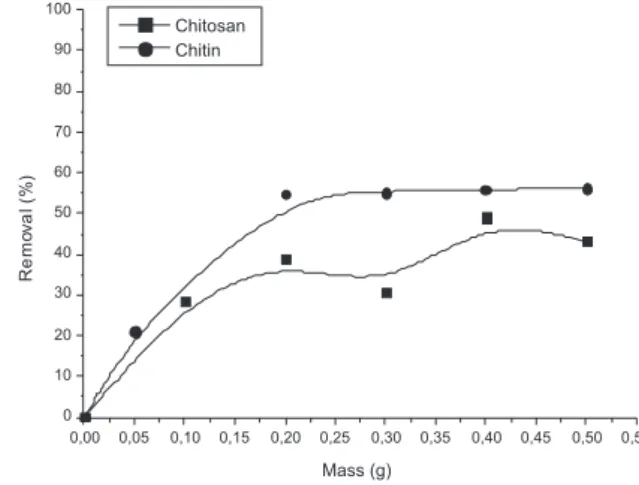
The effect of the dosage of adsorbent (2.5 x 10⁻³ to 2.5 x 10⁻² g/mL) on phenol removal is shown in Figure 1. It can be observed that phenol adsorption increases in the range (5 x10⁻³-1 x 10⁻² g/mL) for both chitin and chitosan. According to this result, the adsorbent dosage was ixed at 1 x 10⁻² g/mL for all further experiments. Several factors inluence the eficiency of phenol adsorption, such as changes pH and particle size (in this case: 60-200 mesh). Generally, smaller particles have greater capacity of analyte removal.
Effect of pH
The effect of pH on phenol adsorption by chitin and chitosan is represented in Figure 2. The data show that the phenol removal increa-sed with decreasing initial pH for both adsorbents. Chitin and chitosan contain functional groups such as hydroxy, acetamido, and amino that are prone to adsorb molecules by hydrogen bonds, Van der Waals inte-ractions, and ion exchanges. Depending on the pH, the amino groups are present in protonated or neutral forms. At low pH, the ammonium groups may exert electrostatic interaction with phenolates thereby increasing the adsorption eficiency. This behavior can be explained considering the fact that variations of pH affect the ionization of phenol (Equation 2a) and the surface properties of the adsorbent, denoted as Ads (Equations 2b, 2c).
C6H5OH D H+ +C 6H5O
- (2a)
Ads + H+ D Ads-H+ (2b)
Ads-H+ +C 6H5O
-D Ads-H+-OC
6H5 (2c)
As expected, adsorption decreases with increasing pH values
(Fi-Figure 1. Effect of adsorbent dosage on removal of phenol by chitin and
chi-tosan. Phenol concentration: 30 mg/L; pH 6; agitation time: 24 h; ambient temperature: 28 ± 2 oC
Table 1. Properties of ixed-bed adsorbent
Property Chitosan Chitin
Granulometry (mesh) 60-250 60-250
Diameter (D) (cm) 1.10 1.10
Bed height (L) (cm) 18.5 18.5
Adsorbent mass (g) 1-3.90 1.2-3.36
Apparent density (g/cm3) 0.24 0.22
Packed density (ρE) (g/cm3) 0.22 0.19
Particles volume (Vap) (cm3) 16.25 15.41
gure 2), which may be attributed to the above factors. The phenolate fraction can be calculated from Equation 3:
(3)
where: C0 is the initial phenol concentration, the pKa of phenol is 9.9, and the pH is variable.
Phenol is adsorbed to a lesser extent at higher pH values due to repulsive forces. Similar behavior has been reported by Halhouli et al.33 for phenol adsorption by activated carbon and by Banat et al.14 for phenol adsorption by bentonite. Similar results have also been obtained for phenol adsorption with chitosan,34 chitin,35 and bagasse ly ash.19,36 It should be taken into account that, in this work, all ex-periments were conducted at pH 6 due to the solubility of chitosan at low pH, furthermore because of the pH of the wastewater investigated. Adsorption kinetics
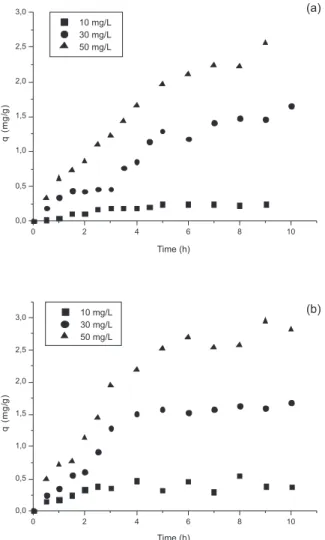
In order to investigate the kinetics of phenol adsorption on chitin and chitosan, pseudo-irst order, pseudo-second order, and intraparticle diffusion models were used. The adsorption kinetics were carried out for three initial phenol concentrations, 10, 30 and 50 mg/L, respectively, at adsorbent dosages of 1x10⁻² g/mL. The results, presented in Figures 3a and 3b, show that equilibrium was reached within 3, 5 and 6 h for chitosan, and within 3, 4 and 5 h for chitin.
The experimental data were applied to the kinetic models for determi-nation of the rate constants (K1 and K2) using the equations of pseudo-irst order (Equation 4) and pseudo-second order (Equation 5), respectively:
(4) (5)
where: qe is the amount of phenol adsorbed at equilibrium, q is the adsorption capacity at time t, and K1 and K2 are rate constants of irst order and second order, respectively.
The rate constants K1 and K2 were calculated from log (qe-q) versus t and t/q versus t, respectively, for three initial concentrations. They are represented together with the correlation coeficients and adsorption capacities (Table 2). Based on results of experimental (qe) and predicted (qt) values, it can be noted that phenol adsorption on chitosan agrees well with irst-order kinetics, indicating that the
limiting stage of the adsorption process is a weak interaction with reversible character. However, results for chitin (Table 2) show that a pseudo-second-order model describes satisfactorily the adsorption of phenol, suggesting that the limiting stage of adsorption is a chemical interaction between phenol and adsorbent. Dursun et al.35 also obser-ved that phenol adsorption onto chitin follows second-order kinetics. As is known, two intraparticle diffusion mechanisms are involved in the adsorption rate: diffusion within the pore volume (pore diffusion), diffusion along the surface of the pores (surface diffusion). Pore diffu-sion and surface diffudiffu-sion occur in parallel within the adsorbent particle.
Adsorption isotherms
The adsorption isotherms (relationship between adsorption ca-pacities and phenol concentrations at equilibrium) are given in Figure 4. The equilibrium adsorption data of phenol are well described by Langmuir (Equation 6) and Freundlich (Equation 7) models:
(6)
logq = logKF + (1/n) logCe (7)
where: q is the amount adsorbed (mg/g), Ce is the equilibrium con-centration of phenol (mg/L), qmax and KL are the Langmuir constants
Figure 2. Effect of pH on phenol removal by chitin and chitosan. Adsorbent
dosage: 1x10⁻² g/mL; phenol concentration: 30 mg /L; agitation time: 24 h;
ambient temperature: 28 ± 2 oC
Figure 3. Effect of agitation time and phenol concentration on adsorption of
(a) chitosan and (b) chitin. pH: 6.0; adsorbent dosage: 1x10⁻² g/mL; ambient
related to maximum adsorption capacity (mg/g) and energy of ad-sorption, respectively, and KF and n are Freundlich constants related to adsorption capacity and adsorption intensity, respectively.
The Langmuir and Freundlich constants calculated from the linear plots of 1/qe versus 1/Ce and log qe versus log Ce together with the correlation coeficients ( r2 ) are given in Table 3. The the-oretical data using Langmuir and Freundlich parameters from Table 3 are shown in Figure 4 to asses the validation of the model from the experimental data indicating that the adsorption equilibrium data for phenol followed the Langmuir and Freundlich isotherms for the adsorbents.
However, a better criterion to test the correctness of the its of the data is the normalized percent deviation,37 which agrees with Equation 8:
(8)
where: qex is the experimental adsorption capacity, qpred is the predicted adsorption capacity, and N is the number of observations.
The lower the value of the percent deviation P is, the better the it is (for values less than 5). The calculated P values (Table 3) suggest that the adsorption process for both adsorbents follows a Langmuir model occurring in monolayer surface. Maximum adsorption capacity (mg/g) was found to be 1.96 and 1.26 mg/g for chitin and chitosan, respectively. The favorable nature of adsorption can be expressed in terms of the separation factor RL, wich is deined in Equation 9:
(9)
where: KL is the Langmuir constant and Co is the initial phenol concentration.
The parameter RL can be used to predict the afinity between the adsorbent and the adsorbate according to the criteria: not-favorable for RL > 1, linear for RL = 1 r, favorable for 0 < RL < 1, and irreversible for RL = 0. All values of RL calculed for chitin and chitosan vary between 0 and 1 indicating that adsorption is favorable for both adsorbents.
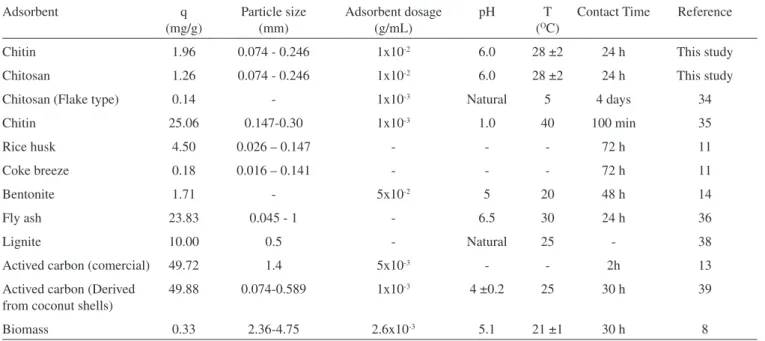
Table 4 provides the values of the adsorption capacities (mg/g) of adsorbents reported in other papers. It can be seen that activated carbon, ly ash, and chitin are eficient for removal of phenols. Also, chitin and chitosan have eficiencies comparable to other low-cost adsorbents like rice husk, cooke breeze, and grain rusk. New technologies to increase the adsorption capacity of chitosan have been developed through che-mical modiication including substitution and cross-linking of chitosan chains. However, the cost of the material may be higher.
Column adsorption studies
Effect of low rate
The results indicated that phenol removal decreased with increa-sed low rates for both adsorbents, which is due to an increase of the hydraulical load (1.58-6.32 mL/min cm2) in the column by an increase of the low rate (1.5-6.0 mL/min). A low rate of 1.5 mL/min has been adopted for further work. Large-scale applications of ixed-bed systems using chitin may cause problems due to clogging during the continuous low of wastewater. Hence, it is necessary to optimize the system by adjusting the operational parameters. Moreover, a change of downlow to uplow may minimize clogging.
Table 2. Kinetic parameters of phenol adsorption by chitin and chitosan
Experimental Pseudo -irst-order
kinetic model
Pseudo- second-order kinetic model
Diffusion model
Adsorbent Co
(mg/L)
qe (mg/g)
K1 (h-1)
qt (mg/g)
R2 K
2 (g/mg.h)
qt (mg/g)
R2 K
i (mg/g.h-1/2 )
R2
Chitosan 10 0.24 0.45 0.27 0.98 1.46 0.31 0.96 0.15 0.97
30 1.49 0.20 1.47 0.95 0.05 2.76 0.93 0.66 0.93
50 2.33 0.38 2.71 0.96 0.03 4.46 0.96 1.04 0.98
Chitin 10 0.40 0.31 0.25 0.94 2.74 0.43 0.99 1.68 0.94
30 1.58 0.66 2.27 0.91 0.69 1.83 0.99 1.08 0.93
50 2.70 0.60 4.61 0.95 0.32 3.11 0.8 0.10 0.80
Figure 4. Adsorption isotherms of chitosan and chitin. pH: 6.0; adsorbent
dosage:1x10⁻² g/mL; ambient temperature: 28±2 oC
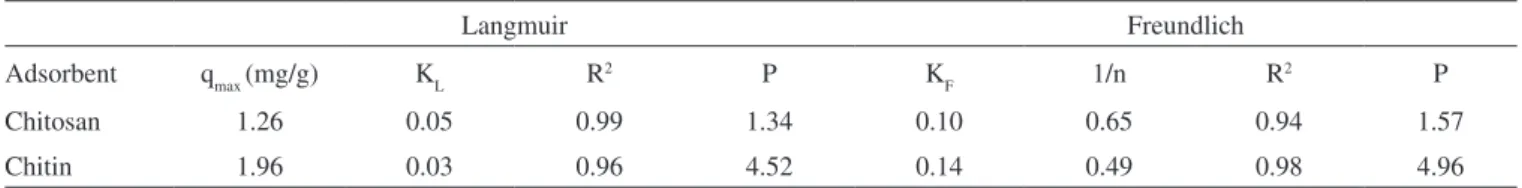
Table 3. Parameters for Langmuir and Freundlich models
Langmuir Freundlich
Adsorbent qmax (mg/g) KL R2 P K
F 1/n R
2 P
Chitosan 1.26 0.05 0.99 1.34 0.10 0.65 0.94 1.57
Figure 5. Breakthrough curves for (a) chitosan and (b) chitin. Phenol con-centration: 30 mg/L; pH: 6; low rate: 1.5 mL/min; bed height: 18.5 cm; ambient temperature: 28±2 oC
Effect of bed height
The effect of the bed height (mass of adsorbent) on phenol ad-sorption was done at a constant feed concentration of 30 mg/L and a low rate of 1.5 mL/min. When the bed height increases from 3.5 to 18.5 cm, the percentage of phenol removal reaches 80% and this parameter was chosen for the studies on breakthrough curve. Breakthrough curves
The breakthrough curves were obtained by plotting C/Co versus volume at 30 mg/L phenol concentration of phenol in order to deter-mine the volume and capacity saturation. Figures 5a and 5b show the breakthrough curves for chitin and chitosan, respectively, for model and wastewater samples. It can be observed that the breakthrough volumes for chitin and chitosan are 30 and 20 mL, respectively. The volume of saturation (Vx), for the adsorbents were reached for a volume of 75 mL at 46.7 min (tx).
The breakthrough capacities calculated from the curves (at C/Co = 0.5) are 0.10 mg/g for both adsorbents. The column ca-pacities were lower than the Langmuir caca-pacities (Table 3). This discrepancy may be due to incomplete saturation of the active sites due to the limited time of equilibration achieved under dynamic column conditions. The operational column parameters are helpful in designing a ixed adsorber for phenol removal from wastewaters. The length of ‘Unused Bed’ (LUB) was calculated using Equation 10:
(10)
where: L is the weight of the bed (cm), Vb is the breakthrough volume (mL), and V* is the stechiometric volume (mL) that corresponds to half of the volume of saturation (Vx). The values of LUB for chitin and chitosan are 2.6 and 7.9 cm, respectively.
Adsorbent regeneration
Experiments were carried out using ethanol-water (1:1 v/v) at a low rate of 1.5 mL/min, a bed height of 18.5 cm, and a phenol feed concentration of 30 mg/L. The adsorbents were regenerated using
ethanol-water (1:1 v/v) and could be reused after four cycles with a regeneration eficiency of 95%. The regeneration procedure leads to liquid contaning ethanol-water and an organic residue. These can be easily separated by distillation.
Table 4. Comparison of the adsorption capacities of different adsorbents
Adsorbent q
(mg/g)
Particle size (mm)
Adsorbent dosage (g/mL)
pH T
(OC)
Contact Time Reference
Chitin 1.96 0.074 - 0.246 1x10⁻² 6.0 28 ±2 24 h This study
Chitosan 1.26 0.074 - 0.246 1x10⁻² 6.0 28 ±2 24 h This study
Chitosan (Flake type) 0.14 - 1x10⁻³ Natural 5 4 days 34
Chitin 25.06 0.147-0.30 1x10⁻³ 1.0 40 100 min 35
Rice husk 4.50 0.026 – 0.147 - - - 72 h 11
Coke breeze 0.18 0.016 – 0.141 - - - 72 h 11
Bentonite 1.71 - 5x10⁻² 5 20 48 h 14
Fly ash 23.83 0.045 - 1 - 6.5 30 24 h 36
Lignite 10.00 0.5 - Natural 25 - 38
Actived carbon (comercial) 49.72 1.4 5x10⁻³ - - 2h 13
Actived carbon (Derived from coconut shells)
49.88 0.074-0.589 1x10⁻³ 4 ±0.2 25 30 h 39
Wastewater treatment by adsorption in column
Experiments were carried out with a column illed with adsor-bent (chitosan and chitin) for determination of following parame-ters: pH, conductivity, chemical oxygen demand (COD), total oil and greases (TOG), and dissolved solids (DS). The wastewater was taken from a local petroleum reinery local. The results are shown in Table 5. It can be observed that the wastewater contains high concentrations of COD (490 mg/L), TOG (653 mg/L) and DS (862 mg/L). The treatment with chitin and chitosan led to a signiicant reduction of the pollutants.
The wastewater after chitin treatment gave 52% COD removal and 92% TOG removal. After chitosan treatment, reduction of COD and TOG were around 65 and 67%, respectively. Conductivity, tur-bidity and DS were satisfactorily reduced from 1.4 to 0.80 mS/cm; from 27 to 6.0 UT, from 862 to 700 mg/L for chitin. For chitosan, reductions were as follows: from 1.4 to 0.80 mS/cm; 27 to 3.0 UT, 862 to 615 mg/L, as shown in Table 5. A drastic de coloration was observed after the treatments.
CONCLUSIONS
Adsorption of phenol at chitin and chitosan was most efi-cient into the pH range of 2.0-5.0. The adsorption data followed pseudo-irst order kinetics for chitosan and second-order kinetics for chitin. Complete removal of 30 mg/L phenol from industrial wastewater proved possible using 1 x 10⁻²g/mL of adsorbent dosage. Four adsorption/desorption cycles were carried out with ethanol-water (1:1, v/v) as desorbing agent without appreciable reduction in adsorption capacity. The parameters from industrial wastewater as measured by pH, COD and TOG were drastically reduced after treatment with chitin and chitosan. Thus, the present study suggests that chitin and chitosan are attractive low-cost na-tural adsorbents for removal of phenol and other pollutants from industrial wastewaters.
ACKNOWLEDGEMENTS
The authors would like to thank CNPq, FUNCAP, Fundação Núcleo de Tecnologia Industrial do Ceará (NUTEC), and Parque de Table 5. Parameters of the wastewater quality
Parameter Inluent Efluent
Chitin Chitosan
pH 7.0 7.1 7.9
Conductivity (mS/cm) 1.4 0.8 0.8
Turbidity (UT) 27 6.0 3.0
Chemical Oxygen Demand (mg/L)
490 233 169
Total Oils and Greases (mg/L)
653 50 210
Dissolved Solids (mg/L)
862 700 615
Desenvolvimento Tecnológico do Ceará (PADETEC) for providing all facilities to carry out this work.
REFERENCES
1. Wake, H.; Estuarine, Coastal and Shelf Science 2005, 62, 131. 2. Körbahti, B.; Tanyolaç, A.;Water Res. 2003, 37, 1505.
3. Santiago, M.; Stuber, F.; Fortuny, A.; Fabregat, A.; Font, J.; Carbon 2005, 43, 2134.
4. Li, Z.; Wu, M.; Jiao, Z.; Bao, B.; Lu., S.; J. Hazard. Mater. 2004,114, 111. 5. Yang, C.; Qian, Y.; Zhang, L.; Feng., J.; Chem. Eng. J.2006, 117, 179. 6. Goncharuk, V.; Kucheruk, D.; Kochkodan, V.; Badekha, V.; Desalination
2002, 143, 45.
7. Ubeyde, I.; Filtr. Sep. 2004, 41, 39.
8. Rao, J.; Viraraghavan, R.; Bioresour. Technol. 2002,85, 165.
9. Crisafulli, R.; Milhome, M. A.; Cavalcante, R.; Silveira, E.; Keukeleire, D.; Nascimento, R.F.; Bioresour. Technol. 2008, 99, 4515.
10. Roostaei, N.; Tezel, F.; J. Environ. Manag.2004, 70, 157.
11. Ahmaruzzaman, M.; Sharma, D.; J. ColloidInterface Sci.2005, 287, 14. 12. Gonzalez-Serrano, E.; Cordero, T.; Rodriguez-Mirasol, J.; Cotoruelo,
L.; Rodriguez, J.; Water Res.2004, 38, 3043. 13. Ozkaya, B.; J. Hazard. Mater. 2006, 129, 158.
14. Banat, F.; AlL-bashir, B.; AlL-asheh, S.; Hayajneh, O.; Environ. Pollut.
2000, 107, 391.
15. Ku, Y.; Lee, K.; J. Hazard. Mater. 2000, 80, 59.
16. Carmona, M.; Lucas, A.; Valverde, J.; Velasco, B.; Rodriguez, J.; Chem. Eng. J.2006, 117, 155.
17. Su, F.; Lu, L.; Hui, T.; Zhao, X.; Carbon2005, 43, 1156. 18. Namasivayam, C.; Kavitha, D.; J. Hazard. Mater. 2003,98, 257. 19. Kao, P.; Tzeng, J.; Huang, T.; J. Hazard. Mater.2007, 6, 237. 20. Figueiredo, S.; Loureiro, J.; Boaventura, R.; Water Res. 2005, 39, 4142. 21. Crini, G.; Prog. Polym. Sci. 2005, 30, 38.
22. Kaminski, W.; Tomczak, E.; Jaros,. K.; Desalination 2008, 218, 281. 23. Janegitz, B. C.; Lourenção, B. C.; Lupetti, K. O.; Fatibello-Filho, O.;
Quim. Nova2007, 30, 879.
24. Guinesi, L.; Esteves, A.; Cavalheiro, E. T. G.; Quim. Nova2007, 30, 809. 25. Popa, M.; Aelenei, N.; Popa, V.; Andrei, D.; React. Funct. Polym.2000,
45, 35.
26. Akkaya, G.; Uzun, I.; Guzel, F.; Dyes Pigm. 2007, 73, 168.
27. Muzzarelli, R.; Littarru, G.; Muzzarelli, C.; Tosi, G.; Carbohydr. Res. 2003, 53, 109.
28. Kumar, R.; Majeti, N.;React. Funct. Polym. 2000, 46, 1. 29. Guibal, E.; Prog. Polym. Sci. 2005, 30, 71.
30. Laus, R.; Laranjeira, M. C. M.; Martins, A; Fávere, V.; Pedrosa, R.; Benassi, J.; Geremias, R.; Quim. Nova2006, 29, 34.
31. Campana-Filho, S.; Britto, D.; Curti, E.; Abreu, F.; Cardoso, M.; Battisti, M.; Sim, P.; Goy, R.; Signini, R.; Lavall, R.; Quim. Nova2007, 30, 644. 32. Rhee, J.; Jung, M.; Paeng, K.; Anal. Sci. 1998, 14, 1089.
33. Halhouli, K.; Darwish, N.; Al-Dhoon N.; Sep. Sci. Technol. 1995, 30, 3313.
34. Zheng, S.; Yang, Z.; Jo, D.; Park, Y;Water Res. 2004, 38, 2315. 35. Dursun, A.; Kalayci Ç.; J. Hazard. Mater. 2005, 123, 151.
36. Srivastava, V.; Swamy, M.; Mall, I.; Prasad, B.; Mishra, I.; Colloids Surf. B2006, 272, 89.
37. Ayranci, E.; Duman, O.;J. Hazard. Mater.2005, 30, 125.